Frisco Airbnb Market Analysis 2026: Short Term Rental Data & Vacation Rental Statistics in Colorado, United States
Is Airbnb profitable in Frisco in 2026? Explore comprehensive Airbnb analytics for Frisco, Colorado, United States to uncover income potential. This 2026 STR market report for Frisco, based on AirROI data from February 2025 to January 2026, reveals key trends in the market of 853 active listings.
Whether you're considering an Airbnb investment in Frisco, optimizing your existing vacation rental, or exploring rental arbitrage opportunities, understanding the Frisco Airbnb data is crucial. Understanding the local regulations is key to maximizing your short term rental income potential. Let's dive into the specifics.
Key Frisco Airbnb Performance Metrics Overview
Monthly Airbnb Revenue Variations & Income Potential in Frisco (2026)
Understanding the monthly revenue variations for Airbnb listings in Frisco is key to maximizing your short term rental income potential. Seasonality significantly impacts earnings. Our analysis, based on data from the past 12 months, shows that the peak revenue month for STRs in Frisco is typically March, while May often presents the lowest earnings, highlighting opportunities for strategic pricing adjustments during shoulder and low seasons. Explore the typical Airbnb income in Frisco across different performance tiers:
- Best-in-class properties (Top 10%) achieve $9,687+ monthly, often utilizing dynamic pricing and superior guest experiences.
- Strong performing properties (Top 25%) earn $6,294 or more, indicating effective management and desirable locations/amenities.
- Typical properties (Median) generate around $3,756 per month, representing the average market performance.
- Entry-level properties (Bottom 25%) see earnings around $2,009, often with potential for optimization.
Average Monthly Airbnb Earnings Trend in Frisco
Frisco Airbnb Occupancy Rate Trends (2026)
Maximize your bookings by understanding the Frisco STR occupancy trends. Seasonal demand shifts significantly influence how often properties are booked. Typically, Februarysees the highest demand (peak season occupancy), while May experiences the lowest (low season). Effective strategies, like adjusting minimum stays or offering promotions, can boost occupancy during slower periods. Here's how different property tiers perform in Frisco:
- Best-in-class properties (Top 10%) achieve 73%+ occupancy, indicating high desirability and potentially optimized availability.
- Strong performing properties (Top 25%) maintain 55% or higher occupancy, suggesting good market fit and guest satisfaction.
- Typical properties (Median) have an occupancy rate around 36%.
- Entry-level properties (Bottom 25%) average 20% occupancy, potentially facing higher vacancy.
Average Monthly Occupancy Rate Trend in Frisco
Average Daily Rate (ADR) Airbnb Trends in Frisco (2026)
Effective short term rental pricing strategy in Frisco involves understanding monthly ADR fluctuations. The Average Daily Rate (ADR) for Airbnb in Frisco typically peaks in January and dips lowest during May. Leveraging Airbnb dynamic pricing tools or strategies based on this seasonality can significantly boost revenue. Here's a look at the typical nightly rates achieved:
- Best-in-class properties (Top 10%) command rates of $675+ per night, often due to premium features or locations.
- Strong performing properties (Top 25%) achieve nightly rates of $476 or more.
- Typical properties (Median) charge around $337 per night.
- Entry-level properties (Bottom 25%) earn around $247 per night.
Average Daily Rate (ADR) Trend by Month in Frisco
Get Live Frisco Market Intelligence 👇

Explore Real-time Analytics
Airbnb Seasonality Analysis & Trends in Frisco (2026)
Peak Season (March, February, December)
- Revenue averages $8,559 per month
- Occupancy rates average 55.1%
- Daily rates average $504
Shoulder Season
- Revenue averages $4,217 per month
- Occupancy maintains around 37.3%
- Daily rates hold near $375
Low Season (May, October, November)
- Revenue drops to average $2,535 per month
- Occupancy decreases to average 25.0%
- Daily rates adjust to average $360
Seasonality Insights for Frisco
- The Airbnb seasonality in Frisco shows highly seasonal trends requiring careful strategy. While the sections above show seasonal averages, it's also insightful to look at the extremes:
- During the high season, the absolute peak month showcases Frisco's highest earning potential, with monthly revenues capable of climbing to $10,184, occupancy reaching a high of 65.1%, and ADRs peaking at $556.
- Conversely, the slowest single month of the year, typically falling within the low season, marks the market's lowest point. In this month, revenue might dip to $2,107, occupancy could drop to 22.9%, and ADRs may adjust down to $317.
- Understanding both the seasonal averages and these monthly peaks and troughs in revenue, occupancy, and ADR is crucial for maximizing your Airbnb profit potential in Frisco.
Seasonal Strategies for Maximizing Profit
- Peak Season: Maximize revenue through premium pricing and potentially longer minimum stays. Ensure high availability.
- Low Season: Offer competitive pricing, special promotions (e.g., extended stay discounts), and flexible cancellation policies. Target off-season travelers like remote workers or budget-conscious guests.
- Shoulder Seasons: Implement dynamic pricing that balances peak and low rates. Target weekend travelers or specific events. Offer slightly more flexible terms than peak season.
- Regularly analyze your own performance against these Frisco seasonality benchmarks and adjust your pricing and availability strategy accordingly.
Best Areas for Airbnb Investment in Frisco (2026)
Exploring the top neighborhoods for short-term rentals in Frisco? This section highlights key areas, outlining why they are attractive for hosts and guests, along with notable local attractions. Consider these locations based on your target guest profile and investment strategy.
| Neighborhood / Area | Why Host Here? (Target Guests & Appeal) | Key Attractions & Landmarks |
|---|---|---|
| Main Street | The heart of Frisco, offering charming shops, restaurants, and easy access to local festivals and events. This area attracts tourists looking for a small-town vibe with convenient amenities. | Frisco Historic Park and Museum, Frisco's Marina Park, local shops and boutiques, restaurants and cafés, Frisco Bay, Dillon Reservoir |
| Lake Dillon | Stunning views of the lake and surrounding mountains, making it a popular spot for outdoor enthusiasts year-round. This area is perfect for those wanting quick access to water activities and hiking trails. | Dillon Marina, Lake Dillon Theatre Company, Dillon Amphitheater, bike paths around the lake, fishing and boating opportunities |
| Copper Mountain | A well-known ski resort that attracts winter sports enthusiasts. It provides year-round attractions such as hiking and mountain biking, making it a great investment for seasonal Airbnb rentals. | Copper Mountain Ski Resort, Woodward Copper Training Facility, The Spa at Copper, Summer activities at the mountain, Restaurants and nightlife at the village |
| Frisco Nordic Center | Ideal for those seeking a winter sports experience, offering cross-country skiing and snowshoeing. This area caters to ski lovers and outdoor adventurers, making it attractive for short-term rentals. | Frisco Nordic Center trails, cross-country skiing, snowshoeing, seasonal race events, mountain views |
| Peak 1 | Away from the hustle of downtown, offering a tranquil environment near natural beauty. Attracts families and travelers seeking peace and quiet while still being close to Frisco's amenities. | Frisco Adventure Park, camping and hiking trails, biking trails, Wildflower Peak, Scenic views of the mountains |
| Silverthorne | Just a short drive from Frisco and popular for shopping and access to multiple ski resorts. It offers a balance of urban conveniences with outdoor access, making it a great location for Airbnb. | Outlets at Silverthorne, Anglers Camp, Rainbow Park, Blue River, Ski resorts nearby |
| Buffalo Mountain | Known for its hiking trails and scenic views, this area attracts avid hikers and nature lovers. It’s ideal for rentals looking to target outdoor enthusiasts during the summer months. | Buffalo Mountain trailhead, hiking trails, wildflower viewing, scenic overlooks, wildlife viewing opportunities |
| Sapphire Point | Offers breathtaking panoramic views of Lake Dillon and the Tenmile Range. It's a few miles from Frisco, making it perfect for those who want stunning nature while being close to town. | Sapphire Point Overlook, hiking and walking trails, picnic areas, photography opportunities |
Understanding Airbnb License Requirements & STR Laws in Frisco (2026)
With 23% of listings showing registration in 2026, understanding potential Airbnb license requirements is crucial in Frisco. Always verify the latest short term rental regulations and Airbnb license requirements directly with local government authorities for Frisco to ensure full compliance before hosting.
(Source: AirROI data, 2026, based on 23% licensed listings)
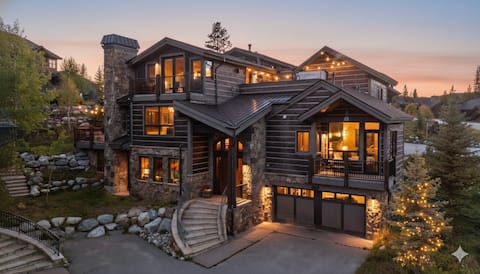
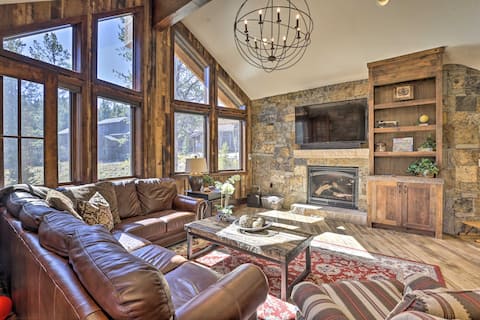
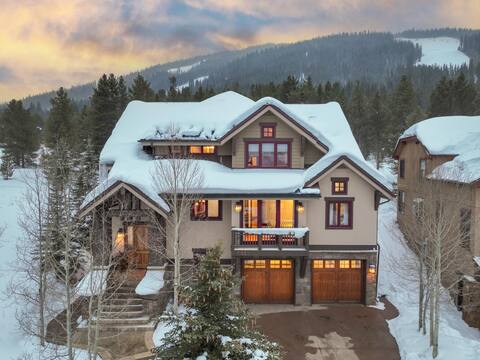
Top Performing Airbnb Properties in Frisco (2026)
Benchmark your potential! Explore examples of top-performing Airbnb properties in Friscobased on Trailing Twelve Month (TTM) revenue. Analyze their characteristics, revenue, occupancy rate, and ADR to understand what drives success in this market.
Ski In/Out•Roof Top Spa•$0 Cleaning & Pet Fee
Entire Place • 4 bedrooms
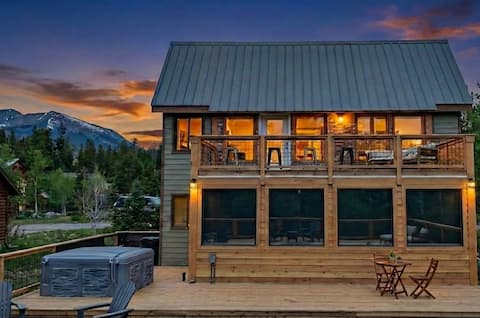
Roof Top Deck•Sunroom•Hot Tub•Yard•$0 Cleaning Fee
Entire Place • 3 bedrooms
Walk to Lift: Luxe Villa w/ Hot Tub in Copper Mtn
Entire Place • 7 bedrooms

Mountain View Chalet • Walk to Main • $0 Cleaning
Entire Place • 4 bedrooms
Bee Line Escape: Ski-in/out, Golf, Private Hot Tub
Entire Place • 6 bedrooms

Luxurious Frisco Home!
Entire Place • 6 bedrooms
Note: Performance varies based on location, size, amenities, seasonality, and management quality. Data reflects the past 12 months.
Top Performing Airbnb Hosts in Frisco (2026)
Learn from the best! This table showcases top-performing Airbnb hosts in Frisco based on the number of properties managed and estimated total revenue over the past year. Analyze their scale and performance metrics.
| Host Name | Properties | Grossing Revenue | Stay Reviews | Avg Rating |
|---|---|---|---|---|
| Paul | 70 | $2,565,102 | 515 | 4.75/5.0 |
| Summit Mountain Rentals | 52 | $2,275,811 | 480 | 4.72/5.0 |
| Evolve | 30 | $1,993,468 | 1911 | 4.81/5.0 |
| Bighorn | 51 | $1,905,859 | 1070 | 4.76/5.0 |
| Evolve | 34 | $1,464,011 | 905 | 4.84/5.0 |
| Tina | 5 | $1,332,208 | 1257 | 4.96/5.0 |
| Richard | 32 | $1,066,695 | 206 | 4.71/5.0 |
| Great Western Lodging | 17 | $786,472 | 250 | 4.69/5.0 |
| Summit County Mountain Retreat | 20 | $739,889 | 131 | 4.70/5.0 |
| VisitBreck | 10 | $727,336 | 99 | 4.78/5.0 |
Analyzing the strategies of top hosts, such as their property selection, pricing, and guest communication, can offer valuable lessons for optimizing your own Airbnb operations in Frisco.
Dive Deeper: Advanced Frisco STR Market Data (2026)
Ready to unlock more insights? AirROI provides access to advanced metrics and comprehensive Airbnb data for Frisco. Explore detailed analytics beyond this report to refine your investment strategy, optimize pricing, and maximize your vacation rental profits.
Explore Advanced MetricsFrisco Short-Term Rental Market Composition (2026): Property & Room Types
Room Type Distribution
Property Type Distribution
Market Composition Insights for Frisco
- The Frisco Airbnb market composition is heavily skewed towards Entire Home/Apt listings, which make up 98.4% of the 853 active rentals. This indicates strong guest preference for privacy and space.
- Looking at the property type distribution in Frisco, Apartment/Condo properties are the most common (66.1%), reflecting the local real estate landscape.
- Houses represent a significant 32.1% portion, catering likely to families or larger groups.
- Smaller segments like others, outdoor/unique, hotel/boutique (combined 1.7%) offer potential for unique stay experiences.
Frisco Airbnb Room Capacity Analysis (2026): Bedroom Distribution
Distribution of Listings by Number of Bedrooms
Room Capacity Insights for Frisco
- The dominant room capacity in Frisco is 2 bedrooms listings, making up 41.5% of the market. This suggests a strong demand for properties suitable for couples or solo travelers.
- Together, 2 bedrooms and 3 bedrooms properties represent 63.9% of the active Airbnb listings in Frisco, indicating a high concentration in these sizes.
- A significant 32.7% of listings offer 3+ bedrooms, catering to larger groups and families seeking more space in Frisco.
Frisco Vacation Rental Guest Capacity Trends (2026)
Distribution of Listings by Guest Capacity
Guest Capacity Insights for Frisco
- The most common guest capacity trend in Frisco vacation rentals is listings accommodating 8+ guests (39.9%). This suggests the primary traveler segment is likely larger groups.
- Properties designed for 8+ guests and 6 guests dominate the Frisco STR market, accounting for 69.0% of listings.
- 73.1% of properties accommodate 6+ guests, serving the market segment for larger families or group travel in Frisco.
- On average, properties in Frisco are equipped to host 6.2 guests.
Frisco Airbnb Booking Patterns (2026): Available vs. Booked Days
Available Days Distribution
Booked Days Distribution
Booking Pattern Insights for Frisco
- The most common availability pattern in Frisco falls within the 271-366 days range, representing 53.6% of listings. This suggests many properties have significant open periods on their calendars.
- Approximately 88.7% of listings show high availability (181+ days open annually), indicating potential for increased bookings or specific owner usage patterns.
- For booked days, the 91-180 days range is most frequent in Frisco (38.1%), reflecting common guest stay durations or potential owner blocking patterns.
- A notable 12.4% of properties secure long booking periods (181+ days booked per year), highlighting successful long-term rental strategies or significant owner usage.
Frisco Airbnb Minimum Stay Requirements Analysis
Distribution of Listings by Minimum Night Requirement
1 Night
89 listings
10.4% of total
2 Nights
222 listings
26% of total
3 Nights
74 listings
8.7% of total
4-6 Nights
30 listings
3.5% of total
7-29 Nights
8 listings
0.9% of total
30+ Nights
430 listings
50.4% of total
Key Insights
- The most prevalent minimum stay requirement in Frisco is 30+ Nights, adopted by 50.4% of listings. This highlights the market's preference for longer commitments.
- A significant segment (50.4%) caters to monthly stays (30+ nights) in Frisco, pointing to opportunities in the extended-stay market.
Recommendations
- Align with the market by considering a 30+ Nights minimum stay, as 50.4% of Frisco hosts use this setting.
- If feasible, allowing 1-night stays, especially midweek or during low season, could capture last-minute bookings, as only 10.4% currently do.
- Explore offering discounts for stays of 30+ nights to attract the 50.4% of the market seeking extended stays.
- Adjust minimum nights based on seasonality – potentially shorter during low season and longer during peak demand periods in Frisco.
Frisco Airbnb Cancellation Policy Trends Analysis (2026)
Limited
33 listings
3.9% of total
Super Strict 30 Days
72 listings
8.5% of total
Super Strict 60 Days
24 listings
2.8% of total
Flexible
18 listings
2.1% of total
Moderate
104 listings
12.2% of total
Firm
360 listings
42.3% of total
Strict
241 listings
28.3% of total
Cancellation Policy Insights for Frisco
- The prevailing Airbnb cancellation policy trend in Frisco is Firm, used by 42.3% of listings.
- A majority (70.6%) of hosts in Frisco utilize Firm or Strict policies, indicating a market where hosts prioritize booking security.
Recommendations for Hosts
- Consider adopting a Firm policy to align with the 42.3% market standard in Frisco.
- Regularly review your cancellation policy against competitors and market demand shifts in Frisco.
Frisco STR Booking Lead Time Analysis (2026)
Average Booking Lead Time by Month
Booking Lead Time Insights for Frisco
- The overall average booking lead time for vacation rentals in Frisco is 69 days.
- Guests book furthest in advance for stays during January (average 90 days), likely coinciding with peak travel demand or local events.
- The shortest booking windows occur for stays in May (average 39 days), indicating more last-minute travel plans during this time.
- Seasonally, Winter (85 days avg.) sees the longest lead times, while Fall (54 days avg.) has the shortest, reflecting typical travel planning cycles.
Recommendations for Hosts
- Use the overall average lead time (69 days) as a baseline for your pricing and availability strategy in Frisco.
- For January stays, consider implementing length-of-stay discounts or slightly higher rates for bookings made less than 90 days out to capitalize on advance planning.
- Target marketing efforts for the Winter season well in advance (at least 85 days) to capture early planners.
- Monitor your own booking lead times against these Frisco averages to identify opportunities for dynamic pricing adjustments.
Popular & Essential Airbnb Amenities in Frisco (2026)
Amenity Prevalence
Amenity Insights for Frisco
- Essential amenities in Frisco that guests expect include: Smoke alarm, Wifi, Heating, TV, Carbon monoxide alarm. Lacking these (any) could significantly impact bookings.
- Popular amenities like Coffee maker, Kitchen, Free parking on premises are common but not universal. Offering these can provide a competitive edge.
Recommendations for Hosts
- Ensure your listing includes all essential amenities for Frisco: Smoke alarm, Wifi, Heating, TV, Carbon monoxide alarm.
- Prioritize adding missing essentials: Smoke alarm, Wifi, Heating, TV, Carbon monoxide alarm.
- Consider adding popular differentiators like Coffee maker or Kitchen to increase appeal.
- Highlight unique or less common amenities you offer (e.g., hot tub, dedicated workspace, EV charger) in your listing description and photos.
- Regularly check competitor amenities in Frisco to stay competitive.
Frisco Airbnb Guest Demographics & Profile Analysis (2026)
Guest Profile Summary for Frisco
- The typical guest profile for Airbnb in Frisco consists of primarily domestic travelers (97%), often arriving from nearby Denver, typically belonging to the Post-2000s (Gen Z/Alpha) group (50%), primarily speaking English or Spanish.
- Domestic travelers account for 96.8% of guests.
- Key international markets include United States (96.8%) and DC (0.7%).
- Top languages spoken are English (71.8%) followed by Spanish (13.3%).
- A significant demographic segment is the Post-2000s (Gen Z/Alpha) group, representing 50% of guests.
Recommendations for Hosts
- Target domestic marketing efforts towards travelers from Denver and Boulder.
- Tailor amenities and listing descriptions to appeal to the dominant Post-2000s (Gen Z/Alpha) demographic (e.g., highlight fast WiFi, smart home features, local guides).
- Highlight unique local experiences or amenities relevant to the primary guest profile.
- Consider seasonal promotions aligned with peak travel times for key origin markets.
Nearby Short-Term Rental Market Comparison
How does the Frisco Airbnb market stack up against its neighbors? Compare key performance metrics like average monthly revenue, ADR, and occupancy rates in surrounding areas to understand the broader regional STR landscape.
| Market | Active Properties | Monthly Revenue | Daily Rate | Avg. Occupancy |
|---|---|---|---|---|
| Blue River | 201 | $7,203 | $609.20 | 45% |
| Aspen | 610 | $7,095 | $992.28 | 36% |
| Snowmass | 21 | $6,247 | $701.59 | 40% |
| El Jebel | 33 | $6,236 | $506.29 | 48% |
| Aspen Park | 11 | $5,825 | $395.00 | 54% |
| Indian Hills | 11 | $5,799 | $333.03 | 54% |
| Grand County | 14 | $5,137 | $513.48 | 42% |
| Glenwood Springs | 242 | $5,039 | $356.03 | 49% |
| Breckenridge | 3,051 | $4,995 | $544.32 | 40% |
| Crested Butte | 267 | $4,956 | $536.90 | 42% |