Fort Morgan Airbnb Market Analysis 2025: Short Term Rental Data & Vacation Rental Statistics in Colorado, United States
Is Airbnb profitable in Fort Morgan in 2025? Explore comprehensive Airbnb analytics for Fort Morgan, Colorado, United States to uncover income potential. This 2025 STR market report for Fort Morgan, based on AirROI data from August 2024 to July 2025, reveals key trends in the niche market of 19 active listings.
Whether you're considering an Airbnb investment in Fort Morgan, optimizing your existing vacation rental, or exploring rental arbitrage opportunities, understanding the Fort Morgan Airbnb data is crucial. Leveraging the low regulation environment is key to maximizing your short term rental income potential. Let's dive into the specifics.
Key Fort Morgan Airbnb Performance Metrics Overview
Monthly Airbnb Revenue Variations & Income Potential in Fort Morgan (2025)
Understanding the monthly revenue variations for Airbnb listings in Fort Morgan is key to maximizing your short term rental income potential. Seasonality significantly impacts earnings. Our analysis, based on data from the past 12 months, shows that the peak revenue month for STRs in Fort Morgan is typically March, while June often presents the lowest earnings, highlighting opportunities for strategic pricing adjustments during shoulder and low seasons. Explore the typical Airbnb income in Fort Morgan across different performance tiers:
- Best-in-class properties (Top 10%) achieve $4,629+ monthly, often utilizing dynamic pricing and superior guest experiences.
- Strong performing properties (Top 25%) earn $3,429 or more, indicating effective management and desirable locations/amenities.
- Typical properties (Median) generate around $1,454 per month, representing the average market performance.
- Entry-level properties (Bottom 25%) see earnings around $790, often with potential for optimization.
Average Monthly Airbnb Earnings Trend in Fort Morgan
Fort Morgan Airbnb Occupancy Rate Trends (2025)
Maximize your bookings by understanding the Fort Morgan STR occupancy trends. Seasonal demand shifts significantly influence how often properties are booked. Typically, Septembersees the highest demand (peak season occupancy), while June experiences the lowest (low season). Effective strategies, like adjusting minimum stays or offering promotions, can boost occupancy during slower periods. Here's how different property tiers perform in Fort Morgan:
- Best-in-class properties (Top 10%) achieve 82%+ occupancy, indicating high desirability and potentially optimized availability.
- Strong performing properties (Top 25%) maintain 62% or higher occupancy, suggesting good market fit and guest satisfaction.
- Typical properties (Median) have an occupancy rate around 41%.
- Entry-level properties (Bottom 25%) average 27% occupancy, potentially facing higher vacancy.
Average Monthly Occupancy Rate Trend in Fort Morgan
Average Daily Rate (ADR) Airbnb Trends in Fort Morgan (2025)
Effective short term rental pricing strategy in Fort Morgan involves understanding monthly ADR fluctuations. The Average Daily Rate (ADR) for Airbnb in Fort Morgan typically peaks in July and dips lowest during February. Leveraging Airbnb dynamic pricing tools or strategies based on this seasonality can significantly boost revenue. Here's a look at the typical nightly rates achieved:
- Best-in-class properties (Top 10%) command rates of $210+ per night, often due to premium features or locations.
- Strong performing properties (Top 25%) achieve nightly rates of $159 or more.
- Typical properties (Median) charge around $110 per night.
- Entry-level properties (Bottom 25%) earn around $73 per night.
Average Daily Rate (ADR) Trend by Month in Fort Morgan
Get Live Fort Morgan Market Intelligence 👇

Explore Real-time Analytics
Airbnb Seasonality Analysis & Trends in Fort Morgan (2025)
Peak Season (March, September, October)
- Revenue averages $2,666 per month
- Occupancy rates average 52.5%
- Daily rates average $122
Shoulder Season
- Revenue averages $2,155 per month
- Occupancy maintains around 48.2%
- Daily rates hold near $121
Low Season (January, June, July)
- Revenue drops to average $1,614 per month
- Occupancy decreases to average 31.8%
- Daily rates adjust to average $131
Seasonality Insights for Fort Morgan
- The Airbnb seasonality in Fort Morgan shows moderate seasonality with distinct peak and low periods. While the sections above show seasonal averages, it's also insightful to look at the extremes:
- During the high season, the absolute peak month showcases Fort Morgan's highest earning potential, with monthly revenues capable of climbing to $2,793, occupancy reaching a high of 64.3%, and ADRs peaking at $139.
- Conversely, the slowest single month of the year, typically falling within the low season, marks the market's lowest point. In this month, revenue might dip to $1,443, occupancy could drop to 25.4%, and ADRs may adjust down to $107.
- Understanding both the seasonal averages and these monthly peaks and troughs in revenue, occupancy, and ADR is crucial for maximizing your Airbnb profit potential in Fort Morgan.
Seasonal Strategies for Maximizing Profit
- Peak Season: Maximize revenue through premium pricing and potentially longer minimum stays. Ensure high availability.
- Low Season: Offer competitive pricing, special promotions (e.g., extended stay discounts), and flexible cancellation policies. Target off-season travelers like remote workers or budget-conscious guests.
- Shoulder Seasons: Implement dynamic pricing that balances peak and low rates. Target weekend travelers or specific events. Offer slightly more flexible terms than peak season.
- Regularly analyze your own performance against these Fort Morgan seasonality benchmarks and adjust your pricing and availability strategy accordingly.
Best Areas for Airbnb Investment in Fort Morgan (2025)
Exploring the top neighborhoods for short-term rentals in Fort Morgan? This section highlights key areas, outlining why they are attractive for hosts and guests, along with notable local attractions. Consider these locations based on your target guest profile and investment strategy.
| Neighborhood / Area | Why Host Here? (Target Guests & Appeal) | Key Attractions & Landmarks |
|---|---|---|
| Downtown Fort Morgan | The heart of Fort Morgan, offering local shops, dining, and access to various community events. Great for guests wanting to experience local culture. | Fort Morgan Museum, Burlington Northern Santa Fe Railroad Depot, Morgan County Fairgrounds, City Park |
| Pioneer Park | A family-friendly area with a large park and recreational facilities. Ideal for visitors looking for outdoor activities and sports. | Pioneer Park, Fort Morgan Golf Course, Biking and walking trails, Playground areas |
| Fort Morgan Reservoir | A natural attraction just outside the city, offering fishing, boating, and a serene landscape. Great for nature lovers and outdoor enthusiasts. | Fort Morgan Reservoir, Fishing areas, Parks, Nature trails |
| South Fort Morgan | A quieter residential area, perfect for longer stays and those who want a peaceful environment while still close to town. | Local Parks, Access to main roads, Residential neighborhoods |
| East Fort Morgan | Features newer developments and easy access to Highway 34. Appeals to guests needing quick transit options and modern accommodations. | Shopping areas, Restaurants, Easy access to highways |
| Fort Morgan Historic District | Rich in history, showcasing charming architecture and offering guests a taste of local heritage. Perfect for history enthusiasts. | Historic homes, Museums, Cultural landmarks, Local art |
| Old Town Fort Morgan | Characterized by its quaint streets and local flavor, it is ideal for visitors looking for a unique and quaint atmosphere. | Local diners, Vintage shops, Community events |
| Wisconsin Ave Area | A growing area with new businesses and restaurants popping up. Suitable for tourists looking for the next hotspot in town. | New eateries, Local vendors, Shopping opportunities |
Understanding Airbnb License Requirements & STR Laws in Fort Morgan (2025)
While Fort Morgan, Colorado, United States currently shows low STR regulations, specific Airbnb license requirements might still exist or change. Always verify the latest short term rental regulations and Airbnb license requirements directly with local government authorities for Fort Morgan to ensure full compliance before hosting.
(Source: AirROI data, 2025, finding no licensed listings among those analyzed)
Top Performing Airbnb Properties in Fort Morgan (2025)
Benchmark your potential! Explore examples of top-performing Airbnb properties in Fort Morganbased on Trailing Twelve Month (TTM) revenue. Analyze their characteristics, revenue, occupancy rate, and ADR to understand what drives success in this market.
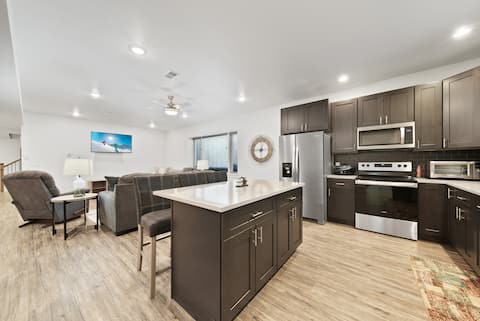
Brand new, 3 Bedroom Suite in Fort Morgan!
Entire Place • 3 bedrooms
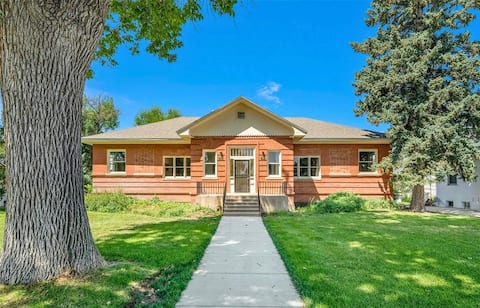
The Grant School est. 1907
Entire Place • 3 bedrooms

Perfect for work or family travel-4BR/2BA House
Entire Place • 3 bedrooms
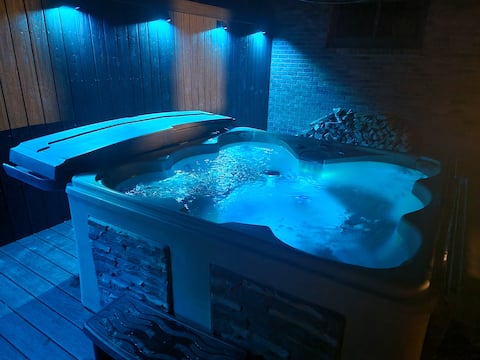
Home close to town with Hottub and pets allowed
Entire Place • 3 bedrooms

Garden Level Deluxe 2bd/1ba Apt, Mthly Rate Avail
Entire Place • 2 bedrooms

Cozy Basement Suite (Non-Smoking Property)
Entire Place • 1 bedroom
Note: Performance varies based on location, size, amenities, seasonality, and management quality. Data reflects the past 12 months.
Top Performing Airbnb Hosts in Fort Morgan (2025)
Learn from the best! This table showcases top-performing Airbnb hosts in Fort Morgan based on the number of properties managed and estimated total revenue over the past year. Analyze their scale and performance metrics.
| Host Name | Properties | Grossing Revenue | Stay Reviews | Avg Rating |
|---|---|---|---|---|
| Isaac | 8 | $61,240 | 193 | 4.91/5.0 |
| Brice | 2 | $53,197 | 89 | 4.72/5.0 |
| Alvina | 1 | $50,523 | 34 | 5.00/5.0 |
| Farrah | 1 | $36,263 | 155 | 4.79/5.0 |
| Shawna | 1 | $24,443 | 111 | 4.91/5.0 |
| Bruce And Marla | 1 | $14,488 | 112 | 4.94/5.0 |
| Lily | 1 | $9,658 | 79 | 4.59/5.0 |
| Alexandra | 3 | $8,691 | 22 | 4.88/5.0 |
| May | 1 | $5,115 | 5 | 5.00/5.0 |
Analyzing the strategies of top hosts, such as their property selection, pricing, and guest communication, can offer valuable lessons for optimizing your own Airbnb operations in Fort Morgan.
Dive Deeper: Advanced Fort Morgan STR Market Data (2025)
Ready to unlock more insights? AirROI provides access to advanced metrics and comprehensive Airbnb data for Fort Morgan. Explore detailed analytics beyond this report to refine your investment strategy, optimize pricing, and maximize your vacation rental profits.
Explore Advanced MetricsFort Morgan Short-Term Rental Market Composition (2025): Property & Room Types
Room Type Distribution
Property Type Distribution
Market Composition Insights for Fort Morgan
- The Fort Morgan Airbnb market composition is heavily skewed towards Entire Home/Apt listings, which make up 78.9% of the 19 active rentals. This indicates strong guest preference for privacy and space.
- Looking at the property type distribution in Fort Morgan, House properties are the most common (63.2%), reflecting the local real estate landscape.
- Houses represent a significant 63.2% portion, catering likely to families or larger groups.
Fort Morgan Airbnb Room Capacity Analysis (2025): Bedroom Distribution
Distribution of Listings by Number of Bedrooms
Room Capacity Insights for Fort Morgan
- The dominant room capacity in Fort Morgan is 3 bedrooms listings, making up 36.8% of the market. This suggests a strong demand for properties suitable for families or small groups.
- Together, 3 bedrooms and 2 bedrooms properties represent 73.6% of the active Airbnb listings in Fort Morgan, indicating a high concentration in these sizes.
- A significant 42.1% of listings offer 3+ bedrooms, catering to larger groups and families seeking more space in Fort Morgan.
Fort Morgan Vacation Rental Guest Capacity Trends (2025)
Distribution of Listings by Guest Capacity
Guest Capacity Insights for Fort Morgan
- The most common guest capacity trend in Fort Morgan vacation rentals is listings accommodating 4 guests (26.3%). This suggests the primary traveler segment is likely small families or groups.
- Properties designed for 4 guests and 6 guests dominate the Fort Morgan STR market, accounting for 52.6% of listings.
- 36.8% of properties accommodate 6+ guests, serving the market segment for larger families or group travel in Fort Morgan.
- On average, properties in Fort Morgan are equipped to host 4.1 guests.
Fort Morgan Airbnb Booking Patterns (2025): Available vs. Booked Days
Available Days Distribution
Booked Days Distribution
Booking Pattern Insights for Fort Morgan
- The most common availability pattern in Fort Morgan falls within the 271-366 days range, representing 57.9% of listings. This suggests many properties have significant open periods on their calendars.
- Approximately 79.0% of listings show high availability (181+ days open annually), indicating potential for increased bookings or specific owner usage patterns.
- For booked days, the 1-30 days range is most frequent in Fort Morgan (31.6%), reflecting common guest stay durations or potential owner blocking patterns.
- A notable 21.1% of properties secure long booking periods (181+ days booked per year), highlighting successful long-term rental strategies or significant owner usage.
Fort Morgan Airbnb Minimum Stay Requirements Analysis
Distribution of Listings by Minimum Night Requirement
1 Night
9 listings
47.4% of total
7-29 Nights
8 listings
42.1% of total
30+ Nights
2 listings
10.5% of total
Key Insights
- The most prevalent minimum stay requirement in Fort Morgan is 1 Night, adopted by 47.4% of listings. This highlights the market's preference for shorter, flexible bookings.
- A significant segment (10.5%) caters to monthly stays (30+ nights) in Fort Morgan, pointing to opportunities in the extended-stay market.
Recommendations
- Align with the market by considering a 1 Night minimum stay, as 47.4% of Fort Morgan hosts use this setting.
- Explore offering discounts for stays of 30+ nights to attract the 10.5% of the market seeking extended stays.
- Adjust minimum nights based on seasonality – potentially shorter during low season and longer during peak demand periods in Fort Morgan.
Fort Morgan Airbnb Cancellation Policy Trends Analysis (2025)
Flexible
7 listings
38.9% of total
Moderate
2 listings
11.1% of total
Firm
8 listings
44.4% of total
Strict
1 listings
5.6% of total
Cancellation Policy Insights for Fort Morgan
- The prevailing Airbnb cancellation policy trend in Fort Morgan is Firm, used by 44.4% of listings.
- There's a relatively balanced mix between guest-friendly (50.0%) and stricter (50.0%) policies, offering choices for different guest needs.
- Strict cancellation policies are quite rare (5.6%), potentially making listings with this policy less competitive unless justified by high demand or property type.
Recommendations for Hosts
- Consider adopting a Firm policy to align with the 44.4% market standard in Fort Morgan.
- Using a Strict policy might deter some guests, as only 5.6% of listings use it. Evaluate if potential revenue protection outweighs possible lower booking rates.
- Regularly review your cancellation policy against competitors and market demand shifts in Fort Morgan.
Fort Morgan STR Booking Lead Time Analysis (2025)
Average Booking Lead Time by Month
Booking Lead Time Insights for Fort Morgan
- The overall average booking lead time for vacation rentals in Fort Morgan is 23 days.
- Guests book furthest in advance for stays during June (average 56 days), likely coinciding with peak travel demand or local events.
- The shortest booking windows occur for stays in February (average 3 days), indicating more last-minute travel plans during this time.
- Seasonally, Summer (39 days avg.) sees the longest lead times, while Winter (13 days avg.) has the shortest, reflecting typical travel planning cycles.
Recommendations for Hosts
- Use the overall average lead time (23 days) as a baseline for your pricing and availability strategy in Fort Morgan.
- For June stays, consider implementing length-of-stay discounts or slightly higher rates for bookings made less than 56 days out to capitalize on advance planning.
- During February, focus on last-minute booking availability and promotions, as guests book with very short notice (3 days avg.).
- Target marketing efforts for the Summer season well in advance (at least 39 days) to capture early planners.
- Monitor your own booking lead times against these Fort Morgan averages to identify opportunities for dynamic pricing adjustments.
Popular & Essential Airbnb Amenities in Fort Morgan (2025)
Amenity Prevalence
Amenity Insights for Fort Morgan
- Essential amenities in Fort Morgan that guests expect include: Dishes and silverware, Free parking on premises, Wifi, TV, Smoke alarm, Essentials, Refrigerator, Air conditioning, Heating. Lacking these (any) could significantly impact bookings.
- Popular amenities like Clothing storage are common but not universal. Offering these can provide a competitive edge.
Recommendations for Hosts
- Ensure your listing includes all essential amenities for Fort Morgan: Dishes and silverware, Free parking on premises, Wifi, TV, Smoke alarm, Essentials, Refrigerator, Air conditioning, Heating.
- Consider adding popular differentiators like Clothing storage to increase appeal.
- Highlight unique or less common amenities you offer (e.g., hot tub, dedicated workspace, EV charger) in your listing description and photos.
- Regularly check competitor amenities in Fort Morgan to stay competitive.
Fort Morgan Airbnb Guest Demographics & Profile Analysis (2025)
Guest Profile Summary for Fort Morgan
- The typical guest profile for Airbnb in Fort Morgan consists of primarily domestic travelers (94%), often arriving from nearby Fort Morgan, typically belonging to the Post-2000s (Gen Z/Alpha) group (50%), primarily speaking English or Spanish.
- Domestic travelers account for 94.1% of guests.
- Key international markets include United States (94.1%) and Canada (2.5%).
- Top languages spoken are English (73%) followed by Spanish (18%).
- A significant demographic segment is the Post-2000s (Gen Z/Alpha) group, representing 50% of guests.
Recommendations for Hosts
- Target domestic marketing efforts towards travelers from Fort Morgan and Colorado Springs.
- Tailor amenities and listing descriptions to appeal to the dominant Post-2000s (Gen Z/Alpha) demographic (e.g., highlight fast WiFi, smart home features, local guides).
- Highlight unique local experiences or amenities relevant to the primary guest profile.
- Consider seasonal promotions aligned with peak travel times for key origin markets.
Nearby Short-Term Rental Market Comparison
How does the Fort Morgan Airbnb market stack up against its neighbors? Compare key performance metrics like average monthly revenue, ADR, and occupancy rates in surrounding areas to understand the broader regional STR landscape.
| Market | Active Properties | Monthly Revenue | Daily Rate | Avg. Occupancy |
|---|---|---|---|---|
| Woodmoor | 48 | $3,905 | $332.33 | 45% |
| Palmer Lake | 48 | $3,464 | $290.30 | 48% |
| Monument | 91 | $3,405 | $326.33 | 44% |
| Holly Hills | 39 | $3,135 | $244.15 | 51% |
| Gleneagle | 31 | $2,994 | $329.72 | 42% |
| Centennial | 196 | $2,974 | $203.62 | 53% |
| Larkspur | 34 | $2,633 | $235.82 | 42% |
| Windsor | 72 | $2,579 | $199.92 | 53% |
| Northglenn | 82 | $2,551 | $198.79 | 49% |
| Western Hills | 164 | $2,446 | $192.89 | 49% |