Evergreen Airbnb Market Analysis 2026: Short Term Rental Data & Vacation Rental Statistics in Colorado, United States
Is Airbnb profitable in Evergreen in 2026? Explore comprehensive Airbnb analytics for Evergreen, Colorado, United States to uncover income potential. This 2026 STR market report for Evergreen, based on AirROI data from February 2025 to January 2026, reveals key trends in the niche market of 190 active listings.
Whether you're considering an Airbnb investment in Evergreen, optimizing your existing vacation rental, or exploring rental arbitrage opportunities, understanding the Evergreen Airbnb data is crucial. Understanding the local regulations is key to maximizing your short term rental income potential. Let's dive into the specifics.
Key Evergreen Airbnb Performance Metrics Overview
Monthly Airbnb Revenue Variations & Income Potential in Evergreen (2026)
Understanding the monthly revenue variations for Airbnb listings in Evergreen is key to maximizing your short term rental income potential. Seasonality significantly impacts earnings. Our analysis, based on data from the past 12 months, shows that the peak revenue month for STRs in Evergreen is typically July, while February often presents the lowest earnings, highlighting opportunities for strategic pricing adjustments during shoulder and low seasons. Explore the typical Airbnb income in Evergreen across different performance tiers:
- Best-in-class properties (Top 10%) achieve $11,549+ monthly, often utilizing dynamic pricing and superior guest experiences.
- Strong performing properties (Top 25%) earn $7,573 or more, indicating effective management and desirable locations/amenities.
- Typical properties (Median) generate around $4,387 per month, representing the average market performance.
- Entry-level properties (Bottom 25%) see earnings around $2,271, often with potential for optimization.
Average Monthly Airbnb Earnings Trend in Evergreen
Evergreen Airbnb Occupancy Rate Trends (2026)
Maximize your bookings by understanding the Evergreen STR occupancy trends. Seasonal demand shifts significantly influence how often properties are booked. Typically, Julysees the highest demand (peak season occupancy), while January experiences the lowest (low season). Effective strategies, like adjusting minimum stays or offering promotions, can boost occupancy during slower periods. Here's how different property tiers perform in Evergreen:
- Best-in-class properties (Top 10%) achieve 84%+ occupancy, indicating high desirability and potentially optimized availability.
- Strong performing properties (Top 25%) maintain 71% or higher occupancy, suggesting good market fit and guest satisfaction.
- Typical properties (Median) have an occupancy rate around 51%.
- Entry-level properties (Bottom 25%) average 29% occupancy, potentially facing higher vacancy.
Average Monthly Occupancy Rate Trend in Evergreen
Average Daily Rate (ADR) Airbnb Trends in Evergreen (2026)
Effective short term rental pricing strategy in Evergreen involves understanding monthly ADR fluctuations. The Average Daily Rate (ADR) for Airbnb in Evergreen typically peaks in July and dips lowest during April. Leveraging Airbnb dynamic pricing tools or strategies based on this seasonality can significantly boost revenue. Here's a look at the typical nightly rates achieved:
- Best-in-class properties (Top 10%) command rates of $621+ per night, often due to premium features or locations.
- Strong performing properties (Top 25%) achieve nightly rates of $429 or more.
- Typical properties (Median) charge around $275 per night.
- Entry-level properties (Bottom 25%) earn around $163 per night.
Average Daily Rate (ADR) Trend by Month in Evergreen
Get Live Evergreen Market Intelligence 👇

Explore Real-time Analytics
Airbnb Seasonality Analysis & Trends in Evergreen (2026)
Peak Season (July, August, June)
- Revenue averages $7,668 per month
- Occupancy rates average 62.6%
- Daily rates average $343
Shoulder Season
- Revenue averages $5,443 per month
- Occupancy maintains around 48.8%
- Daily rates hold near $325
Low Season (January, February, April)
- Revenue drops to average $3,714 per month
- Occupancy decreases to average 38.9%
- Daily rates adjust to average $301
Seasonality Insights for Evergreen
- The Airbnb seasonality in Evergreen shows highly seasonal trends requiring careful strategy. While the sections above show seasonal averages, it's also insightful to look at the extremes:
- During the high season, the absolute peak month showcases Evergreen's highest earning potential, with monthly revenues capable of climbing to $8,531, occupancy reaching a high of 68.8%, and ADRs peaking at $349.
- Conversely, the slowest single month of the year, typically falling within the low season, marks the market's lowest point. In this month, revenue might dip to $3,571, occupancy could drop to 34.1%, and ADRs may adjust down to $295.
- Understanding both the seasonal averages and these monthly peaks and troughs in revenue, occupancy, and ADR is crucial for maximizing your Airbnb profit potential in Evergreen.
Seasonal Strategies for Maximizing Profit
- Peak Season: Maximize revenue through premium pricing and potentially longer minimum stays. Ensure high availability.
- Low Season: Offer competitive pricing, special promotions (e.g., extended stay discounts), and flexible cancellation policies. Target off-season travelers like remote workers or budget-conscious guests.
- Shoulder Seasons: Implement dynamic pricing that balances peak and low rates. Target weekend travelers or specific events. Offer slightly more flexible terms than peak season.
- Regularly analyze your own performance against these Evergreen seasonality benchmarks and adjust your pricing and availability strategy accordingly.
Best Areas for Airbnb Investment in Evergreen (2026)
Exploring the top neighborhoods for short-term rentals in Evergreen? This section highlights key areas, outlining why they are attractive for hosts and guests, along with notable local attractions. Consider these locations based on your target guest profile and investment strategy.
| Neighborhood / Area | Why Host Here? (Target Guests & Appeal) | Key Attractions & Landmarks |
|---|---|---|
| Evergreen Lake | A scenic spot perfect for outdoor enthusiasts featuring hiking, fishing, and picnicking. Attracts visitors looking for tranquility and nature activities. | Evergreen Lake, Evergreen Lake Park, Lake House, Beaver Brook Watershed, Centennial Cone Park |
| Downtown Evergreen | The charming downtown area offers local shops, restaurants, and a welcoming atmosphere. Ideal for those wanting to experience local culture and convenience. | Evergreen Nature Center, Local shops and boutiques, Cafes and restaurants, Evergreen Mountain, Historical Society |
| Elk Meadow Park | Beautiful park with extensive trails and stunning views of the mountains. Perfect for hikers and nature lovers seeking outdoor adventures. | Elk Meadow Park, Hiking trails, Wildlife viewing, Picnic areas, Scenic overlooks |
| Upper Bear Creek | A peaceful residential area with beautiful mountain homes and proximity to forested areas, perfect for families and those seeking a quiet retreat. | Bear Creek Canyon, Hiking trails, Morrison Falls, Access to Evergreen's Backcountry |
| Hiwan Golf Club | A private golf course area that attracts golf enthusiasts. Great for guests seeking leisure and outdoor sports in a luxurious setting. | Hiwan Golf Club, Evergreen Golf Course, Nearby restaurants, Scenic drive in the foothills |
| Stagecoach Park | A popular recreational park with sports fields and picnic areas, attracting families and outdoor enthusiasts. | Stagecoach Park, Playgrounds, Sports fields, Picnic areas, Walking trails |
| Red Rocks Park and Amphitheatre | A world-renowned concert venue surrounded by stunning red rock formations. Perfect for music lovers and those exploring natural beauty. | Red Rocks Amphitheatre, Hiking trails, Visitor Center, Scenic views, Concerts |
| Mountain Area | The general mountainous area is ideal for vacation homes and retreats, offering stunning views and access to skiing and hiking. | Ski resorts, Hiking opportunities, Scenic drives, Wildlife viewing, Outdoor recreation |
Understanding Airbnb License Requirements & STR Laws in Evergreen (2026)
With 17% of listings showing registration in 2026, understanding potential Airbnb license requirements is crucial in Evergreen. Always verify the latest short term rental regulations and Airbnb license requirements directly with local government authorities for Evergreen to ensure full compliance before hosting.
(Source: AirROI data, 2026, based on 17% licensed listings)
Top Performing Airbnb Properties in Evergreen (2026)
Benchmark your potential! Explore examples of top-performing Airbnb properties in Evergreenbased on Trailing Twelve Month (TTM) revenue. Analyze their characteristics, revenue, occupancy rate, and ADR to understand what drives success in this market.
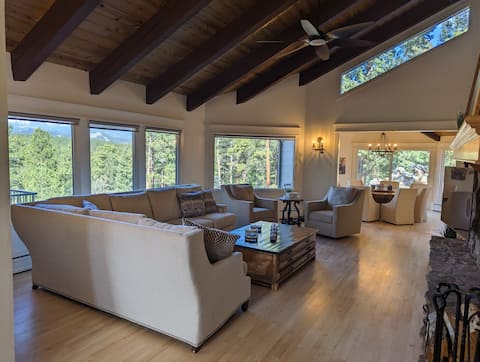
Large Evergreen Mountain Retreat
Entire Place • 5 bedrooms
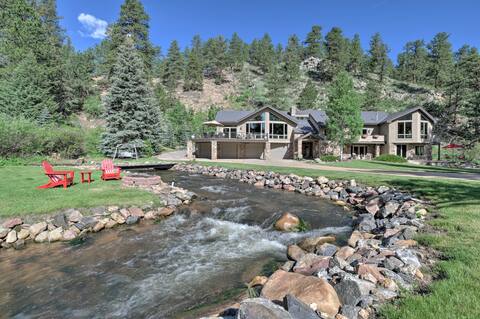
Stunning Mtn Views, Private Stream: Evergreen Gem!
Entire Place • 4 bedrooms
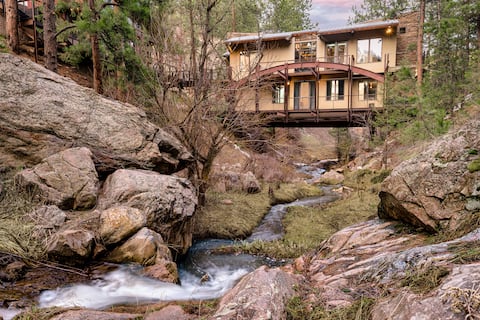
The Bridge House | 10 Minutes to Red Rocks | Sauna
Entire Place • 5 bedrooms
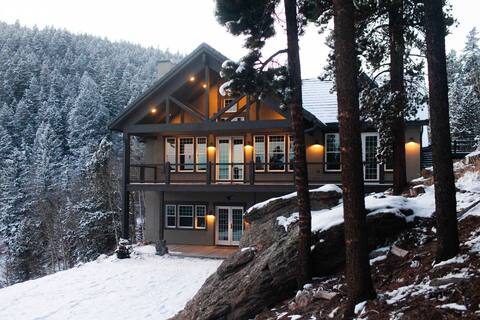
Top 1%| Views |Luxe Salt Hot Tub| 10 mins to Ski
Entire Place • 3 bedrooms

Views! Hot Tub! Game Room! Direct Trail Access!
Entire Place • 3 bedrooms
Evergreen Lake Dam Overlook Lodge •Creek •Hot Tub
Entire Place • 5 bedrooms
Note: Performance varies based on location, size, amenities, seasonality, and management quality. Data reflects the past 12 months.
Top Performing Airbnb Hosts in Evergreen (2026)
Learn from the best! This table showcases top-performing Airbnb hosts in Evergreen based on the number of properties managed and estimated total revenue over the past year. Analyze their scale and performance metrics.
| Host Name | Properties | Grossing Revenue | Stay Reviews | Avg Rating |
|---|---|---|---|---|
| Brandon | 3 | $456,412 | 293 | 4.92/5.0 |
| Evolve | 6 | $365,982 | 287 | 4.79/5.0 |
| Effortless Stay | 5 | $336,888 | 194 | 4.85/5.0 |
| Susan | 9 | $329,671 | 298 | 4.88/5.0 |
| Ken | 1 | $244,396 | 32 | 4.97/5.0 |
| Mycah | 2 | $213,024 | 24 | 4.84/5.0 |
| Chantal | 1 | $212,274 | 51 | 4.86/5.0 |
| Alea | 5 | $205,558 | 344 | 4.98/5.0 |
| Cathee | 2 | $194,047 | 158 | 4.99/5.0 |
| David | 1 | $193,506 | 84 | 5.00/5.0 |
Analyzing the strategies of top hosts, such as their property selection, pricing, and guest communication, can offer valuable lessons for optimizing your own Airbnb operations in Evergreen.
Dive Deeper: Advanced Evergreen STR Market Data (2026)
Ready to unlock more insights? AirROI provides access to advanced metrics and comprehensive Airbnb data for Evergreen. Explore detailed analytics beyond this report to refine your investment strategy, optimize pricing, and maximize your vacation rental profits.
Explore Advanced MetricsEvergreen Short-Term Rental Market Composition (2026): Property & Room Types
Room Type Distribution
Property Type Distribution
Market Composition Insights for Evergreen
- The Evergreen Airbnb market composition is heavily skewed towards Entire Home/Apt listings, which make up 87.4% of the 190 active rentals. This indicates strong guest preference for privacy and space.
- Looking at the property type distribution in Evergreen, House properties are the most common (51.1%), reflecting the local real estate landscape.
- Houses represent a significant 51.1% portion, catering likely to families or larger groups.
- The presence of 6.8% Hotel/Boutique listings indicates integration with traditional hospitality.
- Smaller segments like apartment/condo, unique stays (combined 5.8%) offer potential for unique stay experiences.
Evergreen Airbnb Room Capacity Analysis (2026): Bedroom Distribution
Distribution of Listings by Number of Bedrooms
Room Capacity Insights for Evergreen
- The dominant room capacity in Evergreen is 1 bedroom listings, making up 32.6% of the market. This suggests a strong demand for properties suitable for couples or solo travelers.
- Together, 1 bedroom and 3 bedrooms properties represent 55.8% of the active Airbnb listings in Evergreen, indicating a high concentration in these sizes.
- A significant 43.2% of listings offer 3+ bedrooms, catering to larger groups and families seeking more space in Evergreen.
Evergreen Vacation Rental Guest Capacity Trends (2026)
Distribution of Listings by Guest Capacity
Guest Capacity Insights for Evergreen
- The most common guest capacity trend in Evergreen vacation rentals is listings accommodating 8+ guests (23.2%). This suggests the primary traveler segment is likely larger groups.
- Properties designed for 8+ guests and 2 guests dominate the Evergreen STR market, accounting for 45.8% of listings.
- 48.0% of properties accommodate 6+ guests, serving the market segment for larger families or group travel in Evergreen.
- On average, properties in Evergreen are equipped to host 4.7 guests.
Evergreen Airbnb Booking Patterns (2026): Available vs. Booked Days
Available Days Distribution
Booked Days Distribution
Booking Pattern Insights for Evergreen
- The most common availability pattern in Evergreen falls within the 271-366 days range, representing 33.2% of listings. This suggests many properties have significant open periods on their calendars.
- Approximately 64.3% of listings show high availability (181+ days open annually), indicating potential for increased bookings or specific owner usage patterns.
- For booked days, the 181-270 days range is most frequent in Evergreen (31.6%), reflecting common guest stay durations or potential owner blocking patterns.
- A notable 37.4% of properties secure long booking periods (181+ days booked per year), highlighting successful long-term rental strategies or significant owner usage.
Evergreen Airbnb Minimum Stay Requirements Analysis
Distribution of Listings by Minimum Night Requirement
1 Night
37 listings
19.5% of total
2 Nights
26 listings
13.7% of total
3 Nights
13 listings
6.8% of total
4-6 Nights
6 listings
3.2% of total
7-29 Nights
24 listings
12.6% of total
30+ Nights
84 listings
44.2% of total
Key Insights
- The most prevalent minimum stay requirement in Evergreen is 30+ Nights, adopted by 44.2% of listings. This highlights the market's preference for longer commitments.
- A significant segment (44.2%) caters to monthly stays (30+ nights) in Evergreen, pointing to opportunities in the extended-stay market.
Recommendations
- Align with the market by considering a 30+ Nights minimum stay, as 44.2% of Evergreen hosts use this setting.
- If feasible, allowing 1-night stays, especially midweek or during low season, could capture last-minute bookings, as only 19.5% currently do.
- Explore offering discounts for stays of 30+ nights to attract the 44.2% of the market seeking extended stays.
- Adjust minimum nights based on seasonality – potentially shorter during low season and longer during peak demand periods in Evergreen.
Evergreen Airbnb Cancellation Policy Trends Analysis (2026)
Super Strict 30 Days
1 listings
0.5% of total
Limited
6 listings
3.2% of total
Flexible
22 listings
11.6% of total
Moderate
40 listings
21.1% of total
Firm
76 listings
40% of total
Strict
45 listings
23.7% of total
Cancellation Policy Insights for Evergreen
- The prevailing Airbnb cancellation policy trend in Evergreen is Firm, used by 40% of listings.
- A majority (63.7%) of hosts in Evergreen utilize Firm or Strict policies, indicating a market where hosts prioritize booking security.
Recommendations for Hosts
- Consider adopting a Firm policy to align with the 40% market standard in Evergreen.
- Regularly review your cancellation policy against competitors and market demand shifts in Evergreen.
Evergreen STR Booking Lead Time Analysis (2026)
Average Booking Lead Time by Month
Booking Lead Time Insights for Evergreen
- The overall average booking lead time for vacation rentals in Evergreen is 62 days.
- Guests book furthest in advance for stays during June (average 81 days), likely coinciding with peak travel demand or local events.
- The shortest booking windows occur for stays in March (average 40 days), indicating more last-minute travel plans during this time.
- Seasonally, Summer (78 days avg.) sees the longest lead times, while Winter (46 days avg.) has the shortest, reflecting typical travel planning cycles.
Recommendations for Hosts
- Use the overall average lead time (62 days) as a baseline for your pricing and availability strategy in Evergreen.
- For June stays, consider implementing length-of-stay discounts or slightly higher rates for bookings made less than 81 days out to capitalize on advance planning.
- Target marketing efforts for the Summer season well in advance (at least 78 days) to capture early planners.
- Monitor your own booking lead times against these Evergreen averages to identify opportunities for dynamic pricing adjustments.
Popular & Essential Airbnb Amenities in Evergreen (2026)
Amenity Prevalence
Amenity Insights for Evergreen
- Essential amenities in Evergreen that guests expect include: Free parking on premises, Wifi, Carbon monoxide alarm, Heating, Smoke alarm, Coffee maker, Hot water, Dishes and silverware. Lacking these (any) could significantly impact bookings.
- Popular amenities like Hair dryer, TV are common but not universal. Offering these can provide a competitive edge.
Recommendations for Hosts
- Ensure your listing includes all essential amenities for Evergreen: Free parking on premises, Wifi, Carbon monoxide alarm, Heating, Smoke alarm, Coffee maker, Hot water, Dishes and silverware.
- Prioritize adding missing essentials: Wifi, Carbon monoxide alarm, Heating, Smoke alarm, Coffee maker, Hot water, Dishes and silverware.
- Consider adding popular differentiators like Hair dryer or TV to increase appeal.
- Highlight unique or less common amenities you offer (e.g., hot tub, dedicated workspace, EV charger) in your listing description and photos.
- Regularly check competitor amenities in Evergreen to stay competitive.
Evergreen Airbnb Guest Demographics & Profile Analysis (2026)
Guest Profile Summary for Evergreen
- The typical guest profile for Airbnb in Evergreen consists of primarily domestic travelers (97%), often arriving from nearby Denver, typically belonging to the Post-2000s (Gen Z/Alpha) group (50%), primarily speaking English or Spanish.
- Domestic travelers account for 97.0% of guests.
- Key international markets include United States (97%) and Canada (0.8%).
- Top languages spoken are English (76.1%) followed by Spanish (12.8%).
- A significant demographic segment is the Post-2000s (Gen Z/Alpha) group, representing 50% of guests.
Recommendations for Hosts
- Target domestic marketing efforts towards travelers from Denver and Austin.
- Tailor amenities and listing descriptions to appeal to the dominant Post-2000s (Gen Z/Alpha) demographic (e.g., highlight fast WiFi, smart home features, local guides).
- Highlight unique local experiences or amenities relevant to the primary guest profile.
- Consider seasonal promotions aligned with peak travel times for key origin markets.
Nearby Short-Term Rental Market Comparison
How does the Evergreen Airbnb market stack up against its neighbors? Compare key performance metrics like average monthly revenue, ADR, and occupancy rates in surrounding areas to understand the broader regional STR landscape.
| Market | Active Properties | Monthly Revenue | Daily Rate | Avg. Occupancy |
|---|---|---|---|---|
| Blue River | 201 | $7,203 | $609.20 | 45% |
| Aspen | 610 | $7,095 | $992.28 | 36% |
| Snowmass | 21 | $6,247 | $701.59 | 40% |
| Aspen Park | 11 | $5,825 | $395.00 | 54% |
| Indian Hills | 11 | $5,799 | $333.03 | 54% |
| Grand County | 14 | $5,137 | $513.48 | 42% |
| Breckenridge | 3,051 | $4,995 | $544.32 | 40% |
| Crested Butte | 267 | $4,956 | $536.90 | 42% |
| Snowmass Village | 636 | $4,938 | $711.61 | 35% |
| Black Hawk | 133 | $4,884 | $328.37 | 52% |