Estes Park Airbnb Market Analysis 2026: Short Term Rental Data & Vacation Rental Statistics in Colorado, United States
Is Airbnb profitable in Estes Park in 2026? Explore comprehensive Airbnb analytics for Estes Park, Colorado, United States to uncover income potential. This 2026 STR market report for Estes Park, based on AirROI data from February 2025 to January 2026, reveals key trends in the bustling market of 1,311 active listings.
Whether you're considering an Airbnb investment in Estes Park, optimizing your existing vacation rental, or exploring rental arbitrage opportunities, understanding the Estes Park Airbnb data is crucial. Leveraging the low regulation environment is key to maximizing your short term rental income potential. Let's dive into the specifics.
Key Estes Park Airbnb Performance Metrics Overview
Monthly Airbnb Revenue Variations & Income Potential in Estes Park (2026)
Understanding the monthly revenue variations for Airbnb listings in Estes Park is key to maximizing your short term rental income potential. Seasonality significantly impacts earnings. Our analysis, based on data from the past 12 months, shows that the peak revenue month for STRs in Estes Park is typically July, while February often presents the lowest earnings, highlighting opportunities for strategic pricing adjustments during shoulder and low seasons. Explore the typical Airbnb income in Estes Park across different performance tiers:
- Best-in-class properties (Top 10%) achieve $10,457+ monthly, often utilizing dynamic pricing and superior guest experiences.
- Strong performing properties (Top 25%) earn $7,064 or more, indicating effective management and desirable locations/amenities.
- Typical properties (Median) generate around $4,496 per month, representing the average market performance.
- Entry-level properties (Bottom 25%) see earnings around $2,589, often with potential for optimization.
Average Monthly Airbnb Earnings Trend in Estes Park
Estes Park Airbnb Occupancy Rate Trends (2026)
Maximize your bookings by understanding the Estes Park STR occupancy trends. Seasonal demand shifts significantly influence how often properties are booked. Typically, Julysees the highest demand (peak season occupancy), while January experiences the lowest (low season). Effective strategies, like adjusting minimum stays or offering promotions, can boost occupancy during slower periods. Here's how different property tiers perform in Estes Park:
- Best-in-class properties (Top 10%) achieve 78%+ occupancy, indicating high desirability and potentially optimized availability.
- Strong performing properties (Top 25%) maintain 63% or higher occupancy, suggesting good market fit and guest satisfaction.
- Typical properties (Median) have an occupancy rate around 46%.
- Entry-level properties (Bottom 25%) average 28% occupancy, potentially facing higher vacancy.
Average Monthly Occupancy Rate Trend in Estes Park
Average Daily Rate (ADR) Airbnb Trends in Estes Park (2026)
Effective short term rental pricing strategy in Estes Park involves understanding monthly ADR fluctuations. The Average Daily Rate (ADR) for Airbnb in Estes Park typically peaks in September and dips lowest during February. Leveraging Airbnb dynamic pricing tools or strategies based on this seasonality can significantly boost revenue. Here's a look at the typical nightly rates achieved:
- Best-in-class properties (Top 10%) command rates of $614+ per night, often due to premium features or locations.
- Strong performing properties (Top 25%) achieve nightly rates of $415 or more.
- Typical properties (Median) charge around $302 per night.
- Entry-level properties (Bottom 25%) earn around $230 per night.
Average Daily Rate (ADR) Trend by Month in Estes Park
Get Live Estes Park Market Intelligence 👇

Explore Real-time Analytics
Airbnb Seasonality Analysis & Trends in Estes Park (2026)
Peak Season (July, September, June)
- Revenue averages $9,171 per month
- Occupancy rates average 66.4%
- Daily rates average $448
Shoulder Season
- Revenue averages $5,114 per month
- Occupancy maintains around 43.8%
- Daily rates hold near $373
Low Season (January, February, April)
- Revenue drops to average $2,458 per month
- Occupancy decreases to average 29.6%
- Daily rates adjust to average $316
Seasonality Insights for Estes Park
- The Airbnb seasonality in Estes Park shows highly seasonal trends requiring careful strategy. While the sections above show seasonal averages, it's also insightful to look at the extremes:
- During the high season, the absolute peak month showcases Estes Park's highest earning potential, with monthly revenues capable of climbing to $10,381, occupancy reaching a high of 71.5%, and ADRs peaking at $455.
- Conversely, the slowest single month of the year, typically falling within the low season, marks the market's lowest point. In this month, revenue might dip to $2,115, occupancy could drop to 26.3%, and ADRs may adjust down to $301.
- Understanding both the seasonal averages and these monthly peaks and troughs in revenue, occupancy, and ADR is crucial for maximizing your Airbnb profit potential in Estes Park.
Seasonal Strategies for Maximizing Profit
- Peak Season: Maximize revenue through premium pricing and potentially longer minimum stays. Ensure high availability.
- Low Season: Offer competitive pricing, special promotions (e.g., extended stay discounts), and flexible cancellation policies. Target off-season travelers like remote workers or budget-conscious guests.
- Shoulder Seasons: Implement dynamic pricing that balances peak and low rates. Target weekend travelers or specific events. Offer slightly more flexible terms than peak season.
- Regularly analyze your own performance against these Estes Park seasonality benchmarks and adjust your pricing and availability strategy accordingly.
Best Areas for Airbnb Investment in Estes Park (2026)
Exploring the top neighborhoods for short-term rentals in Estes Park? This section highlights key areas, outlining why they are attractive for hosts and guests, along with notable local attractions. Consider these locations based on your target guest profile and investment strategy.
| Neighborhood / Area | Why Host Here? (Target Guests & Appeal) | Key Attractions & Landmarks |
|---|---|---|
| Downtown Estes Park | The heart of Estes Park featuring a variety of shops, restaurants, and local attractions. This area attracts tourists looking to experience the local culture and easy access to attractions. | Estes Park Riverwalk, The Stanley Hotel, Local shops and boutiques, Restaurants and cafes, Estes Park Aerial Tramway |
| Lake Estes | Scenic area around Lake Estes, ideal for outdoor enthusiasts. Offers beautiful views and various recreational activities, making it a popular choice for families and nature lovers. | Lake Estes, Estes Park Marina, Hiking and biking trails, Fishing, Picnicking areas |
| Rocky Mountain National Park | A world-renowned national park attracting millions of visitors each year. Perfect for those wanting a nature-centric Airbnb experience close to stunning landscapes and outdoor adventures. | Trail Ridge Road, Bear Lake, Moraine Park, Hiking trails, Wildlife viewing |
| The Olde Town | Historic area showcasing the charm of Estes Park with preserved buildings and unique architecture. This area appeals to visitors interested in history and local culture. | Morain's Historic District, Local art galleries, Craft breweries, Historic walking tours |
| Wind River Valley | A peaceful area slightly away from the busier attractions, offering a tranquil environment perfect for a rural escape while still being accessible to the main attractions. | Wind River, Hiking trails, Scenic views, Peaceful atmosphere |
| Estes Park Golf Course Area | Great for visitors who enjoy golf and the outdoors. This area combines fabulous views and access to the golf course with other outdoor activities. | Estes Park Golf Course, Nearby hiking areas, Beautiful mountain scenery |
| Fall River Road | A scenic route famous for its beautiful landscapes. Ideal for adventure seekers who want quick access to thrilling outdoor activities. | Lewis Falls, Hiking trails, Scenic overlooks, Wildlife viewing |
| Fish Creek Road | A serene area with access to beautiful camping spots, hiking trails, and fishing. Perfect for families and groups looking for an outdoor getaway. | Fish Creek Falls, Hiking trails, Fishing spots, Camping areas |
Understanding Airbnb License Requirements & STR Laws in Estes Park (2026)
While Estes Park, Colorado, United States currently shows low STR regulations, specific Airbnb license requirements might still exist or change. Always verify the latest short term rental regulations and Airbnb license requirements directly with local government authorities for Estes Park to ensure full compliance before hosting.
(Source: AirROI data, 2026, based on 3% licensed listings)
Top Performing Airbnb Properties in Estes Park (2026)
Benchmark your potential! Explore examples of top-performing Airbnb properties in Estes Parkbased on Trailing Twelve Month (TTM) revenue. Analyze their characteristics, revenue, occupancy rate, and ADR to understand what drives success in this market.
Mtn Views!, Gas FirePit, HTub, Billiards, BBCourt
Entire Place • 8 bedrooms
Lake Front! Mtn/Lake Views,HotTub,Gas FirePit,Walk
Entire Place • 4 bedrooms
Rocky Creek Lodge, Sleeps 30, Gatherings Welcome
Entire Place • 9 bedrooms
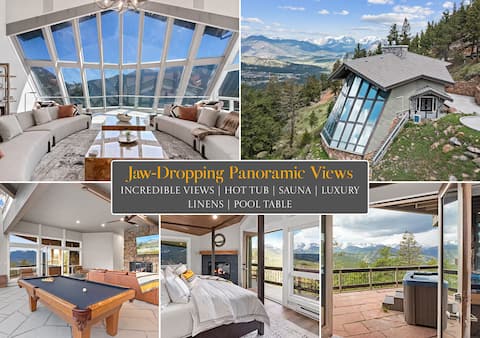
Lux Colorado Retreat | Epic Views | HotTub | Sauna
Entire Place • 6 bedrooms

Panorama - Your Private Resort by Estes Park Homes
Entire Place • 6 bedrooms

Moose Lodge, Estes Park CO
Entire Place • 6 bedrooms
Note: Performance varies based on location, size, amenities, seasonality, and management quality. Data reflects the past 12 months.
Top Performing Airbnb Hosts in Estes Park (2026)
Learn from the best! This table showcases top-performing Airbnb hosts in Estes Park based on the number of properties managed and estimated total revenue over the past year. Analyze their scale and performance metrics.
| Host Name | Properties | Grossing Revenue | Stay Reviews | Avg Rating |
|---|---|---|---|---|
| SkyRun | 89 | $4,436,871 | 4758 | 4.80/5.0 |
| Voyago Vacation Rentals | 33 | $4,017,422 | 746 | 4.94/5.0 |
| Rocky | 93 | $3,167,262 | 6739 | 4.74/5.0 |
| Jesse | 32 | $3,120,218 | 2724 | 4.92/5.0 |
| Estes Park | 54 | $2,657,172 | 800 | 4.83/5.0 |
| Ponderosa Realty & Management | 58 | $2,395,107 | 2591 | 4.77/5.0 |
| RedAwning | 34 | $2,379,761 | 86 | 4.37/5.0 |
| Karine | 28 | $2,348,463 | 1989 | 4.92/5.0 |
| Lowell | 47 | $1,832,833 | 1298 | 4.71/5.0 |
| John | 35 | $1,481,288 | 1250 | 4.83/5.0 |
Analyzing the strategies of top hosts, such as their property selection, pricing, and guest communication, can offer valuable lessons for optimizing your own Airbnb operations in Estes Park.
Dive Deeper: Advanced Estes Park STR Market Data (2026)
Ready to unlock more insights? AirROI provides access to advanced metrics and comprehensive Airbnb data for Estes Park. Explore detailed analytics beyond this report to refine your investment strategy, optimize pricing, and maximize your vacation rental profits.
Explore Advanced MetricsEstes Park Short-Term Rental Market Composition (2026): Property & Room Types
Room Type Distribution
Property Type Distribution
Market Composition Insights for Estes Park
- The Estes Park Airbnb market composition is heavily skewed towards Entire Home/Apt listings, which make up 94.3% of the 1,311 active rentals. This indicates strong guest preference for privacy and space.
- Looking at the property type distribution in Estes Park, House properties are the most common (37.6%), reflecting the local real estate landscape.
- Houses represent a significant 37.6% portion, catering likely to families or larger groups.
- Smaller segments like hotel/boutique, others, unique stays (combined 6.7%) offer potential for unique stay experiences.
Estes Park Airbnb Room Capacity Analysis (2026): Bedroom Distribution
Distribution of Listings by Number of Bedrooms
Room Capacity Insights for Estes Park
- The dominant room capacity in Estes Park is 2 bedrooms listings, making up 31.5% of the market. This suggests a strong demand for properties suitable for couples or solo travelers.
- Together, 2 bedrooms and 1 bedroom properties represent 56.5% of the active Airbnb listings in Estes Park, indicating a high concentration in these sizes.
- A significant 36.8% of listings offer 3+ bedrooms, catering to larger groups and families seeking more space in Estes Park.
Estes Park Vacation Rental Guest Capacity Trends (2026)
Distribution of Listings by Guest Capacity
Guest Capacity Insights for Estes Park
- The most common guest capacity trend in Estes Park vacation rentals is listings accommodating 8+ guests (30.4%). This suggests the primary traveler segment is likely larger groups.
- Properties designed for 8+ guests and 6 guests dominate the Estes Park STR market, accounting for 58.8% of listings.
- 60.1% of properties accommodate 6+ guests, serving the market segment for larger families or group travel in Estes Park.
- On average, properties in Estes Park are equipped to host 5.5 guests.
Estes Park Airbnb Booking Patterns (2026): Available vs. Booked Days
Available Days Distribution
Booked Days Distribution
Booking Pattern Insights for Estes Park
- The most common availability pattern in Estes Park falls within the 181-270 days range, representing 46.8% of listings. This suggests many properties have significant open periods on their calendars.
- Approximately 74.9% of listings show high availability (181+ days open annually), indicating potential for increased bookings or specific owner usage patterns.
- For booked days, the 91-180 days range is most frequent in Estes Park (46.7%), reflecting common guest stay durations or potential owner blocking patterns.
- A notable 26.7% of properties secure long booking periods (181+ days booked per year), highlighting successful long-term rental strategies or significant owner usage.
Estes Park Airbnb Minimum Stay Requirements Analysis
Distribution of Listings by Minimum Night Requirement
1 Night
134 listings
10.2% of total
2 Nights
352 listings
26.8% of total
3 Nights
62 listings
4.7% of total
4-6 Nights
20 listings
1.5% of total
7-29 Nights
12 listings
0.9% of total
30+ Nights
731 listings
55.8% of total
Key Insights
- The most prevalent minimum stay requirement in Estes Park is 30+ Nights, adopted by 55.8% of listings. This highlights the market's preference for longer commitments.
- A significant segment (55.8%) caters to monthly stays (30+ nights) in Estes Park, pointing to opportunities in the extended-stay market.
Recommendations
- Align with the market by considering a 30+ Nights minimum stay, as 55.8% of Estes Park hosts use this setting.
- If feasible, allowing 1-night stays, especially midweek or during low season, could capture last-minute bookings, as only 10.2% currently do.
- Explore offering discounts for stays of 30+ nights to attract the 55.8% of the market seeking extended stays.
- Adjust minimum nights based on seasonality – potentially shorter during low season and longer during peak demand periods in Estes Park.
Estes Park Airbnb Cancellation Policy Trends Analysis (2026)
Limited
36 listings
2.8% of total
Super Strict 30 Days
125 listings
9.5% of total
Super Strict 60 Days
44 listings
3.4% of total
Flexible
53 listings
4% of total
Moderate
268 listings
20.5% of total
Firm
482 listings
36.8% of total
Strict
301 listings
23% of total
Cancellation Policy Insights for Estes Park
- The prevailing Airbnb cancellation policy trend in Estes Park is Firm, used by 36.8% of listings.
- A majority (59.8%) of hosts in Estes Park utilize Firm or Strict policies, indicating a market where hosts prioritize booking security.
Recommendations for Hosts
- Consider adopting a Firm policy to align with the 36.8% market standard in Estes Park.
- Regularly review your cancellation policy against competitors and market demand shifts in Estes Park.
Estes Park STR Booking Lead Time Analysis (2026)
Average Booking Lead Time by Month
Booking Lead Time Insights for Estes Park
- The overall average booking lead time for vacation rentals in Estes Park is 66 days.
- Guests book furthest in advance for stays during July (average 96 days), likely coinciding with peak travel demand or local events.
- The shortest booking windows occur for stays in February (average 31 days), indicating more last-minute travel plans during this time.
- Seasonally, Summer (85 days avg.) sees the longest lead times, while Winter (40 days avg.) has the shortest, reflecting typical travel planning cycles.
Recommendations for Hosts
- Use the overall average lead time (66 days) as a baseline for your pricing and availability strategy in Estes Park.
- For July stays, consider implementing length-of-stay discounts or slightly higher rates for bookings made less than 96 days out to capitalize on advance planning.
- Target marketing efforts for the Summer season well in advance (at least 85 days) to capture early planners.
- Monitor your own booking lead times against these Estes Park averages to identify opportunities for dynamic pricing adjustments.
Popular & Essential Airbnb Amenities in Estes Park (2026)
Amenity Prevalence
Amenity Insights for Estes Park
- Essential amenities in Estes Park that guests expect include: Smoke alarm, Wifi, Carbon monoxide alarm, TV, Free parking on premises, Heating. Lacking these (any) could significantly impact bookings.
- Popular amenities like Hair dryer, Essentials, Kitchen are common but not universal. Offering these can provide a competitive edge.
Recommendations for Hosts
- Ensure your listing includes all essential amenities for Estes Park: Smoke alarm, Wifi, Carbon monoxide alarm, TV, Free parking on premises, Heating.
- Prioritize adding missing essentials: Smoke alarm, Wifi, Carbon monoxide alarm, TV, Free parking on premises, Heating.
- Consider adding popular differentiators like Hair dryer or Essentials to increase appeal.
- Highlight unique or less common amenities you offer (e.g., hot tub, dedicated workspace, EV charger) in your listing description and photos.
- Regularly check competitor amenities in Estes Park to stay competitive.
Estes Park Airbnb Guest Demographics & Profile Analysis (2026)
Guest Profile Summary for Estes Park
- The typical guest profile for Airbnb in Estes Park consists of primarily domestic travelers (96%), often arriving from nearby Denver, typically belonging to the Post-2000s (Gen Z/Alpha) group (50%), primarily speaking English or Spanish.
- Domestic travelers account for 96.4% of guests.
- Key international markets include United States (96.4%) and DC (0.7%).
- Top languages spoken are English (72.9%) followed by Spanish (11.6%).
- A significant demographic segment is the Post-2000s (Gen Z/Alpha) group, representing 50% of guests.
Recommendations for Hosts
- Target domestic marketing efforts towards travelers from Denver and Colorado Springs.
- Tailor amenities and listing descriptions to appeal to the dominant Post-2000s (Gen Z/Alpha) demographic (e.g., highlight fast WiFi, smart home features, local guides).
- Highlight unique local experiences or amenities relevant to the primary guest profile.
- Consider seasonal promotions aligned with peak travel times for key origin markets.
Nearby Short-Term Rental Market Comparison
How does the Estes Park Airbnb market stack up against its neighbors? Compare key performance metrics like average monthly revenue, ADR, and occupancy rates in surrounding areas to understand the broader regional STR landscape.
| Market | Active Properties | Monthly Revenue | Daily Rate | Avg. Occupancy |
|---|---|---|---|---|
| Blue River | 201 | $7,203 | $609.20 | 45% |
| Aspen | 610 | $7,095 | $992.28 | 36% |
| Snowmass | 21 | $6,247 | $701.59 | 40% |
| Aspen Park | 11 | $5,825 | $395.00 | 54% |
| Indian Hills | 11 | $5,799 | $333.03 | 54% |
| Grand County | 14 | $5,137 | $513.48 | 42% |
| Breckenridge | 3,051 | $4,995 | $544.32 | 40% |
| Snowmass Village | 636 | $4,938 | $711.61 | 35% |
| Black Hawk | 133 | $4,884 | $328.37 | 52% |
| Beaver Creek | 522 | $4,818 | $901.27 | 30% |