Englewood Airbnb Market Analysis 2026: Short Term Rental Data & Vacation Rental Statistics in Colorado, United States
Is Airbnb profitable in Englewood in 2026? Explore comprehensive Airbnb analytics for Englewood, Colorado, United States to uncover income potential. This 2026 STR market report for Englewood, based on AirROI data from February 2025 to January 2026, reveals key trends in the niche market of 137 active listings.
Whether you're considering an Airbnb investment in Englewood, optimizing your existing vacation rental, or exploring rental arbitrage opportunities, understanding the Englewood Airbnb data is crucial. Navigating the high regulation landscape is key to maximizing your short term rental income potential. Let's dive into the specifics.
Key Englewood Airbnb Performance Metrics Overview
Monthly Airbnb Revenue Variations & Income Potential in Englewood (2026)
Understanding the monthly revenue variations for Airbnb listings in Englewood is key to maximizing your short term rental income potential. Seasonality significantly impacts earnings. Our analysis, based on data from the past 12 months, shows that the peak revenue month for STRs in Englewood is typically July, while January often presents the lowest earnings, highlighting opportunities for strategic pricing adjustments during shoulder and low seasons. Explore the typical Airbnb income in Englewood across different performance tiers:
- Best-in-class properties (Top 10%) achieve $5,698+ monthly, often utilizing dynamic pricing and superior guest experiences.
- Strong performing properties (Top 25%) earn $3,754 or more, indicating effective management and desirable locations/amenities.
- Typical properties (Median) generate around $2,173 per month, representing the average market performance.
- Entry-level properties (Bottom 25%) see earnings around $1,077, often with potential for optimization.
Average Monthly Airbnb Earnings Trend in Englewood
Englewood Airbnb Occupancy Rate Trends (2026)
Maximize your bookings by understanding the Englewood STR occupancy trends. Seasonal demand shifts significantly influence how often properties are booked. Typically, Julysees the highest demand (peak season occupancy), while January experiences the lowest (low season). Effective strategies, like adjusting minimum stays or offering promotions, can boost occupancy during slower periods. Here's how different property tiers perform in Englewood:
- Best-in-class properties (Top 10%) achieve 86%+ occupancy, indicating high desirability and potentially optimized availability.
- Strong performing properties (Top 25%) maintain 72% or higher occupancy, suggesting good market fit and guest satisfaction.
- Typical properties (Median) have an occupancy rate around 53%.
- Entry-level properties (Bottom 25%) average 30% occupancy, potentially facing higher vacancy.
Average Monthly Occupancy Rate Trend in Englewood
Average Daily Rate (ADR) Airbnb Trends in Englewood (2026)
Effective short term rental pricing strategy in Englewood involves understanding monthly ADR fluctuations. The Average Daily Rate (ADR) for Airbnb in Englewood typically peaks in July and dips lowest during February. Leveraging Airbnb dynamic pricing tools or strategies based on this seasonality can significantly boost revenue. Here's a look at the typical nightly rates achieved:
- Best-in-class properties (Top 10%) command rates of $274+ per night, often due to premium features or locations.
- Strong performing properties (Top 25%) achieve nightly rates of $184 or more.
- Typical properties (Median) charge around $114 per night.
- Entry-level properties (Bottom 25%) earn around $73 per night.
Average Daily Rate (ADR) Trend by Month in Englewood
Get Live Englewood Market Intelligence 👇

Explore Real-time Analytics
Airbnb Seasonality Analysis & Trends in Englewood (2026)
Peak Season (July, June, August)
- Revenue averages $3,519 per month
- Occupancy rates average 60.7%
- Daily rates average $153
Shoulder Season
- Revenue averages $2,771 per month
- Occupancy maintains around 53.4%
- Daily rates hold near $144
Low Season (January, February, December)
- Revenue drops to average $1,977 per month
- Occupancy decreases to average 39.3%
- Daily rates adjust to average $141
Seasonality Insights for Englewood
- The Airbnb seasonality in Englewood shows highly seasonal trends requiring careful strategy. While the sections above show seasonal averages, it's also insightful to look at the extremes:
- During the high season, the absolute peak month showcases Englewood's highest earning potential, with monthly revenues capable of climbing to $3,777, occupancy reaching a high of 64.9%, and ADRs peaking at $155.
- Conversely, the slowest single month of the year, typically falling within the low season, marks the market's lowest point. In this month, revenue might dip to $1,705, occupancy could drop to 33.8%, and ADRs may adjust down to $132.
- Understanding both the seasonal averages and these monthly peaks and troughs in revenue, occupancy, and ADR is crucial for maximizing your Airbnb profit potential in Englewood.
Seasonal Strategies for Maximizing Profit
- Peak Season: Maximize revenue through premium pricing and potentially longer minimum stays. Ensure high availability.
- Low Season: Offer competitive pricing, special promotions (e.g., extended stay discounts), and flexible cancellation policies. Target off-season travelers like remote workers or budget-conscious guests.
- Shoulder Seasons: Implement dynamic pricing that balances peak and low rates. Target weekend travelers or specific events. Offer slightly more flexible terms than peak season.
- Regularly analyze your own performance against these Englewood seasonality benchmarks and adjust your pricing and availability strategy accordingly.
Best Areas for Airbnb Investment in Englewood (2026)
Exploring the top neighborhoods for short-term rentals in Englewood? This section highlights key areas, outlining why they are attractive for hosts and guests, along with notable local attractions. Consider these locations based on your target guest profile and investment strategy.
| Neighborhood / Area | Why Host Here? (Target Guests & Appeal) | Key Attractions & Landmarks |
|---|---|---|
| Cherry Hills Village | A desirable suburban area known for its affluent neighborhoods, proximity to Denver, and beautiful parks. Ideal for families and those looking for a quiet retreat while still being close to the city amenities. | Cherry Hills Country Club, Deveaux Park, Highline Canal Trail, Nearby golf courses |
| Englewood Historic District | Known for its charming historical architecture and close-knit community vibe. The area attracts visitors interested in local history and quaint surroundings. | Englewood Depot, Acoma Plaza, Civic Center Park, Nearby restaurants and shops |
| South Broadway | A diverse area known for its vibrant arts scene, eclectic shops, and numerous dining options. This neighborhood attracts a younger crowd and those looking for a lively atmosphere. | Swallow Hill Music, Englewood Art District, Various bars and breweries, Unique boutiques |
| Union Avenue | A developing area with a mix of new apartments and historical buildings, attracting young professionals and first-time visitors to Englewood. | Englewood Light Rail Station, Local cafes and restaurants, Nearby parks |
| Baker Park | A growing neighborhood that offers more affordable accommodations while still being close to Denver and its attractions. Great for budget travelers. | Baker Park, Nearby shopping areas, Parks and recreational facilities |
| Rotary Park | A community-focused area known for its outdoor spaces and family-friendly activities. Attracts visitors looking for a peaceful place to unwind yet still enjoy local attractions. | Rotary Park gazebo, Playgrounds, Community events |
| Bergen Park | Known for its scenic views and outdoor recreation opportunities, this area attracts nature lovers and families looking for fresh air and adventure. | Bergen Peak, Hiking trails, Scenic viewpoints |
| Littleton | A neighboring city with its own attractions, Littleton offers an urban-suburban mix that's great for visitors looking to experience both city life and nature. | Littleton Museum, O’Brien Park, Englewood Historic Theatre, Dining options along Main Street |
Understanding Airbnb License Requirements & STR Laws in Englewood (2026)
Yes, Englewood, Colorado, United States enforces high STR regulations. Obtaining a license and ensuring compliance is almost certainly required according to current 2026 STR laws. Always verify the latest short term rental regulations and Airbnb license requirements directly with local government authorities for Englewood to ensure full compliance before hosting.
(Source: AirROI data, 2026, based on 52% licensed listings)
Top Performing Airbnb Properties in Englewood (2026)
Benchmark your potential! Explore examples of top-performing Airbnb properties in Englewoodbased on Trailing Twelve Month (TTM) revenue. Analyze their characteristics, revenue, occupancy rate, and ADR to understand what drives success in this market.

Spacious Hidden Gem w/ Hot Tub & 15 mins to Denver
Entire Place • 5 bedrooms

5-Star 5bedroom Home + Gym & 11AM Checkout!
Entire Place • 5 bedrooms
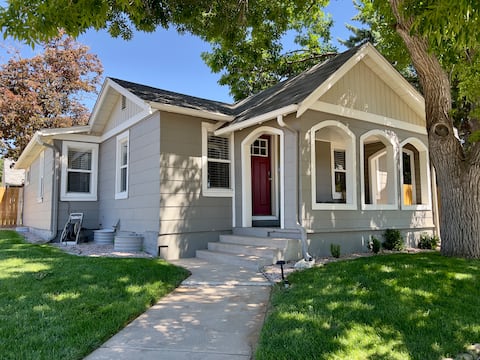
Gorgeous, renovated 1930s bungalow in Englewood!
Entire Place • 2 bedrooms
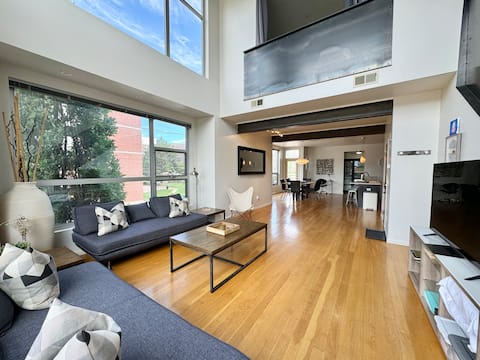
Modern Luxury with Rooftop Oasis | Prime Location
Entire Place • 2 bedrooms

Cozy and clean dog-friendly Englewood home
Entire Place • 2 bedrooms
Rooftop Firepit, King Bed & 5BR Upscale Home
Entire Place • 5 bedrooms
Note: Performance varies based on location, size, amenities, seasonality, and management quality. Data reflects the past 12 months.
Top Performing Airbnb Hosts in Englewood (2026)
Learn from the best! This table showcases top-performing Airbnb hosts in Englewood based on the number of properties managed and estimated total revenue over the past year. Analyze their scale and performance metrics.
| Host Name | Properties | Grossing Revenue | Stay Reviews | Avg Rating |
|---|---|---|---|---|
| Brad And Kami | 1 | $127,570 | 187 | 4.98/5.0 |
| Patrick | 1 | $117,734 | 130 | 4.93/5.0 |
| April | 1 | $110,303 | 79 | 4.99/5.0 |
| Felipe | 2 | $88,491 | 58 | 4.92/5.0 |
| Kyle | 2 | $88,466 | 128 | 4.86/5.0 |
| Shawna | 3 | $80,804 | 42 | 4.86/5.0 |
| Greg | 1 | $78,553 | 64 | 5.00/5.0 |
| Sally | 1 | $72,344 | 42 | 4.98/5.0 |
| Albert | 1 | $72,184 | 217 | 4.85/5.0 |
| Evolve | 1 | $70,029 | 47 | 4.89/5.0 |
Analyzing the strategies of top hosts, such as their property selection, pricing, and guest communication, can offer valuable lessons for optimizing your own Airbnb operations in Englewood.
Dive Deeper: Advanced Englewood STR Market Data (2026)
Ready to unlock more insights? AirROI provides access to advanced metrics and comprehensive Airbnb data for Englewood. Explore detailed analytics beyond this report to refine your investment strategy, optimize pricing, and maximize your vacation rental profits.
Explore Advanced MetricsEnglewood Short-Term Rental Market Composition (2026): Property & Room Types
Room Type Distribution
Property Type Distribution
Market Composition Insights for Englewood
- The Englewood Airbnb market composition is heavily skewed towards Entire Home/Apt listings, which make up 90.5% of the 137 active rentals. This indicates strong guest preference for privacy and space.
- Looking at the property type distribution in Englewood, House properties are the most common (48.9%), reflecting the local real estate landscape.
- Houses represent a significant 48.9% portion, catering likely to families or larger groups.
- The presence of 10.2% Hotel/Boutique listings indicates integration with traditional hospitality.
Englewood Airbnb Room Capacity Analysis (2026): Bedroom Distribution
Distribution of Listings by Number of Bedrooms
Room Capacity Insights for Englewood
- The dominant room capacity in Englewood is 2 bedrooms listings, making up 35% of the market. This suggests a strong demand for properties suitable for couples or solo travelers.
- Together, 2 bedrooms and 1 bedroom properties represent 69.3% of the active Airbnb listings in Englewood, indicating a high concentration in these sizes.
Englewood Vacation Rental Guest Capacity Trends (2026)
Distribution of Listings by Guest Capacity
Guest Capacity Insights for Englewood
- The most common guest capacity trend in Englewood vacation rentals is listings accommodating 2 guests (27%). This suggests the primary traveler segment is likely couples or solo travelers.
- Properties designed for 2 guests and 4 guests dominate the Englewood STR market, accounting for 50.4% of listings.
- 24.7% of properties accommodate 6+ guests, serving the market segment for larger families or group travel in Englewood.
- On average, properties in Englewood are equipped to host 3.6 guests.
Englewood Airbnb Booking Patterns (2026): Available vs. Booked Days
Available Days Distribution
Booked Days Distribution
Booking Pattern Insights for Englewood
- The most common availability pattern in Englewood falls within the 271-366 days range, representing 46% of listings. This suggests many properties have significant open periods on their calendars.
- Approximately 74.5% of listings show high availability (181+ days open annually), indicating potential for increased bookings or specific owner usage patterns.
- For booked days, the 31-90 days range is most frequent in Englewood (29.2%), reflecting common guest stay durations or potential owner blocking patterns.
- A notable 27.7% of properties secure long booking periods (181+ days booked per year), highlighting successful long-term rental strategies or significant owner usage.
Englewood Airbnb Minimum Stay Requirements Analysis
Distribution of Listings by Minimum Night Requirement
1 Night
14 listings
10.2% of total
2 Nights
11 listings
8% of total
3 Nights
3 listings
2.2% of total
4-6 Nights
3 listings
2.2% of total
7-29 Nights
20 listings
14.6% of total
30+ Nights
86 listings
62.8% of total
Key Insights
- The most prevalent minimum stay requirement in Englewood is 30+ Nights, adopted by 62.8% of listings. This highlights the market's preference for longer commitments.
- Very short stays (1-2 nights) are less common (18.2%), suggesting hosts prefer slightly longer bookings to optimize turnover.
- A significant segment (62.8%) caters to monthly stays (30+ nights) in Englewood, pointing to opportunities in the extended-stay market.
Recommendations
- Align with the market by considering a 30+ Nights minimum stay, as 62.8% of Englewood hosts use this setting.
- If feasible, allowing 1-night stays, especially midweek or during low season, could capture last-minute bookings, as only 10.2% currently do.
- Explore offering discounts for stays of 30+ nights to attract the 62.8% of the market seeking extended stays.
- Adjust minimum nights based on seasonality – potentially shorter during low season and longer during peak demand periods in Englewood.
Englewood Airbnb Cancellation Policy Trends Analysis (2026)
Limited
6 listings
4.4% of total
Flexible
26 listings
19.1% of total
Moderate
32 listings
23.5% of total
Firm
66 listings
48.5% of total
Strict
6 listings
4.4% of total
Cancellation Policy Insights for Englewood
- The prevailing Airbnb cancellation policy trend in Englewood is Firm, used by 48.5% of listings.
- A majority (52.9%) of hosts in Englewood utilize Firm or Strict policies, indicating a market where hosts prioritize booking security.
- Strict cancellation policies are quite rare (4.4%), potentially making listings with this policy less competitive unless justified by high demand or property type.
Recommendations for Hosts
- Consider adopting a Firm policy to align with the 48.5% market standard in Englewood.
- Using a Strict policy might deter some guests, as only 4.4% of listings use it. Evaluate if potential revenue protection outweighs possible lower booking rates.
- Regularly review your cancellation policy against competitors and market demand shifts in Englewood.
Englewood STR Booking Lead Time Analysis (2026)
Average Booking Lead Time by Month
Booking Lead Time Insights for Englewood
- The overall average booking lead time for vacation rentals in Englewood is 32 days.
- Guests book furthest in advance for stays during June (average 51 days), likely coinciding with peak travel demand or local events.
- The shortest booking windows occur for stays in February (average 18 days), indicating more last-minute travel plans during this time.
- Seasonally, Summer (47 days avg.) sees the longest lead times, while Winter (21 days avg.) has the shortest, reflecting typical travel planning cycles.
Recommendations for Hosts
- Use the overall average lead time (32 days) as a baseline for your pricing and availability strategy in Englewood.
- For June stays, consider implementing length-of-stay discounts or slightly higher rates for bookings made less than 51 days out to capitalize on advance planning.
- Target marketing efforts for the Summer season well in advance (at least 47 days) to capture early planners.
- Monitor your own booking lead times against these Englewood averages to identify opportunities for dynamic pricing adjustments.
Popular & Essential Airbnb Amenities in Englewood (2026)
Amenity Prevalence
Amenity Insights for Englewood
- Essential amenities in Englewood that guests expect include: Smoke alarm, Wifi, Heating, TV, Carbon monoxide alarm, Hot water, Air conditioning. Lacking these (any) could significantly impact bookings.
- Popular amenities like Dishes and silverware, Coffee maker, Bed linens are common but not universal. Offering these can provide a competitive edge.
Recommendations for Hosts
- Ensure your listing includes all essential amenities for Englewood: Smoke alarm, Wifi, Heating, TV, Carbon monoxide alarm, Hot water, Air conditioning.
- Prioritize adding missing essentials: Heating, TV, Carbon monoxide alarm, Hot water, Air conditioning.
- Consider adding popular differentiators like Dishes and silverware or Coffee maker to increase appeal.
- Highlight unique or less common amenities you offer (e.g., hot tub, dedicated workspace, EV charger) in your listing description and photos.
- Regularly check competitor amenities in Englewood to stay competitive.
Englewood Airbnb Guest Demographics & Profile Analysis (2026)
Guest Profile Summary for Englewood
- The typical guest profile for Airbnb in Englewood consists of primarily domestic travelers (96%), often arriving from nearby Denver, typically belonging to the Post-2000s (Gen Z/Alpha) group (50%), primarily speaking English or Spanish.
- Domestic travelers account for 96.2% of guests.
- Key international markets include United States (96.2%) and Canada (0.9%).
- Top languages spoken are English (73.7%) followed by Spanish (13.3%).
- A significant demographic segment is the Post-2000s (Gen Z/Alpha) group, representing 50% of guests.
Recommendations for Hosts
- Target domestic marketing efforts towards travelers from Denver and St. Louis.
- Tailor amenities and listing descriptions to appeal to the dominant Post-2000s (Gen Z/Alpha) demographic (e.g., highlight fast WiFi, smart home features, local guides).
- Highlight unique local experiences or amenities relevant to the primary guest profile.
- Consider seasonal promotions aligned with peak travel times for key origin markets.
Nearby Short-Term Rental Market Comparison
How does the Englewood Airbnb market stack up against its neighbors? Compare key performance metrics like average monthly revenue, ADR, and occupancy rates in surrounding areas to understand the broader regional STR landscape.
| Market | Active Properties | Monthly Revenue | Daily Rate | Avg. Occupancy |
|---|---|---|---|---|
| Aspen Park | 11 | $5,825 | $395.00 | 54% |
| Indian Hills | 11 | $5,799 | $333.03 | 54% |
| Grand County | 14 | $5,137 | $513.48 | 42% |
| Black Hawk | 133 | $4,884 | $328.37 | 52% |
| Central City | 10 | $4,789 | $318.09 | 52% |
| Bailey | 126 | $4,611 | $310.32 | 53% |
| Cascade-Chipita Park | 103 | $4,541 | $330.50 | 52% |
| Estes Park | 1,311 | $4,504 | $383.02 | 45% |
| Woodmoor | 43 | $4,444 | $335.63 | 46% |
| Applewood | 18 | $4,400 | $269.95 | 56% |