Denver Airbnb Market Analysis 2026: Short Term Rental Data & Vacation Rental Statistics in Colorado, United States
Is Airbnb profitable in Denver in 2026? Explore comprehensive Airbnb analytics for Denver, Colorado, United States to uncover income potential. This 2026 STR market report for Denver, based on AirROI data from February 2025 to January 2026, reveals key trends in the bustling market of 3,523 active listings.
Whether you're considering an Airbnb investment in Denver, optimizing your existing vacation rental, or exploring rental arbitrage opportunities, understanding the Denver Airbnb data is crucial. Navigating the high regulation landscape is key to maximizing your short term rental income potential. Let's dive into the specifics.
Key Denver Airbnb Performance Metrics Overview
Monthly Airbnb Revenue Variations & Income Potential in Denver (2026)
Understanding the monthly revenue variations for Airbnb listings in Denver is key to maximizing your short term rental income potential. Seasonality significantly impacts earnings. Our analysis, based on data from the past 12 months, shows that the peak revenue month for STRs in Denver is typically July, while January often presents the lowest earnings, highlighting opportunities for strategic pricing adjustments during shoulder and low seasons. Explore the typical Airbnb income in Denver across different performance tiers:
- Best-in-class properties (Top 10%) achieve $7,056+ monthly, often utilizing dynamic pricing and superior guest experiences.
- Strong performing properties (Top 25%) earn $4,553 or more, indicating effective management and desirable locations/amenities.
- Typical properties (Median) generate around $2,821 per month, representing the average market performance.
- Entry-level properties (Bottom 25%) see earnings around $1,565, often with potential for optimization.
Average Monthly Airbnb Earnings Trend in Denver
Denver Airbnb Occupancy Rate Trends (2026)
Maximize your bookings by understanding the Denver STR occupancy trends. Seasonal demand shifts significantly influence how often properties are booked. Typically, Julysees the highest demand (peak season occupancy), while January experiences the lowest (low season). Effective strategies, like adjusting minimum stays or offering promotions, can boost occupancy during slower periods. Here's how different property tiers perform in Denver:
- Best-in-class properties (Top 10%) achieve 87%+ occupancy, indicating high desirability and potentially optimized availability.
- Strong performing properties (Top 25%) maintain 75% or higher occupancy, suggesting good market fit and guest satisfaction.
- Typical properties (Median) have an occupancy rate around 57%.
- Entry-level properties (Bottom 25%) average 33% occupancy, potentially facing higher vacancy.
Average Monthly Occupancy Rate Trend in Denver
Average Daily Rate (ADR) Airbnb Trends in Denver (2026)
Effective short term rental pricing strategy in Denver involves understanding monthly ADR fluctuations. The Average Daily Rate (ADR) for Airbnb in Denver typically peaks in June and dips lowest during February. Leveraging Airbnb dynamic pricing tools or strategies based on this seasonality can significantly boost revenue. Here's a look at the typical nightly rates achieved:
- Best-in-class properties (Top 10%) command rates of $363+ per night, often due to premium features or locations.
- Strong performing properties (Top 25%) achieve nightly rates of $229 or more.
- Typical properties (Median) charge around $147 per night.
- Entry-level properties (Bottom 25%) earn around $99 per night.
Average Daily Rate (ADR) Trend by Month in Denver
Get Live Denver Market Intelligence 👇

Explore Real-time Analytics
Airbnb Seasonality Analysis & Trends in Denver (2026)
Peak Season (July, June, August)
- Revenue averages $4,486 per month
- Occupancy rates average 62.7%
- Daily rates average $206
Shoulder Season
- Revenue averages $3,555 per month
- Occupancy maintains around 53.6%
- Daily rates hold near $197
Low Season (January, February, March)
- Revenue drops to average $2,593 per month
- Occupancy decreases to average 45.6%
- Daily rates adjust to average $183
Seasonality Insights for Denver
- The Airbnb seasonality in Denver shows moderate seasonality with distinct peak and low periods. While the sections above show seasonal averages, it's also insightful to look at the extremes:
- During the high season, the absolute peak month showcases Denver's highest earning potential, with monthly revenues capable of climbing to $4,697, occupancy reaching a high of 65.0%, and ADRs peaking at $211.
- Conversely, the slowest single month of the year, typically falling within the low season, marks the market's lowest point. In this month, revenue might dip to $2,427, occupancy could drop to 37.5%, and ADRs may adjust down to $177.
- Understanding both the seasonal averages and these monthly peaks and troughs in revenue, occupancy, and ADR is crucial for maximizing your Airbnb profit potential in Denver.
Seasonal Strategies for Maximizing Profit
- Peak Season: Maximize revenue through premium pricing and potentially longer minimum stays. Ensure high availability.
- Low Season: Offer competitive pricing, special promotions (e.g., extended stay discounts), and flexible cancellation policies. Target off-season travelers like remote workers or budget-conscious guests.
- Shoulder Seasons: Implement dynamic pricing that balances peak and low rates. Target weekend travelers or specific events. Offer slightly more flexible terms than peak season.
- Regularly analyze your own performance against these Denver seasonality benchmarks and adjust your pricing and availability strategy accordingly.
Best Areas for Airbnb Investment in Denver (2026)
Exploring the top neighborhoods for short-term rentals in Denver? This section highlights key areas, outlining why they are attractive for hosts and guests, along with notable local attractions. Consider these locations based on your target guest profile and investment strategy.
| Neighborhood / Area | Why Host Here? (Target Guests & Appeal) | Key Attractions & Landmarks |
|---|---|---|
| RiNo (River North Art District) | An artsy, up-and-coming neighborhood known for its vibrant street art, breweries, and eclectic dining options. Popular among creatives and visitors wanting a unique cultural experience. | Street Art Murals, Art Galleries, Breweries, Food Halls, Civic Center Park |
| LoDo (Lower Downtown) | Historic district with beautiful Victorian buildings, nightlife, and easy access to Coors Field. Ideal for tourists looking for nightlife and proximity to sports events. | Coors Field, Union Station, Larimer Square, Local Breweries, Denver Millennium Bridge |
| Capitol Hill | Diverse neighborhood known for its historic architecture, quirky shops, and vibrant nightlife. Attracts young professionals and those looking for a lively atmosphere. | Colorado State Capitol, Capitol Hill Park, Molly Brown House Museum, Nightlife Venues, Local Cafés |
| Cherry Creek | Upscale area featuring shopping, dining, and outdoor activities. Popular for luxury travelers and those seeking a scenic and relaxing stay near parks. | Cherry Creek Shopping Center, Cherry Creek Trail, Outdoor Dining, Art Galleries, Parks |
| Golden Triangle Creative District | Cultural hub with museums and art galleries. Great for visitors interested in history and art, offering a unique perspective of Denver. | Denver Art Museum, History Colorado Center, Civic Center Park, Local Art Studios, Museums |
| Washington Park | Family-friendly neighborhood known for its large park and outdoor activities. Ideal for those seeking a more residential atmosphere with nature and space. | Washington Park, Boathouse, Trails, Picnic Areas, Gardens |
| Highlands | Trendy area with beautiful views of downtown Denver and the mountains. Offers a mix of dining, shopping, and nightlife, popular with young professionals. | Highlands Square, Local Breweries, View of Downtown, Restaurants, Boutiques |
| South Park Hill | Residential neighborhood with a community feel, close to parks and attractions. Attracts families and longer-term visitors looking for local experiences. | City Park, Denver Zoo, Museums, Local Schools, Parks |
Understanding Airbnb License Requirements & STR Laws in Denver (2026)
Yes, Denver, Colorado, United States enforces high STR regulations. Obtaining a license and ensuring compliance is almost certainly required according to current 2026 STR laws. Always verify the latest short term rental regulations and Airbnb license requirements directly with local government authorities for Denver to ensure full compliance before hosting.
(Source: AirROI data, 2026, based on 69% licensed listings)
Top Performing Airbnb Properties in Denver (2026)
Benchmark your potential! Explore examples of top-performing Airbnb properties in Denverbased on Trailing Twelve Month (TTM) revenue. Analyze their characteristics, revenue, occupancy rate, and ADR to understand what drives success in this market.

Downtown's Largest Rental - Walk to Everything!
Entire Place • 8 bedrooms
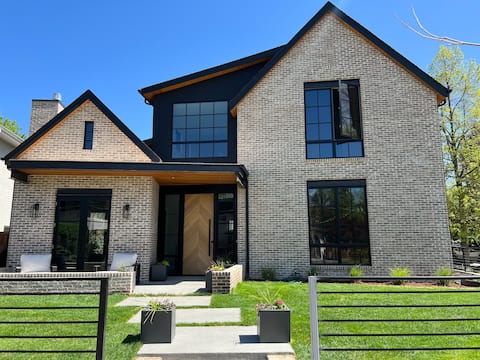
New build house with heated pool!
Entire Place • 6 bedrooms
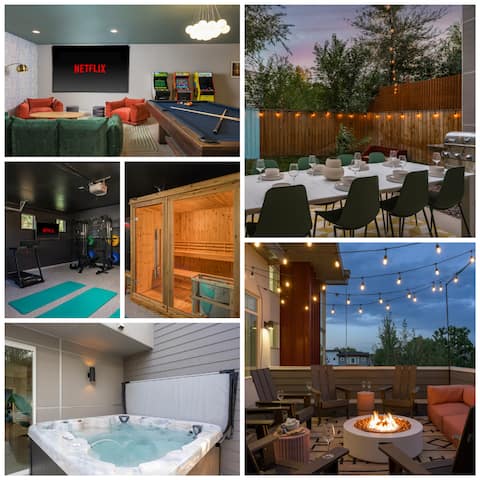
Luxe Wellness | Sauna, HotTub, Gym, FirePit, Games
Entire Place • 5 bedrooms
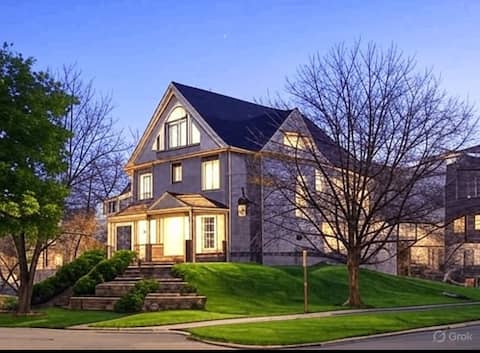
Biggest Mansion in denver downtown. 5069 feet
Entire Place • 7 bedrooms

Luxury & Walkable | Movie|Game Rm HotTub | Rooftop
Entire Place • 5 bedrooms
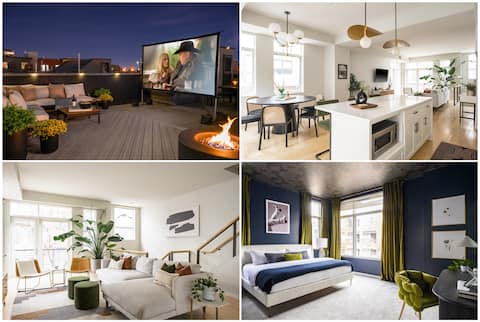
Luxury Home in Downtown DEN w/ Epic Rooftop Deck
Entire Place • 3 bedrooms
Note: Performance varies based on location, size, amenities, seasonality, and management quality. Data reflects the past 12 months.
Top Performing Airbnb Hosts in Denver (2026)
Learn from the best! This table showcases top-performing Airbnb hosts in Denver based on the number of properties managed and estimated total revenue over the past year. Analyze their scale and performance metrics.
| Host Name | Properties | Grossing Revenue | Stay Reviews | Avg Rating |
|---|---|---|---|---|
| Kyle Andrew | 41 | $2,095,808 | 3412 | 4.85/5.0 |
| Evolve | 64 | $1,850,321 | 1470 | 4.73/5.0 |
| Effortless Stay | 23 | $1,631,898 | 1038 | 4.81/5.0 |
| JZ Vacation Rentals | 27 | $1,591,117 | 1274 | 4.80/5.0 |
| AirSimplicity | 23 | $1,190,085 | 993 | 4.82/5.0 |
| Zuni Lofts X Effortless Stay | 19 | $1,092,411 | 2690 | 4.88/5.0 |
| Christina | 27 | $924,659 | 1747 | 4.93/5.0 |
| Hotel Residential | 3 | $791,681 | 306 | 4.98/5.0 |
| Scott | 27 | $762,864 | 815 | 4.87/5.0 |
| Sonder (Denver) | 24 | $731,660 | 6373 | 4.58/5.0 |
Analyzing the strategies of top hosts, such as their property selection, pricing, and guest communication, can offer valuable lessons for optimizing your own Airbnb operations in Denver.
Dive Deeper: Advanced Denver STR Market Data (2026)
Ready to unlock more insights? AirROI provides access to advanced metrics and comprehensive Airbnb data for Denver. Explore detailed analytics beyond this report to refine your investment strategy, optimize pricing, and maximize your vacation rental profits.
Explore Advanced MetricsDenver Short-Term Rental Market Composition (2026): Property & Room Types
Room Type Distribution
Property Type Distribution
Market Composition Insights for Denver
- The Denver Airbnb market composition is heavily skewed towards Entire Home/Apt listings, which make up 86.5% of the 3,523 active rentals. This indicates strong guest preference for privacy and space.
- Looking at the property type distribution in Denver, House properties are the most common (50.8%), reflecting the local real estate landscape.
- Houses represent a significant 50.8% portion, catering likely to families or larger groups.
- The presence of 8.8% Hotel/Boutique listings indicates integration with traditional hospitality.
- Smaller segments like unique stays, outdoor/unique (combined 0.4%) offer potential for unique stay experiences.
Denver Airbnb Room Capacity Analysis (2026): Bedroom Distribution
Distribution of Listings by Number of Bedrooms
Room Capacity Insights for Denver
- The dominant room capacity in Denver is 1 bedroom listings, making up 35.3% of the market. This suggests a strong demand for properties suitable for couples or solo travelers.
- Together, 1 bedroom and 2 bedrooms properties represent 62.9% of the active Airbnb listings in Denver, indicating a high concentration in these sizes.
- A significant 22.7% of listings offer 3+ bedrooms, catering to larger groups and families seeking more space in Denver.
Denver Vacation Rental Guest Capacity Trends (2026)
Distribution of Listings by Guest Capacity
Guest Capacity Insights for Denver
- The most common guest capacity trend in Denver vacation rentals is listings accommodating 2 guests (25%). This suggests the primary traveler segment is likely couples or solo travelers.
- Properties designed for 2 guests and 4 guests dominate the Denver STR market, accounting for 49.1% of listings.
- 27.5% of properties accommodate 6+ guests, serving the market segment for larger families or group travel in Denver.
- On average, properties in Denver are equipped to host 3.9 guests.
Denver Airbnb Booking Patterns (2026): Available vs. Booked Days
Available Days Distribution
Booked Days Distribution
Booking Pattern Insights for Denver
- The most common availability pattern in Denver falls within the 271-366 days range, representing 33.7% of listings. This suggests many properties have significant open periods on their calendars.
- Approximately 62.5% of listings show high availability (181+ days open annually), indicating potential for increased bookings or specific owner usage patterns.
- For booked days, the 181-270 days range is most frequent in Denver (29.7%), reflecting common guest stay durations or potential owner blocking patterns.
- A notable 39.0% of properties secure long booking periods (181+ days booked per year), highlighting successful long-term rental strategies or significant owner usage.
Denver Airbnb Minimum Stay Requirements Analysis
Distribution of Listings by Minimum Night Requirement
1 Night
661 listings
18.8% of total
2 Nights
490 listings
13.9% of total
3 Nights
113 listings
3.2% of total
4-6 Nights
114 listings
3.2% of total
7-29 Nights
767 listings
21.8% of total
30+ Nights
1377 listings
39.1% of total
Key Insights
- The most prevalent minimum stay requirement in Denver is 30+ Nights, adopted by 39.1% of listings. This highlights the market's preference for longer commitments.
- A significant segment (39.1%) caters to monthly stays (30+ nights) in Denver, pointing to opportunities in the extended-stay market.
Recommendations
- Align with the market by considering a 30+ Nights minimum stay, as 39.1% of Denver hosts use this setting.
- If feasible, allowing 1-night stays, especially midweek or during low season, could capture last-minute bookings, as only 18.8% currently do.
- Explore offering discounts for stays of 30+ nights to attract the 39.1% of the market seeking extended stays.
- Adjust minimum nights based on seasonality – potentially shorter during low season and longer during peak demand periods in Denver.
Denver Airbnb Cancellation Policy Trends Analysis (2026)
Limited
91 listings
2.6% of total
Super Strict 60 Days
6 listings
0.2% of total
Super Strict 30 Days
16 listings
0.5% of total
Flexible
644 listings
18.3% of total
Moderate
1022 listings
29.1% of total
Firm
1226 listings
34.9% of total
Strict
508 listings
14.5% of total
Cancellation Policy Insights for Denver
- The prevailing Airbnb cancellation policy trend in Denver is Firm, used by 34.9% of listings.
- There's a relatively balanced mix between guest-friendly (47.4%) and stricter (49.4%) policies, offering choices for different guest needs.
Recommendations for Hosts
- Consider adopting a Firm policy to align with the 34.9% market standard in Denver.
- Using a Strict policy might deter some guests, as only 14.5% of listings use it. Evaluate if potential revenue protection outweighs possible lower booking rates.
- Regularly review your cancellation policy against competitors and market demand shifts in Denver.
Denver STR Booking Lead Time Analysis (2026)
Average Booking Lead Time by Month
Booking Lead Time Insights for Denver
- The overall average booking lead time for vacation rentals in Denver is 41 days.
- Guests book furthest in advance for stays during June (average 56 days), likely coinciding with peak travel demand or local events.
- The shortest booking windows occur for stays in February (average 28 days), indicating more last-minute travel plans during this time.
- Seasonally, Summer (51 days avg.) sees the longest lead times, while Winter (31 days avg.) has the shortest, reflecting typical travel planning cycles.
Recommendations for Hosts
- Use the overall average lead time (41 days) as a baseline for your pricing and availability strategy in Denver.
- For June stays, consider implementing length-of-stay discounts or slightly higher rates for bookings made less than 56 days out to capitalize on advance planning.
- Target marketing efforts for the Summer season well in advance (at least 51 days) to capture early planners.
- Monitor your own booking lead times against these Denver averages to identify opportunities for dynamic pricing adjustments.
Popular & Essential Airbnb Amenities in Denver (2026)
Amenity Prevalence
Amenity Insights for Denver
- Essential amenities in Denver that guests expect include: Wifi, Smoke alarm, Carbon monoxide alarm, Heating, TV. Lacking these (any) could significantly impact bookings.
- Popular amenities like Air conditioning, Hot water, Dishes and silverware are common but not universal. Offering these can provide a competitive edge.
Recommendations for Hosts
- Ensure your listing includes all essential amenities for Denver: Wifi, Smoke alarm, Carbon monoxide alarm, Heating, TV.
- Prioritize adding missing essentials: Wifi, Smoke alarm, Carbon monoxide alarm, Heating, TV.
- Consider adding popular differentiators like Air conditioning or Hot water to increase appeal.
- Highlight unique or less common amenities you offer (e.g., hot tub, dedicated workspace, EV charger) in your listing description and photos.
- Regularly check competitor amenities in Denver to stay competitive.
Denver Airbnb Guest Demographics & Profile Analysis (2026)
Guest Profile Summary for Denver
- The typical guest profile for Airbnb in Denver consists of primarily domestic travelers (93%), often arriving from nearby Denver, typically belonging to the Post-2000s (Gen Z/Alpha) group (50%), primarily speaking English or Spanish.
- Domestic travelers account for 93.4% of guests.
- Key international markets include United States (93.4%) and Canada (1.3%).
- Top languages spoken are English (67.5%) followed by Spanish (15.1%).
- A significant demographic segment is the Post-2000s (Gen Z/Alpha) group, representing 50% of guests.
Recommendations for Hosts
- Target domestic marketing efforts towards travelers from Denver and New York.
- Tailor amenities and listing descriptions to appeal to the dominant Post-2000s (Gen Z/Alpha) demographic (e.g., highlight fast WiFi, smart home features, local guides).
- Highlight unique local experiences or amenities relevant to the primary guest profile.
- Consider seasonal promotions aligned with peak travel times for key origin markets.
Nearby Short-Term Rental Market Comparison
How does the Denver Airbnb market stack up against its neighbors? Compare key performance metrics like average monthly revenue, ADR, and occupancy rates in surrounding areas to understand the broader regional STR landscape.
| Market | Active Properties | Monthly Revenue | Daily Rate | Avg. Occupancy |
|---|---|---|---|---|
| Aspen Park | 11 | $5,825 | $395.00 | 54% |
| Indian Hills | 11 | $5,799 | $333.03 | 54% |
| Grand County | 14 | $5,137 | $513.48 | 42% |
| Black Hawk | 133 | $4,884 | $328.37 | 52% |
| Central City | 10 | $4,789 | $318.09 | 52% |
| Bailey | 126 | $4,611 | $310.32 | 53% |
| Cascade-Chipita Park | 103 | $4,541 | $330.50 | 52% |
| Estes Park | 1,311 | $4,504 | $383.02 | 45% |
| Woodmoor | 43 | $4,444 | $335.63 | 46% |
| Applewood | 18 | $4,400 | $269.95 | 56% |