Copper Mountain Airbnb Market Analysis 2026: Short Term Rental Data & Vacation Rental Statistics in Colorado, United States
Is Airbnb profitable in Copper Mountain in 2026? Explore comprehensive Airbnb analytics for Copper Mountain, Colorado, United States to uncover income potential. This 2026 STR market report for Copper Mountain, based on AirROI data from February 2025 to January 2026, reveals key trends in the niche market of 192 active listings.
Whether you're considering an Airbnb investment in Copper Mountain, optimizing your existing vacation rental, or exploring rental arbitrage opportunities, understanding the Copper Mountain Airbnb data is crucial. Navigating the high regulation landscape is key to maximizing your short term rental income potential. Let's dive into the specifics.
Key Copper Mountain Airbnb Performance Metrics Overview
Monthly Airbnb Revenue Variations & Income Potential in Copper Mountain (2026)
Understanding the monthly revenue variations for Airbnb listings in Copper Mountain is key to maximizing your short term rental income potential. Seasonality significantly impacts earnings. Our analysis, based on data from the past 12 months, shows that the peak revenue month for STRs in Copper Mountain is typically March, while May often presents the lowest earnings, highlighting opportunities for strategic pricing adjustments during shoulder and low seasons. Explore the typical Airbnb income in Copper Mountain across different performance tiers:
- Best-in-class properties (Top 10%) achieve $10,542+ monthly, often utilizing dynamic pricing and superior guest experiences.
- Strong performing properties (Top 25%) earn $6,640 or more, indicating effective management and desirable locations/amenities.
- Typical properties (Median) generate around $4,047 per month, representing the average market performance.
- Entry-level properties (Bottom 25%) see earnings around $2,203, often with potential for optimization.
Average Monthly Airbnb Earnings Trend in Copper Mountain
Copper Mountain Airbnb Occupancy Rate Trends (2026)
Maximize your bookings by understanding the Copper Mountain STR occupancy trends. Seasonal demand shifts significantly influence how often properties are booked. Typically, Marchsees the highest demand (peak season occupancy), while May experiences the lowest (low season). Effective strategies, like adjusting minimum stays or offering promotions, can boost occupancy during slower periods. Here's how different property tiers perform in Copper Mountain:
- Best-in-class properties (Top 10%) achieve 63%+ occupancy, indicating high desirability and potentially optimized availability.
- Strong performing properties (Top 25%) maintain 45% or higher occupancy, suggesting good market fit and guest satisfaction.
- Typical properties (Median) have an occupancy rate around 31%.
- Entry-level properties (Bottom 25%) average 17% occupancy, potentially facing higher vacancy.
Average Monthly Occupancy Rate Trend in Copper Mountain
Average Daily Rate (ADR) Airbnb Trends in Copper Mountain (2026)
Effective short term rental pricing strategy in Copper Mountain involves understanding monthly ADR fluctuations. The Average Daily Rate (ADR) for Airbnb in Copper Mountain typically peaks in January and dips lowest during August. Leveraging Airbnb dynamic pricing tools or strategies based on this seasonality can significantly boost revenue. Here's a look at the typical nightly rates achieved:
- Best-in-class properties (Top 10%) command rates of $938+ per night, often due to premium features or locations.
- Strong performing properties (Top 25%) achieve nightly rates of $561 or more.
- Typical properties (Median) charge around $389 per night.
- Entry-level properties (Bottom 25%) earn around $290 per night.
Average Daily Rate (ADR) Trend by Month in Copper Mountain
Get Live Copper Mountain Market Intelligence 👇

Explore Real-time Analytics
Airbnb Seasonality Analysis & Trends in Copper Mountain (2026)
Peak Season (March, February, January)
- Revenue averages $10,728 per month
- Occupancy rates average 53.0%
- Daily rates average $726
Shoulder Season
- Revenue averages $4,357 per month
- Occupancy maintains around 29.2%
- Daily rates hold near $495
Low Season (May, September, October)
- Revenue drops to average $2,117 per month
- Occupancy decreases to average 21.0%
- Daily rates adjust to average $425
Seasonality Insights for Copper Mountain
- The Airbnb seasonality in Copper Mountain shows highly seasonal trends requiring careful strategy. While the sections above show seasonal averages, it's also insightful to look at the extremes:
- During the high season, the absolute peak month showcases Copper Mountain's highest earning potential, with monthly revenues capable of climbing to $13,634, occupancy reaching a high of 63.4%, and ADRs peaking at $751.
- Conversely, the slowest single month of the year, typically falling within the low season, marks the market's lowest point. In this month, revenue might dip to $1,669, occupancy could drop to 18.8%, and ADRs may adjust down to $400.
- Understanding both the seasonal averages and these monthly peaks and troughs in revenue, occupancy, and ADR is crucial for maximizing your Airbnb profit potential in Copper Mountain.
Seasonal Strategies for Maximizing Profit
- Peak Season: Maximize revenue through premium pricing and potentially longer minimum stays. Ensure high availability.
- Low Season: Offer competitive pricing, special promotions (e.g., extended stay discounts), and flexible cancellation policies. Target off-season travelers like remote workers or budget-conscious guests.
- Shoulder Seasons: Implement dynamic pricing that balances peak and low rates. Target weekend travelers or specific events. Offer slightly more flexible terms than peak season.
- Regularly analyze your own performance against these Copper Mountain seasonality benchmarks and adjust your pricing and availability strategy accordingly.
Best Areas for Airbnb Investment in Copper Mountain (2026)
Exploring the top neighborhoods for short-term rentals in Copper Mountain? This section highlights key areas, outlining why they are attractive for hosts and guests, along with notable local attractions. Consider these locations based on your target guest profile and investment strategy.
| Neighborhood / Area | Why Host Here? (Target Guests & Appeal) | Key Attractions & Landmarks |
|---|---|---|
| Center Village | The heart of Copper Mountain with convenient access to ski lifts, dining, and shopping. Ideal for guests looking for an all-in-one location during ski season. | American Eagle Ski Lift, Copper Mountain Ski Resort, Ten Mile Tavern, Rocky Mountain Chocolate Factory, Copper Creek Golf Club |
| Union Creek | A family-friendly area with a charming atmosphere and easy access to beginner slopes. Perfect for guests traveling with children and those seeking a quieter stay. | Union Creek Ski Lift, Dercum's Dash, The Cache Cabin, Bowl Incline Ski Run, Ski Patrol Cabin |
| East Village | Offers a more laid-back experience with spacious accommodations and access to golf in the summer. Attracts families and larger groups looking for comfort and convenience. | East Village Ski Lift, Copper Mountain Golf Course, Alpenglow Stube, The Greco, The Woodward Copper Action Park |
| West Village | A scenic area featuring cozy lodges and easy access to various trails. Attractive to nature lovers and guests who enjoy outdoor activities. | West Village Ski Lift, Copper Mountain Nordic Center, Hikes around the area, Nearby fishing spots, The Great Adventure |
| The Village at Copper | Located at the base of the mountain, offering direct access to skiing and a vibrant nightlife. Great for those who want to be in the midst of the action. | Copper Mountain Village, The Avalanche Bar & Grill, The Last Lift Bar, Shopping at the village stores, Winter Carnival events |
| Copper Mountain Lakes | A serene area offering stunning views and a retreat-like atmosphere. Appeals to couples and those seeking relaxation away from the busyness. | Copper Lake, The 'Kokopelli' Loop, Fishing spots, Picnic areas, Hiking trails |
| Summit County | A broader area including Copper Mountain and neighboring ski resorts, attracting winter sports enthusiasts. Ideal for guests looking to experience multiple attractions. | Breckenridge Ski Resort, Keystone Resort, Lake Dillon, Breckenridge Distillery, Frisco Historic Park |
| Alpine Ski Area | Renowned for its challenging slopes and beautiful scenery. Attracts serious skiers and snowboarders looking for a thrilling vacation. | Late-night skiing spots, Snowboarding events, Alpine skiing courses, Snowshoeing trails, Avalanche safety courses |
Understanding Airbnb License Requirements & STR Laws in Copper Mountain (2026)
Yes, Copper Mountain, Colorado, United States enforces high STR regulations. Obtaining a license and ensuring compliance is almost certainly required according to current 2026 STR laws. Always verify the latest short term rental regulations and Airbnb license requirements directly with local government authorities for Copper Mountain to ensure full compliance before hosting.
(Source: AirROI data, 2026, based on 54% licensed listings)
Top Performing Airbnb Properties in Copper Mountain (2026)
Benchmark your potential! Explore examples of top-performing Airbnb properties in Copper Mountainbased on Trailing Twelve Month (TTM) revenue. Analyze their characteristics, revenue, occupancy rate, and ADR to understand what drives success in this market.
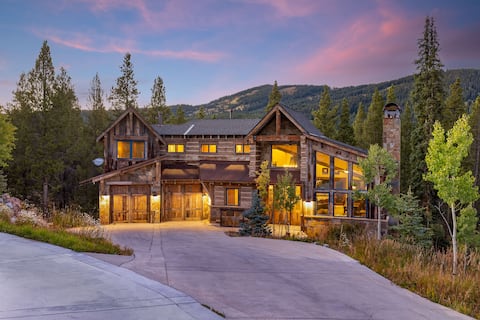
The Timber Lodge at Copper Mountain
Entire Place • 7 bedrooms
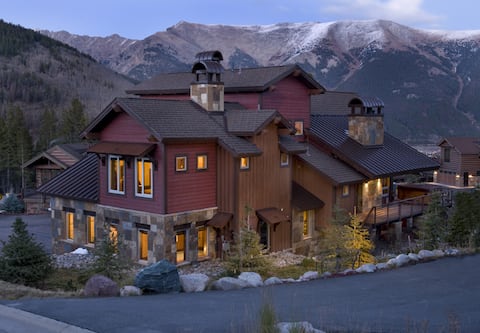
Slope Side Luxury Mountain Home
Entire Place • 7 bedrooms
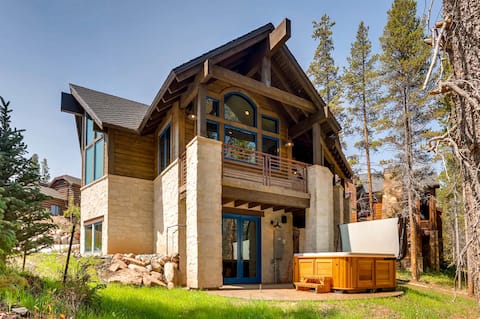
Award Winning True Ski in-Ski Out Masterpiece
Entire Place • 4 bedrooms

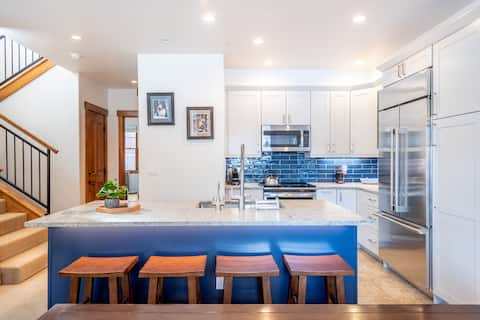
Steps from Slopes, Award Winning Modern Luxury!
Entire Place • 5 bedrooms
Cache 3204 -3 Bedroom condo
Entire Place • 3 bedrooms
Beautiful Executive Ski In/Ski Rooftop Hot tub!
Entire Place • 4 bedrooms
Note: Performance varies based on location, size, amenities, seasonality, and management quality. Data reflects the past 12 months.
Top Performing Airbnb Hosts in Copper Mountain (2026)
Learn from the best! This table showcases top-performing Airbnb hosts in Copper Mountain based on the number of properties managed and estimated total revenue over the past year. Analyze their scale and performance metrics.
| Host Name | Properties | Grossing Revenue | Stay Reviews | Avg Rating |
|---|---|---|---|---|
| Paul | 68 | $3,024,801 | 1352 | 4.69/5.0 |
| Richard | 38 | $1,089,521 | 507 | 4.68/5.0 |
| Tom | 5 | $456,112 | 379 | 4.90/5.0 |
| Bighorn | 11 | $445,720 | 192 | 4.64/5.0 |
| Evolve | 4 | $355,230 | 297 | 4.78/5.0 |
| Justin | 1 | $228,957 | 21 | 4.67/5.0 |
| Summit Mountain | 1 | $218,186 | 23 | 4.96/5.0 |
| Lisa | 2 | $176,915 | 135 | 4.97/5.0 |
| Ron | 4 | $171,798 | 702 | 4.78/5.0 |
| Krista | 3 | $158,942 | 191 | 4.91/5.0 |
Analyzing the strategies of top hosts, such as their property selection, pricing, and guest communication, can offer valuable lessons for optimizing your own Airbnb operations in Copper Mountain.
Dive Deeper: Advanced Copper Mountain STR Market Data (2026)
Ready to unlock more insights? AirROI provides access to advanced metrics and comprehensive Airbnb data for Copper Mountain. Explore detailed analytics beyond this report to refine your investment strategy, optimize pricing, and maximize your vacation rental profits.
Explore Advanced MetricsCopper Mountain Short-Term Rental Market Composition (2026): Property & Room Types
Room Type Distribution
Property Type Distribution
Market Composition Insights for Copper Mountain
- The Copper Mountain Airbnb market composition is heavily skewed towards Entire Home/Apt listings, which make up 97.9% of the 192 active rentals. This indicates strong guest preference for privacy and space.
- Looking at the property type distribution in Copper Mountain, Apartment/Condo properties are the most common (85.4%), reflecting the local real estate landscape.
- Smaller segments like hotel/boutique (combined 2.1%) offer potential for unique stay experiences.
Copper Mountain Airbnb Room Capacity Analysis (2026): Bedroom Distribution
Distribution of Listings by Number of Bedrooms
Room Capacity Insights for Copper Mountain
- The dominant room capacity in Copper Mountain is 2 bedrooms listings, making up 37.5% of the market. This suggests a strong demand for properties suitable for couples or solo travelers.
- Together, 2 bedrooms and 1 bedroom properties represent 75.0% of the active Airbnb listings in Copper Mountain, indicating a high concentration in these sizes.
Copper Mountain Vacation Rental Guest Capacity Trends (2026)
Distribution of Listings by Guest Capacity
Guest Capacity Insights for Copper Mountain
- The most common guest capacity trend in Copper Mountain vacation rentals is listings accommodating 8+ guests (33.3%). This suggests the primary traveler segment is likely larger groups.
- Properties designed for 8+ guests and 6 guests dominate the Copper Mountain STR market, accounting for 61.9% of listings.
- 65.0% of properties accommodate 6+ guests, serving the market segment for larger families or group travel in Copper Mountain.
- On average, properties in Copper Mountain are equipped to host 5.9 guests.
Copper Mountain Airbnb Booking Patterns (2026): Available vs. Booked Days
Available Days Distribution
Booked Days Distribution
Booking Pattern Insights for Copper Mountain
- The most common availability pattern in Copper Mountain falls within the 271-366 days range, representing 66.7% of listings. This suggests many properties have significant open periods on their calendars.
- Approximately 94.3% of listings show high availability (181+ days open annually), indicating potential for increased bookings or specific owner usage patterns.
- For booked days, the 31-90 days range is most frequent in Copper Mountain (40.1%), reflecting common guest stay durations or potential owner blocking patterns.
- A notable 6.3% of properties secure long booking periods (181+ days booked per year), highlighting successful long-term rental strategies or significant owner usage.
Copper Mountain Airbnb Minimum Stay Requirements Analysis
Distribution of Listings by Minimum Night Requirement
1 Night
13 listings
6.8% of total
2 Nights
43 listings
22.4% of total
3 Nights
2 listings
1% of total
4-6 Nights
10 listings
5.2% of total
7-29 Nights
3 listings
1.6% of total
30+ Nights
121 listings
63% of total
Key Insights
- The most prevalent minimum stay requirement in Copper Mountain is 30+ Nights, adopted by 63% of listings. This highlights the market's preference for longer commitments.
- A significant segment (63%) caters to monthly stays (30+ nights) in Copper Mountain, pointing to opportunities in the extended-stay market.
Recommendations
- Align with the market by considering a 30+ Nights minimum stay, as 63% of Copper Mountain hosts use this setting.
- If feasible, allowing 1-night stays, especially midweek or during low season, could capture last-minute bookings, as only 6.8% currently do.
- Explore offering discounts for stays of 30+ nights to attract the 63% of the market seeking extended stays.
- Adjust minimum nights based on seasonality – potentially shorter during low season and longer during peak demand periods in Copper Mountain.
Copper Mountain Airbnb Cancellation Policy Trends Analysis (2026)
Super Strict 60 Days
8 listings
4.2% of total
Limited
1 listings
0.5% of total
Super Strict 30 Days
54 listings
28.1% of total
Moderate
9 listings
4.7% of total
Firm
31 listings
16.1% of total
Strict
89 listings
46.4% of total
Cancellation Policy Insights for Copper Mountain
- The prevailing Airbnb cancellation policy trend in Copper Mountain is Strict, used by 46.4% of listings.
- A majority (62.5%) of hosts in Copper Mountain utilize Firm or Strict policies, indicating a market where hosts prioritize booking security.
Recommendations for Hosts
- Consider adopting a Strict policy to align with the 46.4% market standard in Copper Mountain.
- With 46.4% using Strict terms, this is a viable option in Copper Mountain, particularly for high-value properties or during peak demand periods.
- Regularly review your cancellation policy against competitors and market demand shifts in Copper Mountain.
Copper Mountain STR Booking Lead Time Analysis (2026)
Average Booking Lead Time by Month
Booking Lead Time Insights for Copper Mountain
- The overall average booking lead time for vacation rentals in Copper Mountain is 75 days.
- Guests book furthest in advance for stays during February (average 95 days), likely coinciding with peak travel demand or local events.
- The shortest booking windows occur for stays in June (average 26 days), indicating more last-minute travel plans during this time.
- Seasonally, Winter (88 days avg.) sees the longest lead times, while Summer (50 days avg.) has the shortest, reflecting typical travel planning cycles.
Recommendations for Hosts
- Use the overall average lead time (75 days) as a baseline for your pricing and availability strategy in Copper Mountain.
- For February stays, consider implementing length-of-stay discounts or slightly higher rates for bookings made less than 95 days out to capitalize on advance planning.
- Target marketing efforts for the Winter season well in advance (at least 88 days) to capture early planners.
- Monitor your own booking lead times against these Copper Mountain averages to identify opportunities for dynamic pricing adjustments.
Popular & Essential Airbnb Amenities in Copper Mountain (2026)
Amenity Prevalence
Amenity Insights for Copper Mountain
- Essential amenities in Copper Mountain that guests expect include: Heating, TV, Wifi, Smoke alarm, Coffee maker, Hair dryer, Refrigerator, Microwave, Free parking on premises, Carbon monoxide alarm. Lacking these (any) could significantly impact bookings.
Recommendations for Hosts
- Ensure your listing includes all essential amenities for Copper Mountain: Heating, TV, Wifi, Smoke alarm, Coffee maker, Hair dryer, Refrigerator, Microwave, Free parking on premises, Carbon monoxide alarm.
- Prioritize adding missing essentials: Wifi, Smoke alarm, Coffee maker, Hair dryer, Refrigerator, Microwave, Free parking on premises, Carbon monoxide alarm.
- Highlight unique or less common amenities you offer (e.g., hot tub, dedicated workspace, EV charger) in your listing description and photos.
- Regularly check competitor amenities in Copper Mountain to stay competitive.
Copper Mountain Airbnb Guest Demographics & Profile Analysis (2026)
Guest Profile Summary for Copper Mountain
- The typical guest profile for Airbnb in Copper Mountain consists of primarily domestic travelers (98%), often arriving from nearby Denver, typically belonging to the Post-2000s (Gen Z/Alpha) group (50%), primarily speaking English or Spanish.
- Domestic travelers account for 97.7% of guests.
- Key international markets include United States (97.7%) and New Zealand (0.5%).
- Top languages spoken are English (69.7%) followed by Spanish (13.2%).
- A significant demographic segment is the Post-2000s (Gen Z/Alpha) group, representing 50% of guests.
Recommendations for Hosts
- Target domestic marketing efforts towards travelers from Denver and Boulder.
- Tailor amenities and listing descriptions to appeal to the dominant Post-2000s (Gen Z/Alpha) demographic (e.g., highlight fast WiFi, smart home features, local guides).
- Highlight unique local experiences or amenities relevant to the primary guest profile.
- Consider seasonal promotions aligned with peak travel times for key origin markets.
Nearby Short-Term Rental Market Comparison
How does the Copper Mountain Airbnb market stack up against its neighbors? Compare key performance metrics like average monthly revenue, ADR, and occupancy rates in surrounding areas to understand the broader regional STR landscape.
| Market | Active Properties | Monthly Revenue | Daily Rate | Avg. Occupancy |
|---|---|---|---|---|
| Blue River | 201 | $7,203 | $609.20 | 45% |
| Aspen | 610 | $7,095 | $992.28 | 36% |
| Snowmass | 21 | $6,247 | $701.59 | 40% |
| El Jebel | 33 | $6,236 | $506.29 | 48% |
| Aspen Park | 11 | $5,825 | $395.00 | 54% |
| Indian Hills | 11 | $5,799 | $333.03 | 54% |
| Grand County | 14 | $5,137 | $513.48 | 42% |
| Glenwood Springs | 242 | $5,039 | $356.03 | 49% |
| Breckenridge | 3,051 | $4,995 | $544.32 | 40% |
| Crested Butte | 267 | $4,956 | $536.90 | 42% |