Colorado Springs Airbnb Market Analysis 2026: Short Term Rental Data & Vacation Rental Statistics in Colorado, United States
Is Airbnb profitable in Colorado Springs in 2026? Explore comprehensive Airbnb analytics for Colorado Springs, Colorado, United States to uncover income potential. This 2026 STR market report for Colorado Springs, based on AirROI data from February 2025 to January 2026, reveals key trends in the bustling market of 2,276 active listings.
Whether you're considering an Airbnb investment in Colorado Springs, optimizing your existing vacation rental, or exploring rental arbitrage opportunities, understanding the Colorado Springs Airbnb data is crucial. Leveraging the low regulation environment is key to maximizing your short term rental income potential. Let's dive into the specifics.
Key Colorado Springs Airbnb Performance Metrics Overview
Monthly Airbnb Revenue Variations & Income Potential in Colorado Springs (2026)
Understanding the monthly revenue variations for Airbnb listings in Colorado Springs is key to maximizing your short term rental income potential. Seasonality significantly impacts earnings. Our analysis, based on data from the past 12 months, shows that the peak revenue month for STRs in Colorado Springs is typically July, while February often presents the lowest earnings, highlighting opportunities for strategic pricing adjustments during shoulder and low seasons. Explore the typical Airbnb income in Colorado Springs across different performance tiers:
- Best-in-class properties (Top 10%) achieve $6,999+ monthly, often utilizing dynamic pricing and superior guest experiences.
- Strong performing properties (Top 25%) earn $4,589 or more, indicating effective management and desirable locations/amenities.
- Typical properties (Median) generate around $2,793 per month, representing the average market performance.
- Entry-level properties (Bottom 25%) see earnings around $1,493, often with potential for optimization.
Average Monthly Airbnb Earnings Trend in Colorado Springs
Colorado Springs Airbnb Occupancy Rate Trends (2026)
Maximize your bookings by understanding the Colorado Springs STR occupancy trends. Seasonal demand shifts significantly influence how often properties are booked. Typically, Julysees the highest demand (peak season occupancy), while January experiences the lowest (low season). Effective strategies, like adjusting minimum stays or offering promotions, can boost occupancy during slower periods. Here's how different property tiers perform in Colorado Springs:
- Best-in-class properties (Top 10%) achieve 86%+ occupancy, indicating high desirability and potentially optimized availability.
- Strong performing properties (Top 25%) maintain 73% or higher occupancy, suggesting good market fit and guest satisfaction.
- Typical properties (Median) have an occupancy rate around 54%.
- Entry-level properties (Bottom 25%) average 31% occupancy, potentially facing higher vacancy.
Average Monthly Occupancy Rate Trend in Colorado Springs
Average Daily Rate (ADR) Airbnb Trends in Colorado Springs (2026)
Effective short term rental pricing strategy in Colorado Springs involves understanding monthly ADR fluctuations. The Average Daily Rate (ADR) for Airbnb in Colorado Springs typically peaks in June and dips lowest during February. Leveraging Airbnb dynamic pricing tools or strategies based on this seasonality can significantly boost revenue. Here's a look at the typical nightly rates achieved:
- Best-in-class properties (Top 10%) command rates of $395+ per night, often due to premium features or locations.
- Strong performing properties (Top 25%) achieve nightly rates of $245 or more.
- Typical properties (Median) charge around $156 per night.
- Entry-level properties (Bottom 25%) earn around $103 per night.
Average Daily Rate (ADR) Trend by Month in Colorado Springs
Get Live Colorado Springs Market Intelligence 👇

Explore Real-time Analytics
Airbnb Seasonality Analysis & Trends in Colorado Springs (2026)
Peak Season (July, June, August)
- Revenue averages $5,083 per month
- Occupancy rates average 64.1%
- Daily rates average $225
Shoulder Season
- Revenue averages $3,454 per month
- Occupancy maintains around 50.5%
- Daily rates hold near $210
Low Season (January, February, April)
- Revenue drops to average $2,317 per month
- Occupancy decreases to average 43.0%
- Daily rates adjust to average $186
Seasonality Insights for Colorado Springs
- The Airbnb seasonality in Colorado Springs shows highly seasonal trends requiring careful strategy. While the sections above show seasonal averages, it's also insightful to look at the extremes:
- During the high season, the absolute peak month showcases Colorado Springs's highest earning potential, with monthly revenues capable of climbing to $5,575, occupancy reaching a high of 67.4%, and ADRs peaking at $230.
- Conversely, the slowest single month of the year, typically falling within the low season, marks the market's lowest point. In this month, revenue might dip to $2,014, occupancy could drop to 34.6%, and ADRs may adjust down to $170.
- Understanding both the seasonal averages and these monthly peaks and troughs in revenue, occupancy, and ADR is crucial for maximizing your Airbnb profit potential in Colorado Springs.
Seasonal Strategies for Maximizing Profit
- Peak Season: Maximize revenue through premium pricing and potentially longer minimum stays. Ensure high availability.
- Low Season: Offer competitive pricing, special promotions (e.g., extended stay discounts), and flexible cancellation policies. Target off-season travelers like remote workers or budget-conscious guests.
- Shoulder Seasons: Implement dynamic pricing that balances peak and low rates. Target weekend travelers or specific events. Offer slightly more flexible terms than peak season.
- Regularly analyze your own performance against these Colorado Springs seasonality benchmarks and adjust your pricing and availability strategy accordingly.
Best Areas for Airbnb Investment in Colorado Springs (2026)
Exploring the top neighborhoods for short-term rentals in Colorado Springs? This section highlights key areas, outlining why they are attractive for hosts and guests, along with notable local attractions. Consider these locations based on your target guest profile and investment strategy.
| Neighborhood / Area | Why Host Here? (Target Guests & Appeal) | Key Attractions & Landmarks |
|---|---|---|
| Downtown Colorado Springs | Vibrant urban center that attracts both tourists and business travelers, known for its eclectic dining, arts scene, and proximity to major attractions. | ProRodeo Hall of Fame, Colorado Springs Pioneers Museum, Glen Eyrie Castle, Acacia Park, Cameo Theater |
| Garden of the Gods | Iconic landmark with stunning red rock formations that attract outdoor enthusiasts and nature lovers. Great for hikers and photographers. | Garden of the Gods Park, Balanced Rock, Siamese Twins Trail, Kissing Camels, Visitor Center |
| Old Colorado City | Historic district that offers a charming small-town vibe with unique shops, art galleries, and dining options. Rich in history and culture. | Old Colorado City Historic District, Sims Park, Manitou Incline, Pikes Peak Brewing Company, Colorado Avenue |
| Cheyenne Mountain State Park | Perfect for nature lovers and families, this area offers hiking, wildlife viewing, and outdoor activities, making it a great retreat. | Cheyenne Mountain State Park, Scenic views of the mountains, Hiking trails, Nature Center, Camping areas |
| Manitou Springs | Quaint mountain town known for its natural mineral springs and unique shops, popular with tourists exploring Pikes Peak. | Manitou Incline, Pikes Peak Cog Railway, Natural Springs, Manitou Art Center, Garden of the Gods |
| North End | Residential area that appeals to families and long-term visitors, known for its parks and proximity to schools, shopping, and dining. | Monument Valley Park, Nancy Lewis Park, Shopping centers, Local restaurants, Woodland Park Zoo |
| Cascades Avenue | Scenic neighborhood near the base of the mountains, ideal for those seeking a peaceful retreat with easy access to outdoor activities. | Pikes Peak, Cascades Park, Hiking trails, Scenic views, Quiet suburban feel |
| Briargate | Family-friendly suburban area with excellent schools and amenities, popular for long-term rentals and people relocating to Colorado Springs. | Parks, Shopping centers, Schools, Community activities, Woodland Park |
Understanding Airbnb License Requirements & STR Laws in Colorado Springs (2026)
While Colorado Springs, Colorado, United States currently shows low STR regulations, specific Airbnb license requirements might still exist or change. Always verify the latest short term rental regulations and Airbnb license requirements directly with local government authorities for Colorado Springs to ensure full compliance before hosting.
(Source: AirROI data, 2026, based on 0% licensed listings)
Top Performing Airbnb Properties in Colorado Springs (2026)
Benchmark your potential! Explore examples of top-performing Airbnb properties in Colorado Springsbased on Trailing Twelve Month (TTM) revenue. Analyze their characteristics, revenue, occupancy rate, and ADR to understand what drives success in this market.

6k sq/ft! Views, Pool, Hot Tub, Game Room, Theatre
Entire Place • 8 bedrooms
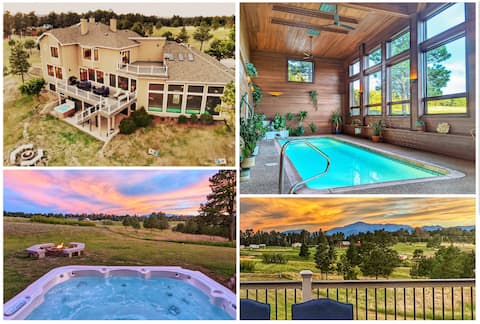
LuxMansion/HeatedIndoorPool/Spa/PikePkViews/Theatr
Entire Place • 6 bedrooms

Pikes views,Hikes, Views,Hot tub, Gaming Basement
Entire Place • 4 bedrooms
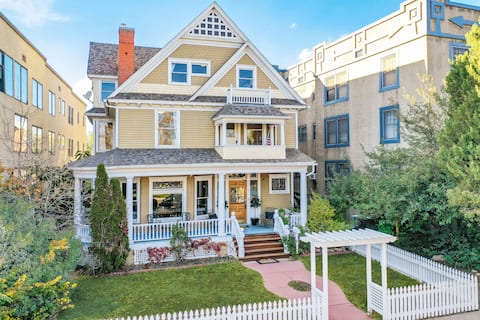
Crescent Estate! Mtn Views, Walk DT, Golf, Hot Tub
Entire Place • 8 bedrooms
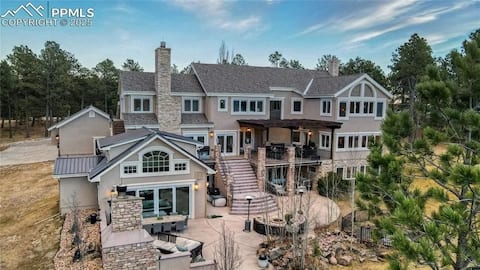
Colorado FarmHouse Retreat
Entire Place • 7 bedrooms

Pikes Estate! Holiday Home w Game Room! Sleeps 24!
Entire Place • 7 bedrooms
Note: Performance varies based on location, size, amenities, seasonality, and management quality. Data reflects the past 12 months.
Top Performing Airbnb Hosts in Colorado Springs (2026)
Learn from the best! This table showcases top-performing Airbnb hosts in Colorado Springs based on the number of properties managed and estimated total revenue over the past year. Analyze their scale and performance metrics.
| Host Name | Properties | Grossing Revenue | Stay Reviews | Avg Rating |
|---|---|---|---|---|
| Kaitlyn At Renjoy | 134 | $8,116,682 | 9708 | 4.76/5.0 |
| Jacquie | 48 | $2,960,495 | 15544 | 4.91/5.0 |
| Lloyd | 57 | $1,905,538 | 4661 | 4.78/5.0 |
| Philip | 39 | $1,771,818 | 1202 | 4.79/5.0 |
| Gabby | 23 | $1,685,192 | 5330 | 4.91/5.0 |
| Kayla | 10 | $1,232,792 | 682 | 4.93/5.0 |
| Evolve | 35 | $1,139,504 | 735 | 4.72/5.0 |
| Shelly | 22 | $968,767 | 2303 | 4.93/5.0 |
| Macario | 21 | $937,900 | 2128 | 4.70/5.0 |
| Adventure | 5 | $810,831 | 732 | 4.68/5.0 |
Analyzing the strategies of top hosts, such as their property selection, pricing, and guest communication, can offer valuable lessons for optimizing your own Airbnb operations in Colorado Springs.
Dive Deeper: Advanced Colorado Springs STR Market Data (2026)
Ready to unlock more insights? AirROI provides access to advanced metrics and comprehensive Airbnb data for Colorado Springs. Explore detailed analytics beyond this report to refine your investment strategy, optimize pricing, and maximize your vacation rental profits.
Explore Advanced MetricsColorado Springs Short-Term Rental Market Composition (2026): Property & Room Types
Room Type Distribution
Property Type Distribution
Market Composition Insights for Colorado Springs
- The Colorado Springs Airbnb market composition is heavily skewed towards Entire Home/Apt listings, which make up 88.3% of the 2,276 active rentals. This indicates strong guest preference for privacy and space.
- Looking at the property type distribution in Colorado Springs, House properties are the most common (70.8%), reflecting the local real estate landscape.
- Houses represent a significant 70.8% portion, catering likely to families or larger groups.
- Smaller segments like hotel/boutique, outdoor/unique, unique stays (combined 6.1%) offer potential for unique stay experiences.
Colorado Springs Airbnb Room Capacity Analysis (2026): Bedroom Distribution
Distribution of Listings by Number of Bedrooms
Room Capacity Insights for Colorado Springs
- The dominant room capacity in Colorado Springs is 2 bedrooms listings, making up 26.8% of the market. This suggests a strong demand for properties suitable for couples or solo travelers.
- Together, 2 bedrooms and 1 bedroom properties represent 48.8% of the active Airbnb listings in Colorado Springs, indicating a high concentration in these sizes.
- A significant 40.5% of listings offer 3+ bedrooms, catering to larger groups and families seeking more space in Colorado Springs.
Colorado Springs Vacation Rental Guest Capacity Trends (2026)
Distribution of Listings by Guest Capacity
Guest Capacity Insights for Colorado Springs
- The most common guest capacity trend in Colorado Springs vacation rentals is listings accommodating 8+ guests (28.5%). This suggests the primary traveler segment is likely larger groups.
- Properties designed for 8+ guests and 4 guests dominate the Colorado Springs STR market, accounting for 49.7% of listings.
- 47.1% of properties accommodate 6+ guests, serving the market segment for larger families or group travel in Colorado Springs.
- On average, properties in Colorado Springs are equipped to host 4.9 guests.
Colorado Springs Airbnb Booking Patterns (2026): Available vs. Booked Days
Available Days Distribution
Booked Days Distribution
Booking Pattern Insights for Colorado Springs
- The most common availability pattern in Colorado Springs falls within the 181-270 days range, representing 32.2% of listings. This suggests many properties have significant open periods on their calendars.
- Approximately 62.3% of listings show high availability (181+ days open annually), indicating potential for increased bookings or specific owner usage patterns.
- For booked days, the 91-180 days range is most frequent in Colorado Springs (32%), reflecting common guest stay durations or potential owner blocking patterns.
- A notable 39.1% of properties secure long booking periods (181+ days booked per year), highlighting successful long-term rental strategies or significant owner usage.
Colorado Springs Airbnb Minimum Stay Requirements Analysis
Distribution of Listings by Minimum Night Requirement
1 Night
474 listings
20.9% of total
2 Nights
614 listings
27% of total
3 Nights
108 listings
4.8% of total
4-6 Nights
69 listings
3% of total
7-29 Nights
175 listings
7.7% of total
30+ Nights
833 listings
36.6% of total
Key Insights
- The most prevalent minimum stay requirement in Colorado Springs is 30+ Nights, adopted by 36.6% of listings. This highlights the market's preference for longer commitments.
- A significant segment (36.6%) caters to monthly stays (30+ nights) in Colorado Springs, pointing to opportunities in the extended-stay market.
Recommendations
- Align with the market by considering a 30+ Nights minimum stay, as 36.6% of Colorado Springs hosts use this setting.
- If feasible, allowing 1-night stays, especially midweek or during low season, could capture last-minute bookings, as only 20.9% currently do.
- Explore offering discounts for stays of 30+ nights to attract the 36.6% of the market seeking extended stays.
- Adjust minimum nights based on seasonality – potentially shorter during low season and longer during peak demand periods in Colorado Springs.
Colorado Springs Airbnb Cancellation Policy Trends Analysis (2026)
Super Strict 30 Days
29 listings
1.3% of total
Limited
39 listings
1.7% of total
Super Strict 60 Days
8 listings
0.4% of total
Flexible
508 listings
22.4% of total
Moderate
695 listings
30.6% of total
Firm
713 listings
31.4% of total
Strict
278 listings
12.2% of total
Cancellation Policy Insights for Colorado Springs
- The prevailing Airbnb cancellation policy trend in Colorado Springs is Firm, used by 31.4% of listings.
- There's a relatively balanced mix between guest-friendly (53.0%) and stricter (43.6%) policies, offering choices for different guest needs.
Recommendations for Hosts
- Consider adopting a Firm policy to align with the 31.4% market standard in Colorado Springs.
- Using a Strict policy might deter some guests, as only 12.2% of listings use it. Evaluate if potential revenue protection outweighs possible lower booking rates.
- Regularly review your cancellation policy against competitors and market demand shifts in Colorado Springs.
Colorado Springs STR Booking Lead Time Analysis (2026)
Average Booking Lead Time by Month
Booking Lead Time Insights for Colorado Springs
- The overall average booking lead time for vacation rentals in Colorado Springs is 43 days.
- Guests book furthest in advance for stays during May (average 61 days), likely coinciding with peak travel demand or local events.
- The shortest booking windows occur for stays in February (average 24 days), indicating more last-minute travel plans during this time.
- Seasonally, Summer (55 days avg.) sees the longest lead times, while Winter (31 days avg.) has the shortest, reflecting typical travel planning cycles.
Recommendations for Hosts
- Use the overall average lead time (43 days) as a baseline for your pricing and availability strategy in Colorado Springs.
- For May stays, consider implementing length-of-stay discounts or slightly higher rates for bookings made less than 61 days out to capitalize on advance planning.
- Target marketing efforts for the Summer season well in advance (at least 55 days) to capture early planners.
- Monitor your own booking lead times against these Colorado Springs averages to identify opportunities for dynamic pricing adjustments.
Popular & Essential Airbnb Amenities in Colorado Springs (2026)
Amenity Prevalence
Amenity Insights for Colorado Springs
- Essential amenities in Colorado Springs that guests expect include: Wifi, Smoke alarm, Carbon monoxide alarm, TV, Heating, Hot water. Lacking these (any) could significantly impact bookings.
- Popular amenities like Dishes and silverware, Coffee maker, Free parking on premises are common but not universal. Offering these can provide a competitive edge.
Recommendations for Hosts
- Ensure your listing includes all essential amenities for Colorado Springs: Wifi, Smoke alarm, Carbon monoxide alarm, TV, Heating, Hot water.
- Prioritize adding missing essentials: Wifi, Smoke alarm, Carbon monoxide alarm, TV, Heating, Hot water.
- Consider adding popular differentiators like Dishes and silverware or Coffee maker to increase appeal.
- Highlight unique or less common amenities you offer (e.g., hot tub, dedicated workspace, EV charger) in your listing description and photos.
- Regularly check competitor amenities in Colorado Springs to stay competitive.
Colorado Springs Airbnb Guest Demographics & Profile Analysis (2026)
Guest Profile Summary for Colorado Springs
- The typical guest profile for Airbnb in Colorado Springs consists of primarily domestic travelers (96%), often arriving from nearby Denver, typically belonging to the Post-2000s (Gen Z/Alpha) group (50%), primarily speaking English or Spanish.
- Domestic travelers account for 96.2% of guests.
- Key international markets include United States (96.2%) and United Kingdom (0.6%).
- Top languages spoken are English (72.8%) followed by Spanish (13.6%).
- A significant demographic segment is the Post-2000s (Gen Z/Alpha) group, representing 50% of guests.
Recommendations for Hosts
- Target domestic marketing efforts towards travelers from Denver and Colorado Springs.
- Tailor amenities and listing descriptions to appeal to the dominant Post-2000s (Gen Z/Alpha) demographic (e.g., highlight fast WiFi, smart home features, local guides).
- Highlight unique local experiences or amenities relevant to the primary guest profile.
- Consider seasonal promotions aligned with peak travel times for key origin markets.
Nearby Short-Term Rental Market Comparison
How does the Colorado Springs Airbnb market stack up against its neighbors? Compare key performance metrics like average monthly revenue, ADR, and occupancy rates in surrounding areas to understand the broader regional STR landscape.
| Market | Active Properties | Monthly Revenue | Daily Rate | Avg. Occupancy |
|---|---|---|---|---|
| Aspen Park | 11 | $5,825 | $395.00 | 54% |
| Indian Hills | 11 | $5,799 | $333.03 | 54% |
| Black Hawk | 133 | $4,884 | $328.37 | 52% |
| Central City | 10 | $4,789 | $318.09 | 52% |
| Bailey | 126 | $4,611 | $310.32 | 53% |
| Cascade-Chipita Park | 103 | $4,541 | $330.50 | 52% |
| Woodmoor | 43 | $4,444 | $335.63 | 46% |
| Applewood | 18 | $4,400 | $269.95 | 56% |
| Golden | 276 | $4,261 | $301.62 | 54% |
| Evergreen | 190 | $4,246 | $336.66 | 48% |