Cimarron Airbnb Market Analysis 2026: Short Term Rental Data & Vacation Rental Statistics in Colorado, United States
Is Airbnb profitable in Cimarron in 2026? Explore comprehensive Airbnb analytics for Cimarron, Colorado, United States to uncover income potential. This 2026 STR market report for Cimarron, based on AirROI data from February 2025 to January 2026, reveals key trends in the niche market of 27 active listings.
Whether you're considering an Airbnb investment in Cimarron, optimizing your existing vacation rental, or exploring rental arbitrage opportunities, understanding the Cimarron Airbnb data is crucial. Leveraging the low regulation environment is key to maximizing your short term rental income potential. Let's dive into the specifics.
Key Cimarron Airbnb Performance Metrics Overview
Monthly Airbnb Revenue Variations & Income Potential in Cimarron (2026)
Understanding the monthly revenue variations for Airbnb listings in Cimarron is key to maximizing your short term rental income potential. Seasonality significantly impacts earnings. Our analysis, based on data from the past 12 months, shows that the peak revenue month for STRs in Cimarron is typically July, while April often presents the lowest earnings, highlighting opportunities for strategic pricing adjustments during shoulder and low seasons. Explore the typical Airbnb income in Cimarron across different performance tiers:
- Best-in-class properties (Top 10%) achieve $5,414+ monthly, often utilizing dynamic pricing and superior guest experiences.
- Strong performing properties (Top 25%) earn $3,567 or more, indicating effective management and desirable locations/amenities.
- Typical properties (Median) generate around $1,607 per month, representing the average market performance.
- Entry-level properties (Bottom 25%) see earnings around $760, often with potential for optimization.
Average Monthly Airbnb Earnings Trend in Cimarron
Cimarron Airbnb Occupancy Rate Trends (2026)
Maximize your bookings by understanding the Cimarron STR occupancy trends. Seasonal demand shifts significantly influence how often properties are booked. Typically, Julysees the highest demand (peak season occupancy), while January experiences the lowest (low season). Effective strategies, like adjusting minimum stays or offering promotions, can boost occupancy during slower periods. Here's how different property tiers perform in Cimarron:
- Best-in-class properties (Top 10%) achieve 64%+ occupancy, indicating high desirability and potentially optimized availability.
- Strong performing properties (Top 25%) maintain 48% or higher occupancy, suggesting good market fit and guest satisfaction.
- Typical properties (Median) have an occupancy rate around 31%.
- Entry-level properties (Bottom 25%) average 17% occupancy, potentially facing higher vacancy.
Average Monthly Occupancy Rate Trend in Cimarron
Average Daily Rate (ADR) Airbnb Trends in Cimarron (2026)
Effective short term rental pricing strategy in Cimarron involves understanding monthly ADR fluctuations. The Average Daily Rate (ADR) for Airbnb in Cimarron typically peaks in December and dips lowest during March. Leveraging Airbnb dynamic pricing tools or strategies based on this seasonality can significantly boost revenue. Here's a look at the typical nightly rates achieved:
- Best-in-class properties (Top 10%) command rates of $324+ per night, often due to premium features or locations.
- Strong performing properties (Top 25%) achieve nightly rates of $249 or more.
- Typical properties (Median) charge around $169 per night.
- Entry-level properties (Bottom 25%) earn around $127 per night.
Average Daily Rate (ADR) Trend by Month in Cimarron
Get Live Cimarron Market Intelligence 👇

Explore Real-time Analytics
Airbnb Seasonality Analysis & Trends in Cimarron (2026)
Peak Season (July, October, June)
- Revenue averages $3,491 per month
- Occupancy rates average 52.7%
- Daily rates average $194
Shoulder Season
- Revenue averages $2,247 per month
- Occupancy maintains around 28.7%
- Daily rates hold near $200
Low Season (February, April, May)
- Revenue drops to average $1,312 per month
- Occupancy decreases to average 24.5%
- Daily rates adjust to average $176
Seasonality Insights for Cimarron
- The Airbnb seasonality in Cimarron shows highly seasonal trends requiring careful strategy. While the sections above show seasonal averages, it's also insightful to look at the extremes:
- During the high season, the absolute peak month showcases Cimarron's highest earning potential, with monthly revenues capable of climbing to $3,718, occupancy reaching a high of 57.2%, and ADRs peaking at $214.
- Conversely, the slowest single month of the year, typically falling within the low season, marks the market's lowest point. In this month, revenue might dip to $1,193, occupancy could drop to 17.5%, and ADRs may adjust down to $170.
- Understanding both the seasonal averages and these monthly peaks and troughs in revenue, occupancy, and ADR is crucial for maximizing your Airbnb profit potential in Cimarron.
Seasonal Strategies for Maximizing Profit
- Peak Season: Maximize revenue through premium pricing and potentially longer minimum stays. Ensure high availability.
- Low Season: Offer competitive pricing, special promotions (e.g., extended stay discounts), and flexible cancellation policies. Target off-season travelers like remote workers or budget-conscious guests.
- Shoulder Seasons: Implement dynamic pricing that balances peak and low rates. Target weekend travelers or specific events. Offer slightly more flexible terms than peak season.
- Regularly analyze your own performance against these Cimarron seasonality benchmarks and adjust your pricing and availability strategy accordingly.
Best Areas for Airbnb Investment in Cimarron (2026)
Exploring the top neighborhoods for short-term rentals in Cimarron? This section highlights key areas, outlining why they are attractive for hosts and guests, along with notable local attractions. Consider these locations based on your target guest profile and investment strategy.
| Neighborhood / Area | Why Host Here? (Target Guests & Appeal) | Key Attractions & Landmarks |
|---|---|---|
| Cimarron Canyon | A stunning natural area known for its breathtaking mountain views and outdoor recreational opportunities. Ideal for guests seeking a peaceful getaway close to nature. | Cimarron Canyon State Park, Fishing and hiking trails, Scenic overlooks, National Forest access, Wildlife watching |
| Telluride | A world-renowned ski resort town that attracts visitors year-round. Offers luxury accommodations and a vibrant arts scene, making it highly lucrative for Airbnb hosts. | Telluride Ski Resort, Telluride Mountain Village, Festival of the Arts, Ice Skating at Town Park, Bridal Veil Falls |
| Gunnison | A charming town close to outdoor activities, Gunnison is popular with travelers seeking adventure sports and wildlife viewing. | Gunnison National Park, Blue Mesa Reservoir, Crested Butte skiing, Hiking trails, Wildlife refuges |
| Lake City | Known for its stunning scenery and historical significance. A go-to spot for those looking to explore the San Juan Mountains. | Lake San Cristobal, Historic downtown, Silver Thread Scenic Byway, Hiking and camping sites, Outdoor festivals |
| Montrose | A gateway to several natural attractions in southwestern Colorado, Montrose offers great amenities and access to both urban and outdoor experiences. | Black Canyon of Gunnison National Park, Montrose Botanical Gardens, Ute Indian Museum, Summer music festivals, Blue Mesa Reservoir |
| Silverton | A historic mining town that presents unique opportunities for tourism and adventure activities, especially in the summer and winter months. | Silverton Narrow Gauge Railroad, Historic District, Animas River rafting, Mountain biking, Skiing at Silverton Mountain |
| Durango | A vibrant town with rich history and access to the Durango & Silverton Narrow Gauge Railroad, popular with families and adventure seekers. | Durango & Silverton Narrow Gauge Railroad, Historic downtown, Animas River Trail, Hiking and biking, Parks and outdoor venues |
| Ouray | Often referred to as the 'Switzerland of America', Ouray is famous for its hot springs and stunning alpine views, attracting tourists seeking relaxation. | Ouray Hot Springs Pool, Box Canyon Falls Park, Ice climbing park in winter, Mount Sneffels Wilderness, Historic downtown |
Understanding Airbnb License Requirements & STR Laws in Cimarron (2026)
While Cimarron, Colorado, United States currently shows low STR regulations, specific Airbnb license requirements might still exist or change. Always verify the latest short term rental regulations and Airbnb license requirements directly with local government authorities for Cimarron to ensure full compliance before hosting.
(Source: AirROI data, 2026, finding no licensed listings among those analyzed)
Top Performing Airbnb Properties in Cimarron (2026)
Benchmark your potential! Explore examples of top-performing Airbnb properties in Cimarronbased on Trailing Twelve Month (TTM) revenue. Analyze their characteristics, revenue, occupancy rate, and ADR to understand what drives success in this market.

Winter Wonderland!
Entire Place • 3 bedrooms
Timber Frame Mountain Getaway
Entire Place • 4 bedrooms
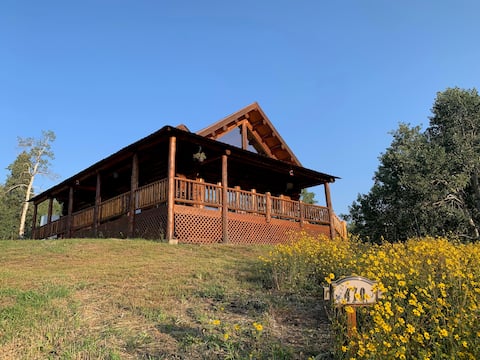
Authentic Log Cabin & Stunning SW Colorado Views
Entire Place • 2 bedrooms

Cozy Mountain Getaway
Entire Place • 4 bedrooms

Beautiful Mountain Log Cabin - Pets allowed
Entire Place • 2 bedrooms

Cabin Retreat! Great views, fire pit, & deck
Entire Place • 3 bedrooms
Note: Performance varies based on location, size, amenities, seasonality, and management quality. Data reflects the past 12 months.
Top Performing Airbnb Hosts in Cimarron (2026)
Learn from the best! This table showcases top-performing Airbnb hosts in Cimarron based on the number of properties managed and estimated total revenue over the past year. Analyze their scale and performance metrics.
| Host Name | Properties | Grossing Revenue | Stay Reviews | Avg Rating |
|---|---|---|---|---|
| Al | 1 | $59,142 | 18 | 5.00/5.0 |
| Madison | 1 | $50,638 | 75 | 4.96/5.0 |
| Donovan And Mae | 1 | $47,909 | 77 | 4.96/5.0 |
| Cami | 1 | $43,478 | 40 | 4.95/5.0 |
| Julie | 4 | $42,038 | 704 | 4.89/5.0 |
| Mike | 1 | $40,354 | 42 | 4.98/5.0 |
| Melanie | 1 | $33,719 | 31 | 5.00/5.0 |
| Jeffrey | 1 | $32,545 | 5 | 5.00/5.0 |
| Blake | 1 | $30,384 | 19 | 5.00/5.0 |
| Laura | 1 | $29,856 | 79 | 4.97/5.0 |
Analyzing the strategies of top hosts, such as their property selection, pricing, and guest communication, can offer valuable lessons for optimizing your own Airbnb operations in Cimarron.
Dive Deeper: Advanced Cimarron STR Market Data (2026)
Ready to unlock more insights? AirROI provides access to advanced metrics and comprehensive Airbnb data for Cimarron. Explore detailed analytics beyond this report to refine your investment strategy, optimize pricing, and maximize your vacation rental profits.
Explore Advanced MetricsCimarron Short-Term Rental Market Composition (2026): Property & Room Types
Room Type Distribution
Property Type Distribution
Market Composition Insights for Cimarron
- The Cimarron Airbnb market composition is heavily skewed towards Entire Home/Apt listings, which make up 100% of the 27 active rentals. This indicates strong guest preference for privacy and space.
- Looking at the property type distribution in Cimarron, Outdoor/Unique properties are the most common (92.6%), reflecting the local real estate landscape.
Cimarron Airbnb Room Capacity Analysis (2026): Bedroom Distribution
Distribution of Listings by Number of Bedrooms
Room Capacity Insights for Cimarron
- The dominant room capacity in Cimarron is 2 bedrooms listings, making up 29.6% of the market. This suggests a strong demand for properties suitable for couples or solo travelers.
- Together, 2 bedrooms and 1 bedroom properties represent 48.1% of the active Airbnb listings in Cimarron, indicating a high concentration in these sizes.
Cimarron Vacation Rental Guest Capacity Trends (2026)
Distribution of Listings by Guest Capacity
Guest Capacity Insights for Cimarron
- The most common guest capacity trend in Cimarron vacation rentals is listings accommodating 8+ guests (25.9%). This suggests the primary traveler segment is likely larger groups.
- Properties designed for 8+ guests and 4 guests dominate the Cimarron STR market, accounting for 51.8% of listings.
- 48.1% of properties accommodate 6+ guests, serving the market segment for larger families or group travel in Cimarron.
- On average, properties in Cimarron are equipped to host 5.3 guests.
Cimarron Airbnb Booking Patterns (2026): Available vs. Booked Days
Available Days Distribution
Booked Days Distribution
Booking Pattern Insights for Cimarron
- The most common availability pattern in Cimarron falls within the 271-366 days range, representing 63% of listings. This suggests many properties have significant open periods on their calendars.
- Approximately 92.6% of listings show high availability (181+ days open annually), indicating potential for increased bookings or specific owner usage patterns.
- For booked days, the 31-90 days range is most frequent in Cimarron (33.3%), reflecting common guest stay durations or potential owner blocking patterns.
- A notable 7.4% of properties secure long booking periods (181+ days booked per year), highlighting successful long-term rental strategies or significant owner usage.
Cimarron Airbnb Minimum Stay Requirements Analysis
Distribution of Listings by Minimum Night Requirement
1 Night
1 listings
3.7% of total
2 Nights
10 listings
37% of total
3 Nights
2 listings
7.4% of total
4-6 Nights
1 listings
3.7% of total
30+ Nights
13 listings
48.1% of total
Key Insights
- The most prevalent minimum stay requirement in Cimarron is 30+ Nights, adopted by 48.1% of listings. This highlights the market's preference for longer commitments.
- A significant segment (48.1%) caters to monthly stays (30+ nights) in Cimarron, pointing to opportunities in the extended-stay market.
Recommendations
- Align with the market by considering a 30+ Nights minimum stay, as 48.1% of Cimarron hosts use this setting.
- If feasible, allowing 1-night stays, especially midweek or during low season, could capture last-minute bookings, as only 3.7% currently do.
- A 2-night minimum appears standard (37%). Consider this for weekends or peak periods.
- Explore offering discounts for stays of 30+ nights to attract the 48.1% of the market seeking extended stays.
- Adjust minimum nights based on seasonality – potentially shorter during low season and longer during peak demand periods in Cimarron.
Cimarron Airbnb Cancellation Policy Trends Analysis (2026)
Flexible
4 listings
14.8% of total
Moderate
2 listings
7.4% of total
Firm
16 listings
59.3% of total
Strict
5 listings
18.5% of total
Cancellation Policy Insights for Cimarron
- The prevailing Airbnb cancellation policy trend in Cimarron is Firm, used by 59.3% of listings.
- A majority (77.8%) of hosts in Cimarron utilize Firm or Strict policies, indicating a market where hosts prioritize booking security.
Recommendations for Hosts
- Consider adopting a Firm policy to align with the 59.3% market standard in Cimarron.
- Regularly review your cancellation policy against competitors and market demand shifts in Cimarron.
Cimarron STR Booking Lead Time Analysis (2026)
Average Booking Lead Time by Month
Booking Lead Time Insights for Cimarron
- The overall average booking lead time for vacation rentals in Cimarron is 62 days.
- Guests book furthest in advance for stays during April (average 172 days), likely coinciding with peak travel demand or local events.
- The shortest booking windows occur for stays in January (average 14 days), indicating more last-minute travel plans during this time.
- Seasonally, Spring (95 days avg.) sees the longest lead times, while Winter (45 days avg.) has the shortest, reflecting typical travel planning cycles.
Recommendations for Hosts
- Use the overall average lead time (62 days) as a baseline for your pricing and availability strategy in Cimarron.
- For April stays, consider implementing length-of-stay discounts or slightly higher rates for bookings made less than 172 days out to capitalize on advance planning.
- During January, focus on last-minute booking availability and promotions, as guests book with very short notice (14 days avg.).
- Target marketing efforts for the Spring season well in advance (at least 95 days) to capture early planners.
- Monitor your own booking lead times against these Cimarron averages to identify opportunities for dynamic pricing adjustments.
Popular & Essential Airbnb Amenities in Cimarron (2026)
Amenity Prevalence
Amenity Insights for Cimarron
- Essential amenities in Cimarron that guests expect include: Free parking on premises. Lacking these (this) could significantly impact bookings.
- Popular amenities like Smoke alarm, Wifi, Hot water are common but not universal. Offering these can provide a competitive edge.
- Warning: Wifi is not universally provided but is considered essential globally. Ensure reliable Wifi is offered.
Recommendations for Hosts
- Ensure your listing includes all essential amenities for Cimarron: Free parking on premises.
- Consider adding popular differentiators like Smoke alarm or Wifi to increase appeal.
- Highlight unique or less common amenities you offer (e.g., hot tub, dedicated workspace, EV charger) in your listing description and photos.
- Regularly check competitor amenities in Cimarron to stay competitive.
Cimarron Airbnb Guest Demographics & Profile Analysis (2026)
Guest Profile Summary for Cimarron
- The typical guest profile for Airbnb in Cimarron consists of primarily domestic travelers (96%), often arriving from nearby Denver, typically belonging to the Post-2000s (Gen Z/Alpha) group (50%), primarily speaking English or Spanish.
- Domestic travelers account for 95.5% of guests.
- Key international markets include United States (95.5%) and United Kingdom (0.8%).
- Top languages spoken are English (73.2%) followed by Spanish (8.9%).
- A significant demographic segment is the Post-2000s (Gen Z/Alpha) group, representing 50% of guests.
Recommendations for Hosts
- Target domestic marketing efforts towards travelers from Denver and Colorado Springs.
- Tailor amenities and listing descriptions to appeal to the dominant Post-2000s (Gen Z/Alpha) demographic (e.g., highlight fast WiFi, smart home features, local guides).
- Highlight unique local experiences or amenities relevant to the primary guest profile.
- Consider seasonal promotions aligned with peak travel times for key origin markets.
Nearby Short-Term Rental Market Comparison
How does the Cimarron Airbnb market stack up against its neighbors? Compare key performance metrics like average monthly revenue, ADR, and occupancy rates in surrounding areas to understand the broader regional STR landscape.
| Market | Active Properties | Monthly Revenue | Daily Rate | Avg. Occupancy |
|---|---|---|---|---|
| Blue River | 201 | $7,203 | $609.20 | 45% |
| Aspen | 610 | $7,095 | $992.28 | 36% |
| Mountain Village | 334 | $6,874 | $1123.22 | 32% |
| Snowmass | 21 | $6,247 | $701.59 | 40% |
| El Jebel | 33 | $6,236 | $506.29 | 48% |
| Telluride | 608 | $5,198 | $662.92 | 38% |
| Glenwood Springs | 242 | $5,039 | $356.03 | 49% |
| Breckenridge | 3,051 | $4,995 | $544.32 | 40% |
| Crested Butte | 267 | $4,956 | $536.90 | 42% |
| Snowmass Village | 636 | $4,938 | $711.61 | 35% |