Cañon City Airbnb Market Analysis 2026: Short Term Rental Data & Vacation Rental Statistics in Colorado, United States
Is Airbnb profitable in Cañon City in 2026? Explore comprehensive Airbnb analytics for Cañon City, Colorado, United States to uncover income potential. This 2026 STR market report for Cañon City, based on AirROI data from February 2025 to January 2026, reveals key trends in the niche market of 156 active listings.
Whether you're considering an Airbnb investment in Cañon City, optimizing your existing vacation rental, or exploring rental arbitrage opportunities, understanding the Cañon City Airbnb data is crucial. Leveraging the low regulation environment is key to maximizing your short term rental income potential. Let's dive into the specifics.
Key Cañon City Airbnb Performance Metrics Overview
Monthly Airbnb Revenue Variations & Income Potential in Cañon City (2026)
Understanding the monthly revenue variations for Airbnb listings in Cañon City is key to maximizing your short term rental income potential. Seasonality significantly impacts earnings. Our analysis, based on data from the past 12 months, shows that the peak revenue month for STRs in Cañon City is typically July, while February often presents the lowest earnings, highlighting opportunities for strategic pricing adjustments during shoulder and low seasons. Explore the typical Airbnb income in Cañon City across different performance tiers:
- Best-in-class properties (Top 10%) achieve $4,745+ monthly, often utilizing dynamic pricing and superior guest experiences.
- Strong performing properties (Top 25%) earn $3,255 or more, indicating effective management and desirable locations/amenities.
- Typical properties (Median) generate around $2,026 per month, representing the average market performance.
- Entry-level properties (Bottom 25%) see earnings around $1,142, often with potential for optimization.
Average Monthly Airbnb Earnings Trend in Cañon City
Cañon City Airbnb Occupancy Rate Trends (2026)
Maximize your bookings by understanding the Cañon City STR occupancy trends. Seasonal demand shifts significantly influence how often properties are booked. Typically, Julysees the highest demand (peak season occupancy), while January experiences the lowest (low season). Effective strategies, like adjusting minimum stays or offering promotions, can boost occupancy during slower periods. Here's how different property tiers perform in Cañon City:
- Best-in-class properties (Top 10%) achieve 73%+ occupancy, indicating high desirability and potentially optimized availability.
- Strong performing properties (Top 25%) maintain 60% or higher occupancy, suggesting good market fit and guest satisfaction.
- Typical properties (Median) have an occupancy rate around 42%.
- Entry-level properties (Bottom 25%) average 22% occupancy, potentially facing higher vacancy.
Average Monthly Occupancy Rate Trend in Cañon City
Average Daily Rate (ADR) Airbnb Trends in Cañon City (2026)
Effective short term rental pricing strategy in Cañon City involves understanding monthly ADR fluctuations. The Average Daily Rate (ADR) for Airbnb in Cañon City typically peaks in September and dips lowest during February. Leveraging Airbnb dynamic pricing tools or strategies based on this seasonality can significantly boost revenue. Here's a look at the typical nightly rates achieved:
- Best-in-class properties (Top 10%) command rates of $338+ per night, often due to premium features or locations.
- Strong performing properties (Top 25%) achieve nightly rates of $230 or more.
- Typical properties (Median) charge around $155 per night.
- Entry-level properties (Bottom 25%) earn around $106 per night.
Average Daily Rate (ADR) Trend by Month in Cañon City
Get Live Cañon City Market Intelligence 👇

Explore Real-time Analytics
Airbnb Seasonality Analysis & Trends in Cañon City (2026)
Peak Season (July, June, August)
- Revenue averages $3,543 per month
- Occupancy rates average 52.4%
- Daily rates average $208
Shoulder Season
- Revenue averages $2,488 per month
- Occupancy maintains around 42.5%
- Daily rates hold near $200
Low Season (January, February, April)
- Revenue drops to average $1,554 per month
- Occupancy decreases to average 32.4%
- Daily rates adjust to average $185
Seasonality Insights for Cañon City
- The Airbnb seasonality in Cañon City shows highly seasonal trends requiring careful strategy. While the sections above show seasonal averages, it's also insightful to look at the extremes:
- During the high season, the absolute peak month showcases Cañon City's highest earning potential, with monthly revenues capable of climbing to $3,972, occupancy reaching a high of 56.5%, and ADRs peaking at $215.
- Conversely, the slowest single month of the year, typically falling within the low season, marks the market's lowest point. In this month, revenue might dip to $1,434, occupancy could drop to 25.4%, and ADRs may adjust down to $179.
- Understanding both the seasonal averages and these monthly peaks and troughs in revenue, occupancy, and ADR is crucial for maximizing your Airbnb profit potential in Cañon City.
Seasonal Strategies for Maximizing Profit
- Peak Season: Maximize revenue through premium pricing and potentially longer minimum stays. Ensure high availability.
- Low Season: Offer competitive pricing, special promotions (e.g., extended stay discounts), and flexible cancellation policies. Target off-season travelers like remote workers or budget-conscious guests.
- Shoulder Seasons: Implement dynamic pricing that balances peak and low rates. Target weekend travelers or specific events. Offer slightly more flexible terms than peak season.
- Regularly analyze your own performance against these Cañon City seasonality benchmarks and adjust your pricing and availability strategy accordingly.
Best Areas for Airbnb Investment in Cañon City (2026)
Exploring the top neighborhoods for short-term rentals in Cañon City? This section highlights key areas, outlining why they are attractive for hosts and guests, along with notable local attractions. Consider these locations based on your target guest profile and investment strategy.
| Neighborhood / Area | Why Host Here? (Target Guests & Appeal) | Key Attractions & Landmarks |
|---|---|---|
| Royal Gorge Bridge | This iconic bridge is one of the highest suspension bridges in the world, attracting thrill-seekers and nature lovers alike. Its stunning views and adventurous activities make it a prime spot for Airbnb hosts catering to tourists exploring the Gorge. | Royal Gorge Bridge, Royal Gorge Park, Zip Line Tours, Royal Gorge Route Railroad |
| Riverwalk Park | A picturesque area along the Arkansas River, perfect for relaxation and outdoor activities. The Riverwalk Park features beautiful trails and opportunities for fishing, making it a desirable stay for nature enthusiasts visiting Cañon City. | Riverwalk Trail, Fishing on the Arkansas River, Picnic Areas, Wildlife Viewing |
| Downtown Cañon City | The downtown area is rich in history and offers charming shops, restaurants, and cultural attractions. Staying in this area gives guests easy access to local eateries and community events throughout the year. | Royal Gorge Regional Museum and History Center, Old Penitentiary Museum, Cañon City’s Historic District, Local Shops and Restaurants |
| Garden Park Fossil Area | A unique destination for paleontology enthusiasts and families alike, this area is known for its rich fossil beds. Visitors can explore and enjoy educational tours, making it a great Airbnb location for families and adventure-seekers. | Fossil Tours, Scenic Hiking Trails, Wildlife Observation |
| Fremont County Fairgrounds | Known for hosting various local events and the annual fair, this area draws visitors year-round. Offering accommodations nearby can attract event attendees and families looking for convenience during their stay. | Fremont County Fair, Local Events, Outdoor Space |
| Red Canyon Park | A stunning natural park with red rock formations and trails, appealing to outdoor lovers and photographers. It offers a serene experience close to nature, making it perfect for Airbnb guests looking to unwind. | Hiking Trails, Wildlife Viewing, Photography Opportunities |
| Pawnee National Grassland | Although slightly further out, this expansive grassland attracts visitors interested in camping, hiking, and exploring the natural landscape unique to Colorado. It's a potential draw for Airbnb rentals offering rustic experiences. | Hiking and Picnic Areas, Wildlife Watching, Star Gazing |
| Arkansas Headwaters Recreation Area | A hotspot for water sports, fishing, and rafting on the Arkansas River. This area attracts adventure enthusiasts and families looking to enjoy summer activities, creating a high demand for nearby accommodations. | Rafting and Kayaking, Fishing, Picnicking, Biking Trails |
Understanding Airbnb License Requirements & STR Laws in Cañon City (2026)
While Cañon City, Colorado, United States currently shows low STR regulations, specific Airbnb license requirements might still exist or change. Always verify the latest short term rental regulations and Airbnb license requirements directly with local government authorities for Cañon City to ensure full compliance before hosting.
(Source: AirROI data, 2026, finding no licensed listings among those analyzed)
Top Performing Airbnb Properties in Cañon City (2026)
Benchmark your potential! Explore examples of top-performing Airbnb properties in Cañon Citybased on Trailing Twelve Month (TTM) revenue. Analyze their characteristics, revenue, occupancy rate, and ADR to understand what drives success in this market.
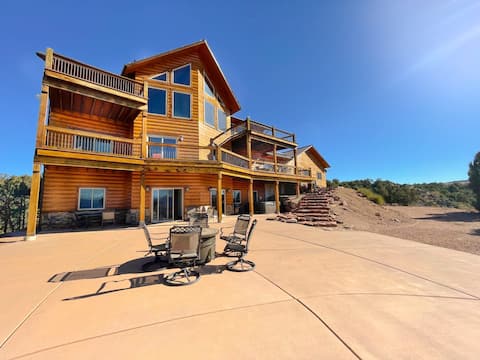
Valley Ranch
Entire Place • 6 bedrooms

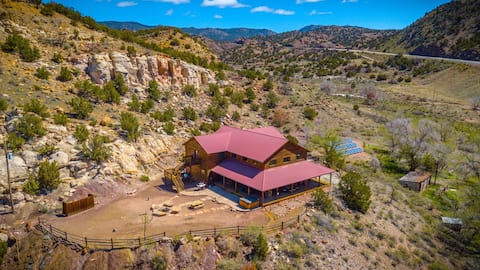
The ONLY lodging on the rim of the Royal Gorge
Entire Place • 3 bedrooms

Royal Gorge Retreat | Heated Pool & Spa, Sleeps 10
Entire Place • 4 bedrooms

The River View Retreat-Hot tub/5 minutes to train!
Entire Place • 4 bedrooms
River Ranch
Entire Place • 6 bedrooms

Classic Cañon City Getaway - 13 Mi to Royal Gorge!
Entire Place • 4 bedrooms
Note: Performance varies based on location, size, amenities, seasonality, and management quality. Data reflects the past 12 months.
Top Performing Airbnb Hosts in Cañon City (2026)
Learn from the best! This table showcases top-performing Airbnb hosts in Cañon City based on the number of properties managed and estimated total revenue over the past year. Analyze their scale and performance metrics.
| Host Name | Properties | Grossing Revenue | Stay Reviews | Avg Rating |
|---|---|---|---|---|
| James | 16 | $325,349 | 213 | 4.73/5.0 |
| Joshua | 8 | $269,230 | 463 | 4.92/5.0 |
| Evolve | 7 | $242,777 | 310 | 4.54/5.0 |
| Joanna | 7 | $194,176 | 465 | 4.98/5.0 |
| Kevin | 3 | $167,422 | 483 | 5.00/5.0 |
| Janae | 3 | $149,770 | 63 | 4.88/5.0 |
| Jerry Vernie | 1 | $110,614 | 340 | 4.95/5.0 |
| Brooke | 4 | $97,665 | 1284 | 4.91/5.0 |
| Adam | 4 | $86,107 | 175 | 4.91/5.0 |
| Katelynn | 1 | $82,567 | 69 | 4.99/5.0 |
Analyzing the strategies of top hosts, such as their property selection, pricing, and guest communication, can offer valuable lessons for optimizing your own Airbnb operations in Cañon City.
Dive Deeper: Advanced Cañon City STR Market Data (2026)
Ready to unlock more insights? AirROI provides access to advanced metrics and comprehensive Airbnb data for Cañon City. Explore detailed analytics beyond this report to refine your investment strategy, optimize pricing, and maximize your vacation rental profits.
Explore Advanced MetricsCañon City Short-Term Rental Market Composition (2026): Property & Room Types
Room Type Distribution
Property Type Distribution
Market Composition Insights for Cañon City
- The Cañon City Airbnb market composition is heavily skewed towards Entire Home/Apt listings, which make up 92.9% of the 156 active rentals. This indicates strong guest preference for privacy and space.
- Looking at the property type distribution in Cañon City, House properties are the most common (59.6%), reflecting the local real estate landscape.
- Houses represent a significant 59.6% portion, catering likely to families or larger groups.
- The presence of 5.1% Hotel/Boutique listings indicates integration with traditional hospitality.
Cañon City Airbnb Room Capacity Analysis (2026): Bedroom Distribution
Distribution of Listings by Number of Bedrooms
Room Capacity Insights for Cañon City
- The dominant room capacity in Cañon City is 1 bedroom listings, making up 30.1% of the market. This suggests a strong demand for properties suitable for couples or solo travelers.
- Together, 1 bedroom and 3 bedrooms properties represent 55.1% of the active Airbnb listings in Cañon City, indicating a high concentration in these sizes.
- A significant 37.2% of listings offer 3+ bedrooms, catering to larger groups and families seeking more space in Cañon City.
Cañon City Vacation Rental Guest Capacity Trends (2026)
Distribution of Listings by Guest Capacity
Guest Capacity Insights for Cañon City
- The most common guest capacity trend in Cañon City vacation rentals is listings accommodating 4 guests (32.1%). This suggests the primary traveler segment is likely small families or groups.
- Properties designed for 4 guests and 8+ guests dominate the Cañon City STR market, accounting for 56.5% of listings.
- 42.3% of properties accommodate 6+ guests, serving the market segment for larger families or group travel in Cañon City.
- On average, properties in Cañon City are equipped to host 5.0 guests.
Cañon City Airbnb Booking Patterns (2026): Available vs. Booked Days
Available Days Distribution
Booked Days Distribution
Booking Pattern Insights for Cañon City
- The most common availability pattern in Cañon City falls within the 271-366 days range, representing 40.4% of listings. This suggests many properties have significant open periods on their calendars.
- Approximately 75.0% of listings show high availability (181+ days open annually), indicating potential for increased bookings or specific owner usage patterns.
- For booked days, the 91-180 days range is most frequent in Cañon City (36.5%), reflecting common guest stay durations or potential owner blocking patterns.
- A notable 26.9% of properties secure long booking periods (181+ days booked per year), highlighting successful long-term rental strategies or significant owner usage.
Cañon City Airbnb Minimum Stay Requirements Analysis
Distribution of Listings by Minimum Night Requirement
1 Night
61 listings
39.1% of total
2 Nights
55 listings
35.3% of total
3 Nights
3 listings
1.9% of total
4-6 Nights
1 listings
0.6% of total
7-29 Nights
3 listings
1.9% of total
30+ Nights
33 listings
21.2% of total
Key Insights
- The most prevalent minimum stay requirement in Cañon City is 1 Night, adopted by 39.1% of listings. This highlights the market's preference for shorter, flexible bookings.
- A strong majority (74.4%) of the Cañon City Airbnb data shows acceptance of very short stays (1-2 nights), indicating a dynamic, high-turnover market.
- A significant segment (21.2%) caters to monthly stays (30+ nights) in Cañon City, pointing to opportunities in the extended-stay market.
Recommendations
- Align with the market by considering a 1 Night minimum stay, as 39.1% of Cañon City hosts use this setting.
- Explore offering discounts for stays of 30+ nights to attract the 21.2% of the market seeking extended stays.
- Adjust minimum nights based on seasonality – potentially shorter during low season and longer during peak demand periods in Cañon City.
Cañon City Airbnb Cancellation Policy Trends Analysis (2026)
Super Strict 30 Days
15 listings
9.6% of total
Limited
1 listings
0.6% of total
Flexible
24 listings
15.4% of total
Moderate
61 listings
39.1% of total
Firm
36 listings
23.1% of total
Strict
19 listings
12.2% of total
Cancellation Policy Insights for Cañon City
- The prevailing Airbnb cancellation policy trend in Cañon City is Moderate, used by 39.1% of listings.
- There's a relatively balanced mix between guest-friendly (54.5%) and stricter (35.3%) policies, offering choices for different guest needs.
Recommendations for Hosts
- Consider adopting a Moderate policy to align with the 39.1% market standard in Cañon City.
- Using a Strict policy might deter some guests, as only 12.2% of listings use it. Evaluate if potential revenue protection outweighs possible lower booking rates.
- Regularly review your cancellation policy against competitors and market demand shifts in Cañon City.
Cañon City STR Booking Lead Time Analysis (2026)
Average Booking Lead Time by Month
Booking Lead Time Insights for Cañon City
- The overall average booking lead time for vacation rentals in Cañon City is 47 days.
- Guests book furthest in advance for stays during May (average 62 days), likely coinciding with peak travel demand or local events.
- The shortest booking windows occur for stays in January (average 23 days), indicating more last-minute travel plans during this time.
- Seasonally, Summer (53 days avg.) sees the longest lead times, while Winter (31 days avg.) has the shortest, reflecting typical travel planning cycles.
Recommendations for Hosts
- Use the overall average lead time (47 days) as a baseline for your pricing and availability strategy in Cañon City.
- For May stays, consider implementing length-of-stay discounts or slightly higher rates for bookings made less than 62 days out to capitalize on advance planning.
- Target marketing efforts for the Summer season well in advance (at least 53 days) to capture early planners.
- Monitor your own booking lead times against these Cañon City averages to identify opportunities for dynamic pricing adjustments.
Popular & Essential Airbnb Amenities in Cañon City (2026)
Amenity Prevalence
Amenity Insights for Cañon City
- Essential amenities in Cañon City that guests expect include: Heating, Free parking on premises. Lacking these (any) could significantly impact bookings.
- Popular amenities like Smoke alarm, Fire extinguisher, Wifi are common but not universal. Offering these can provide a competitive edge.
- Warning: Wifi is not universally provided but is considered essential globally. Ensure reliable Wifi is offered.
Recommendations for Hosts
- Ensure your listing includes all essential amenities for Cañon City: Heating, Free parking on premises.
- Prioritize adding missing essentials: Heating, Free parking on premises.
- Consider adding popular differentiators like Smoke alarm or Fire extinguisher to increase appeal.
- Highlight unique or less common amenities you offer (e.g., hot tub, dedicated workspace, EV charger) in your listing description and photos.
- Regularly check competitor amenities in Cañon City to stay competitive.
Cañon City Airbnb Guest Demographics & Profile Analysis (2026)
Guest Profile Summary for Cañon City
- The typical guest profile for Airbnb in Cañon City consists of primarily domestic travelers (97%), often arriving from nearby Denver, typically belonging to the Post-2000s (Gen Z/Alpha) group (50%), primarily speaking English or Spanish.
- Domestic travelers account for 97.4% of guests.
- Key international markets include United States (97.4%) and United Kingdom (0.6%).
- Top languages spoken are English (75.7%) followed by Spanish (12.1%).
- A significant demographic segment is the Post-2000s (Gen Z/Alpha) group, representing 50% of guests.
Recommendations for Hosts
- Target domestic marketing efforts towards travelers from Denver and Colorado Springs.
- Tailor amenities and listing descriptions to appeal to the dominant Post-2000s (Gen Z/Alpha) demographic (e.g., highlight fast WiFi, smart home features, local guides).
- Highlight unique local experiences or amenities relevant to the primary guest profile.
- Consider seasonal promotions aligned with peak travel times for key origin markets.
Nearby Short-Term Rental Market Comparison
How does the Cañon City Airbnb market stack up against its neighbors? Compare key performance metrics like average monthly revenue, ADR, and occupancy rates in surrounding areas to understand the broader regional STR landscape.
| Market | Active Properties | Monthly Revenue | Daily Rate | Avg. Occupancy |
|---|---|---|---|---|
| Blue River | 201 | $7,203 | $609.20 | 45% |
| Aspen | 610 | $7,095 | $992.28 | 36% |
| Snowmass | 21 | $6,247 | $701.59 | 40% |
| Aspen Park | 11 | $5,825 | $395.00 | 54% |
| Indian Hills | 11 | $5,799 | $333.03 | 54% |
| Breckenridge | 3,051 | $4,995 | $544.32 | 40% |
| Crested Butte | 267 | $4,956 | $536.90 | 42% |
| Snowmass Village | 636 | $4,938 | $711.61 | 35% |
| Black Hawk | 133 | $4,884 | $328.37 | 52% |
| Beaver Creek | 522 | $4,818 | $901.27 | 30% |