Breckenridge Airbnb Market Analysis 2026: Short Term Rental Data & Vacation Rental Statistics in Colorado, United States
Is Airbnb profitable in Breckenridge in 2026? Explore comprehensive Airbnb analytics for Breckenridge, Colorado, United States to uncover income potential. This 2026 STR market report for Breckenridge, based on AirROI data from February 2025 to January 2026, reveals key trends in the bustling market of 3,051 active listings.
Whether you're considering an Airbnb investment in Breckenridge, optimizing your existing vacation rental, or exploring rental arbitrage opportunities, understanding the Breckenridge Airbnb data is crucial. Navigating the high regulation landscape is key to maximizing your short term rental income potential. Let's dive into the specifics.
Key Breckenridge Airbnb Performance Metrics Overview
Monthly Airbnb Revenue Variations & Income Potential in Breckenridge (2026)
Understanding the monthly revenue variations for Airbnb listings in Breckenridge is key to maximizing your short term rental income potential. Seasonality significantly impacts earnings. Our analysis, based on data from the past 12 months, shows that the peak revenue month for STRs in Breckenridge is typically March, while May often presents the lowest earnings, highlighting opportunities for strategic pricing adjustments during shoulder and low seasons. Explore the typical Airbnb income in Breckenridge across different performance tiers:
- Best-in-class properties (Top 10%) achieve $14,588+ monthly, often utilizing dynamic pricing and superior guest experiences.
- Strong performing properties (Top 25%) earn $8,747 or more, indicating effective management and desirable locations/amenities.
- Typical properties (Median) generate around $4,913 per month, representing the average market performance.
- Entry-level properties (Bottom 25%) see earnings around $2,596, often with potential for optimization.
Average Monthly Airbnb Earnings Trend in Breckenridge
Breckenridge Airbnb Occupancy Rate Trends (2026)
Maximize your bookings by understanding the Breckenridge STR occupancy trends. Seasonal demand shifts significantly influence how often properties are booked. Typically, Februarysees the highest demand (peak season occupancy), while May experiences the lowest (low season). Effective strategies, like adjusting minimum stays or offering promotions, can boost occupancy during slower periods. Here's how different property tiers perform in Breckenridge:
- Best-in-class properties (Top 10%) achieve 76%+ occupancy, indicating high desirability and potentially optimized availability.
- Strong performing properties (Top 25%) maintain 59% or higher occupancy, suggesting good market fit and guest satisfaction.
- Typical properties (Median) have an occupancy rate around 39%.
- Entry-level properties (Bottom 25%) average 20% occupancy, potentially facing higher vacancy.
Average Monthly Occupancy Rate Trend in Breckenridge
Average Daily Rate (ADR) Airbnb Trends in Breckenridge (2026)
Effective short term rental pricing strategy in Breckenridge involves understanding monthly ADR fluctuations. The Average Daily Rate (ADR) for Airbnb in Breckenridge typically peaks in December and dips lowest during May. Leveraging Airbnb dynamic pricing tools or strategies based on this seasonality can significantly boost revenue. Here's a look at the typical nightly rates achieved:
- Best-in-class properties (Top 10%) command rates of $1,007+ per night, often due to premium features or locations.
- Strong performing properties (Top 25%) achieve nightly rates of $643 or more.
- Typical properties (Median) charge around $409 per night.
- Entry-level properties (Bottom 25%) earn around $275 per night.
Average Daily Rate (ADR) Trend by Month in Breckenridge
Get Live Breckenridge Market Intelligence 👇

Explore Real-time Analytics
Airbnb Seasonality Analysis & Trends in Breckenridge (2026)
Peak Season (March, February, December)
- Revenue averages $12,106 per month
- Occupancy rates average 56.9%
- Daily rates average $689
Shoulder Season
- Revenue averages $6,004 per month
- Occupancy maintains around 39.0%
- Daily rates hold near $523
Low Season (April, May, October)
- Revenue drops to average $3,512 per month
- Occupancy decreases to average 29.6%
- Daily rates adjust to average $456
Seasonality Insights for Breckenridge
- The Airbnb seasonality in Breckenridge shows highly seasonal trends requiring careful strategy. While the sections above show seasonal averages, it's also insightful to look at the extremes:
- During the high season, the absolute peak month showcases Breckenridge's highest earning potential, with monthly revenues capable of climbing to $13,008, occupancy reaching a high of 64.9%, and ADRs peaking at $740.
- Conversely, the slowest single month of the year, typically falling within the low season, marks the market's lowest point. In this month, revenue might dip to $2,850, occupancy could drop to 25.3%, and ADRs may adjust down to $436.
- Understanding both the seasonal averages and these monthly peaks and troughs in revenue, occupancy, and ADR is crucial for maximizing your Airbnb profit potential in Breckenridge.
Seasonal Strategies for Maximizing Profit
- Peak Season: Maximize revenue through premium pricing and potentially longer minimum stays. Ensure high availability.
- Low Season: Offer competitive pricing, special promotions (e.g., extended stay discounts), and flexible cancellation policies. Target off-season travelers like remote workers or budget-conscious guests.
- Shoulder Seasons: Implement dynamic pricing that balances peak and low rates. Target weekend travelers or specific events. Offer slightly more flexible terms than peak season.
- Regularly analyze your own performance against these Breckenridge seasonality benchmarks and adjust your pricing and availability strategy accordingly.
Best Areas for Airbnb Investment in Breckenridge (2026)
Exploring the top neighborhoods for short-term rentals in Breckenridge? This section highlights key areas, outlining why they are attractive for hosts and guests, along with notable local attractions. Consider these locations based on your target guest profile and investment strategy.
| Neighborhood / Area | Why Host Here? (Target Guests & Appeal) | Key Attractions & Landmarks |
|---|---|---|
| Peak 8 | One of the most popular areas in Breckenridge, Peak 8 offers ski-in/ski-out access and is close to the Breckenridge Ski Resort. It's perfect for winter sports enthusiasts and summer hikers alike. | Breckenridge Ski Resort, Peak 8 Fun Park, Breckenridge Distillery, Cucumber Gulch Wildlife Preserve, Ski & Snowboard School at Breckenridge |
| Historic Main Street | The heart of Breckenridge, Historic Main Street is lined with charming shops, restaurants, and bars. It's ideal for those who want to experience the local culture and nightlife. | Main Street, Breckenridge Riverwalk Center, Breckenridge Arts District, Barney Ford House Museum, Norris B. Johnson Memorial Park |
| Breck Ski Resort Base | Being right at the base of the ski resort makes this area perfect for skiers and snowboarders, providing easy access to lifts and the slopes. | Quicksilver Super6 Lift, Ski and Ride School, Breckenridge Gondola, Epic Discovery, Maggie's Pond |
| Boreas Pass | This area offers a more secluded and serene experience, with stunning views and access to hiking trails, making it great for nature lovers. | Boreas Pass Road, Lake Aloha, Minnie Mine Trail, Blue Lake Trail, Hiking at Boreas Pass |
| Warrior's Mark | A family-friendly neighborhood that is close to the slopes and has a relaxed atmosphere, ideal for groups and families looking for spacious accommodations. | Ski-in/Ski-out access, Adjustable shuttle services, Hiking trails, Nature parks nearby |
| Silverthorne | Though a bit further from the center of Breckenridge, Silverthorne offers great mountain views and access to several outdoor activities, appealing to adventurers. | Dillon Reservoir, Silverthorne Performing Arts Center, Blue River Trail, Outlets at Silverthorne, Rainbow Park |
| Frisco | Frisco is a charming mountain town that provides access to several ski areas and has a vibrant community atmosphere with local events and activities. | Frisco Historic Park, Frisco Bay Marina, Summit County Historical Society, Frisco Adventure Park, Mountain Biking Trails |
| Breckenridge Northeast | This area offers a mix of residential and vacation rentals, showcasing natural beauty and proximity to both ski resorts and summer activities. | Breck Connect Gondola, Skiing and snowboarding, Hiking to Quandary Peak, Natural wildlife areas, Parks and open spaces |
Understanding Airbnb License Requirements & STR Laws in Breckenridge (2026)
Yes, Breckenridge, Colorado, United States enforces high STR regulations. Obtaining a license and ensuring compliance is almost certainly required according to current 2026 STR laws. Always verify the latest short term rental regulations and Airbnb license requirements directly with local government authorities for Breckenridge to ensure full compliance before hosting.
(Source: AirROI data, 2026, based on 53% licensed listings)
Top Performing Airbnb Properties in Breckenridge (2026)
Benchmark your potential! Explore examples of top-performing Airbnb properties in Breckenridgebased on Trailing Twelve Month (TTM) revenue. Analyze their characteristics, revenue, occupancy rate, and ADR to understand what drives success in this market.
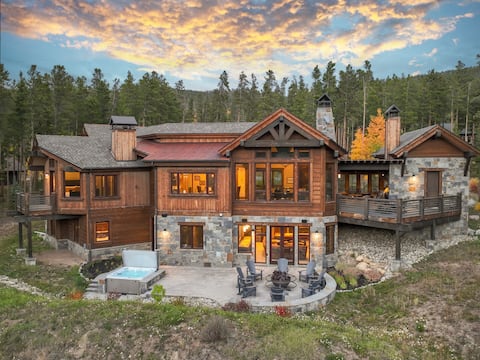
Entertaining Masterpiece, close to town, views!
Entire Place • 5 bedrooms
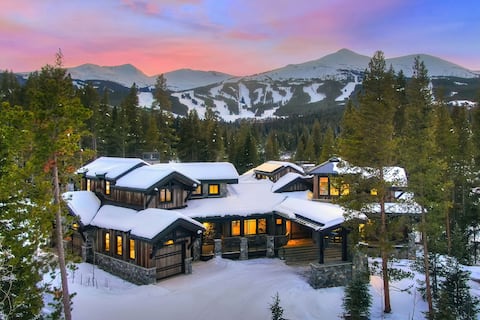
Mansion Mountain Gem: Nordic Ski-in/out Mansion
Entire Place • 6 bedrooms
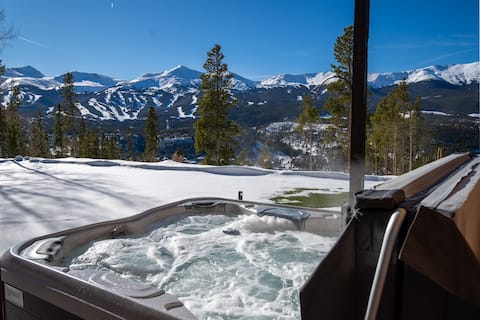
Luxury mountain home with stunning views, hot tub,
Entire Place • 8 bedrooms

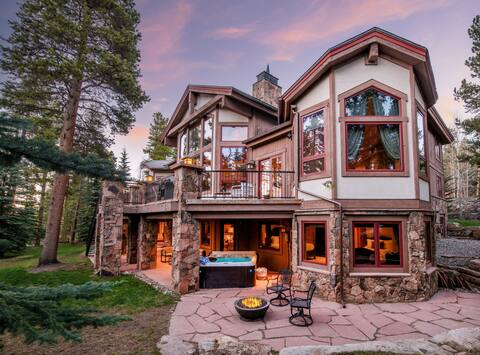
Hot Tub + Ski-in/Ski-out - Majestic Mountain Lodge
Entire Place • 7 bedrooms
Cherry Ridge by AvantStay | Mountain Mansion, View
Entire Place • 8 bedrooms

Walk town and parks, shuttle, hot tub, game room!
Entire Place • 5 bedrooms
Note: Performance varies based on location, size, amenities, seasonality, and management quality. Data reflects the past 12 months.
Top Performing Airbnb Hosts in Breckenridge (2026)
Learn from the best! This table showcases top-performing Airbnb hosts in Breckenridge based on the number of properties managed and estimated total revenue over the past year. Analyze their scale and performance metrics.
| Host Name | Properties | Grossing Revenue | Stay Reviews | Avg Rating |
|---|---|---|---|---|
| Summit Mountain Rentals | 217 | $12,360,541 | 2200 | 4.69/5.0 |
| VisitBreck | 137 | $11,481,510 | 1929 | 4.83/5.0 |
| Alpine Edge | 71 | $8,967,171 | 3860 | 4.88/5.0 |
| Great Western Lodging | 157 | $8,819,899 | 3672 | 4.58/5.0 |
| LocalVR Breckenridge | 117 | $7,553,488 | 10903 | 4.73/5.0 |
| Ski Country Resorts | 118 | $7,355,878 | 9024 | 4.66/5.0 |
| Evolve | 90 | $6,460,875 | 6379 | 4.79/5.0 |
| Summit Luxury Estates | 21 | $5,549,327 | 308 | 4.94/5.0 |
| Jesse | 59 | $5,127,280 | 3702 | 4.96/5.0 |
| Live Breck Property Management | 42 | $4,973,898 | 1280 | 4.95/5.0 |
Analyzing the strategies of top hosts, such as their property selection, pricing, and guest communication, can offer valuable lessons for optimizing your own Airbnb operations in Breckenridge.
Dive Deeper: Advanced Breckenridge STR Market Data (2026)
Ready to unlock more insights? AirROI provides access to advanced metrics and comprehensive Airbnb data for Breckenridge. Explore detailed analytics beyond this report to refine your investment strategy, optimize pricing, and maximize your vacation rental profits.
Explore Advanced MetricsBreckenridge Short-Term Rental Market Composition (2026): Property & Room Types
Room Type Distribution
Property Type Distribution
Market Composition Insights for Breckenridge
- The Breckenridge Airbnb market composition is heavily skewed towards Entire Home/Apt listings, which make up 97% of the 3,051 active rentals. This indicates strong guest preference for privacy and space.
- Looking at the property type distribution in Breckenridge, Apartment/Condo properties are the most common (58.3%), reflecting the local real estate landscape.
- Houses represent a significant 36.6% portion, catering likely to families or larger groups.
- Smaller segments like outdoor/unique, hotel/boutique, others (combined 5.0%) offer potential for unique stay experiences.
Breckenridge Airbnb Room Capacity Analysis (2026): Bedroom Distribution
Distribution of Listings by Number of Bedrooms
Room Capacity Insights for Breckenridge
- The dominant room capacity in Breckenridge is 2 bedrooms listings, making up 31.9% of the market. This suggests a strong demand for properties suitable for couples or solo travelers.
- Together, 2 bedrooms and 3 bedrooms properties represent 52.8% of the active Airbnb listings in Breckenridge, indicating a high concentration in these sizes.
- A significant 41.1% of listings offer 3+ bedrooms, catering to larger groups and families seeking more space in Breckenridge.
Breckenridge Vacation Rental Guest Capacity Trends (2026)
Distribution of Listings by Guest Capacity
Guest Capacity Insights for Breckenridge
- The most common guest capacity trend in Breckenridge vacation rentals is listings accommodating 8+ guests (47.1%). This suggests the primary traveler segment is likely larger groups.
- Properties designed for 8+ guests and 4 guests dominate the Breckenridge STR market, accounting for 69.6% of listings.
- 69.7% of properties accommodate 6+ guests, serving the market segment for larger families or group travel in Breckenridge.
- On average, properties in Breckenridge are equipped to host 6.3 guests.
Breckenridge Airbnb Booking Patterns (2026): Available vs. Booked Days
Available Days Distribution
Booked Days Distribution
Booking Pattern Insights for Breckenridge
- The most common availability pattern in Breckenridge falls within the 271-366 days range, representing 49.4% of listings. This suggests many properties have significant open periods on their calendars.
- Approximately 84.1% of listings show high availability (181+ days open annually), indicating potential for increased bookings or specific owner usage patterns.
- For booked days, the 91-180 days range is most frequent in Breckenridge (35.6%), reflecting common guest stay durations or potential owner blocking patterns.
- A notable 16.7% of properties secure long booking periods (181+ days booked per year), highlighting successful long-term rental strategies or significant owner usage.
Breckenridge Airbnb Minimum Stay Requirements Analysis
Distribution of Listings by Minimum Night Requirement
1 Night
214 listings
7% of total
2 Nights
589 listings
19.3% of total
3 Nights
212 listings
6.9% of total
4-6 Nights
173 listings
5.7% of total
7-29 Nights
39 listings
1.3% of total
30+ Nights
1824 listings
59.8% of total
Key Insights
- The most prevalent minimum stay requirement in Breckenridge is 30+ Nights, adopted by 59.8% of listings. This highlights the market's preference for longer commitments.
- A significant segment (59.8%) caters to monthly stays (30+ nights) in Breckenridge, pointing to opportunities in the extended-stay market.
Recommendations
- Align with the market by considering a 30+ Nights minimum stay, as 59.8% of Breckenridge hosts use this setting.
- If feasible, allowing 1-night stays, especially midweek or during low season, could capture last-minute bookings, as only 7% currently do.
- Explore offering discounts for stays of 30+ nights to attract the 59.8% of the market seeking extended stays.
- Adjust minimum nights based on seasonality – potentially shorter during low season and longer during peak demand periods in Breckenridge.
Breckenridge Airbnb Cancellation Policy Trends Analysis (2026)
Super Strict 60 Days
282 listings
9.3% of total
Limited
87 listings
2.9% of total
Non-refundable
8 listings
0.3% of total
Super Strict 30 Days
352 listings
11.5% of total
Refundable
6 listings
0.2% of total
Flexible
56 listings
1.8% of total
Moderate
329 listings
10.8% of total
Firm
1434 listings
47% of total
Strict
494 listings
16.2% of total
Cancellation Policy Insights for Breckenridge
- The prevailing Airbnb cancellation policy trend in Breckenridge is Firm, used by 47% of listings.
- A majority (63.2%) of hosts in Breckenridge utilize Firm or Strict policies, indicating a market where hosts prioritize booking security.
Recommendations for Hosts
- Consider adopting a Firm policy to align with the 47% market standard in Breckenridge.
- Regularly review your cancellation policy against competitors and market demand shifts in Breckenridge.
Breckenridge STR Booking Lead Time Analysis (2026)
Average Booking Lead Time by Month
Booking Lead Time Insights for Breckenridge
- The overall average booking lead time for vacation rentals in Breckenridge is 65 days.
- Guests book furthest in advance for stays during February (average 84 days), likely coinciding with peak travel demand or local events.
- The shortest booking windows occur for stays in May (average 40 days), indicating more last-minute travel plans during this time.
- Seasonally, Winter (77 days avg.) sees the longest lead times, while Fall (53 days avg.) has the shortest, reflecting typical travel planning cycles.
Recommendations for Hosts
- Use the overall average lead time (65 days) as a baseline for your pricing and availability strategy in Breckenridge.
- For February stays, consider implementing length-of-stay discounts or slightly higher rates for bookings made less than 84 days out to capitalize on advance planning.
- Target marketing efforts for the Winter season well in advance (at least 77 days) to capture early planners.
- Monitor your own booking lead times against these Breckenridge averages to identify opportunities for dynamic pricing adjustments.
Popular & Essential Airbnb Amenities in Breckenridge (2026)
Amenity Prevalence
Amenity Insights for Breckenridge
- Essential amenities in Breckenridge that guests expect include: Wifi, TV, Smoke alarm, Kitchen, Carbon monoxide alarm, Heating, Coffee maker. Lacking these (any) could significantly impact bookings.
- Popular amenities like Microwave, Dishes and silverware, Refrigerator are common but not universal. Offering these can provide a competitive edge.
Recommendations for Hosts
- Ensure your listing includes all essential amenities for Breckenridge: Wifi, TV, Smoke alarm, Kitchen, Carbon monoxide alarm, Heating, Coffee maker.
- Prioritize adding missing essentials: Wifi, TV, Smoke alarm, Kitchen, Carbon monoxide alarm, Heating, Coffee maker.
- Consider adding popular differentiators like Microwave or Dishes and silverware to increase appeal.
- Highlight unique or less common amenities you offer (e.g., hot tub, dedicated workspace, EV charger) in your listing description and photos.
- Regularly check competitor amenities in Breckenridge to stay competitive.
Breckenridge Airbnb Guest Demographics & Profile Analysis (2026)
Guest Profile Summary for Breckenridge
- The typical guest profile for Airbnb in Breckenridge consists of primarily domestic travelers (96%), often arriving from nearby Denver, typically belonging to the Post-2000s (Gen Z/Alpha) group (50%), primarily speaking English or Spanish.
- Domestic travelers account for 95.7% of guests.
- Key international markets include United States (95.7%) and Mexico (0.9%).
- Top languages spoken are English (71.3%) followed by Spanish (14.5%).
- A significant demographic segment is the Post-2000s (Gen Z/Alpha) group, representing 50% of guests.
Recommendations for Hosts
- Target domestic marketing efforts towards travelers from Denver and Colorado Springs.
- Tailor amenities and listing descriptions to appeal to the dominant Post-2000s (Gen Z/Alpha) demographic (e.g., highlight fast WiFi, smart home features, local guides).
- Highlight unique local experiences or amenities relevant to the primary guest profile.
- Consider seasonal promotions aligned with peak travel times for key origin markets.
Nearby Short-Term Rental Market Comparison
How does the Breckenridge Airbnb market stack up against its neighbors? Compare key performance metrics like average monthly revenue, ADR, and occupancy rates in surrounding areas to understand the broader regional STR landscape.
| Market | Active Properties | Monthly Revenue | Daily Rate | Avg. Occupancy |
|---|---|---|---|---|
| Blue River | 201 | $7,203 | $609.20 | 45% |
| Aspen | 610 | $7,095 | $992.28 | 36% |
| Snowmass | 21 | $6,247 | $701.59 | 40% |
| El Jebel | 33 | $6,236 | $506.29 | 48% |
| Aspen Park | 11 | $5,825 | $395.00 | 54% |
| Indian Hills | 11 | $5,799 | $333.03 | 54% |
| Grand County | 14 | $5,137 | $513.48 | 42% |
| Glenwood Springs | 242 | $5,039 | $356.03 | 49% |
| Crested Butte | 267 | $4,956 | $536.90 | 42% |
| Snowmass Village | 636 | $4,938 | $711.61 | 35% |