Beaver Creek Airbnb Market Analysis 2026: Short Term Rental Data & Vacation Rental Statistics in Colorado, United States
Is Airbnb profitable in Beaver Creek in 2026? Explore comprehensive Airbnb analytics for Beaver Creek, Colorado, United States to uncover income potential. This 2026 STR market report for Beaver Creek, based on AirROI data from February 2025 to January 2026, reveals key trends in the market of 522 active listings.
Whether you're considering an Airbnb investment in Beaver Creek, optimizing your existing vacation rental, or exploring rental arbitrage opportunities, understanding the Beaver Creek Airbnb data is crucial. Leveraging the low regulation environment is key to maximizing your short term rental income potential. Let's dive into the specifics.
Key Beaver Creek Airbnb Performance Metrics Overview
Monthly Airbnb Revenue Variations & Income Potential in Beaver Creek (2026)
Understanding the monthly revenue variations for Airbnb listings in Beaver Creek is key to maximizing your short term rental income potential. Seasonality significantly impacts earnings. Our analysis, based on data from the past 12 months, shows that the peak revenue month for STRs in Beaver Creek is typically March, while May often presents the lowest earnings, highlighting opportunities for strategic pricing adjustments during shoulder and low seasons. Explore the typical Airbnb income in Beaver Creek across different performance tiers:
- Best-in-class properties (Top 10%) achieve $16,629+ monthly, often utilizing dynamic pricing and superior guest experiences.
- Strong performing properties (Top 25%) earn $9,686 or more, indicating effective management and desirable locations/amenities.
- Typical properties (Median) generate around $5,277 per month, representing the average market performance.
- Entry-level properties (Bottom 25%) see earnings around $2,718, often with potential for optimization.
Average Monthly Airbnb Earnings Trend in Beaver Creek
Beaver Creek Airbnb Occupancy Rate Trends (2026)
Maximize your bookings by understanding the Beaver Creek STR occupancy trends. Seasonal demand shifts significantly influence how often properties are booked. Typically, Februarysees the highest demand (peak season occupancy), while October experiences the lowest (low season). Effective strategies, like adjusting minimum stays or offering promotions, can boost occupancy during slower periods. Here's how different property tiers perform in Beaver Creek:
- Best-in-class properties (Top 10%) achieve 58%+ occupancy, indicating high desirability and potentially optimized availability.
- Strong performing properties (Top 25%) maintain 40% or higher occupancy, suggesting good market fit and guest satisfaction.
- Typical properties (Median) have an occupancy rate around 24%.
- Entry-level properties (Bottom 25%) average 13% occupancy, potentially facing higher vacancy.
Average Monthly Occupancy Rate Trend in Beaver Creek
Average Daily Rate (ADR) Airbnb Trends in Beaver Creek (2026)
Effective short term rental pricing strategy in Beaver Creek involves understanding monthly ADR fluctuations. The Average Daily Rate (ADR) for Airbnb in Beaver Creek typically peaks in January and dips lowest during May. Leveraging Airbnb dynamic pricing tools or strategies based on this seasonality can significantly boost revenue. Here's a look at the typical nightly rates achieved:
- Best-in-class properties (Top 10%) command rates of $1,731+ per night, often due to premium features or locations.
- Strong performing properties (Top 25%) achieve nightly rates of $1,093 or more.
- Typical properties (Median) charge around $703 per night.
- Entry-level properties (Bottom 25%) earn around $478 per night.
Average Daily Rate (ADR) Trend by Month in Beaver Creek
Get Live Beaver Creek Market Intelligence 👇

Explore Real-time Analytics
Airbnb Seasonality Analysis & Trends in Beaver Creek (2026)
Peak Season (March, February, January)
- Revenue averages $14,577 per month
- Occupancy rates average 43.4%
- Daily rates average $1,200
Shoulder Season
- Revenue averages $6,166 per month
- Occupancy maintains around 26.7%
- Daily rates hold near $838
Low Season (May, June, October)
- Revenue drops to average $3,250 per month
- Occupancy decreases to average 19.7%
- Daily rates adjust to average $756
Seasonality Insights for Beaver Creek
- The Airbnb seasonality in Beaver Creek shows highly seasonal trends requiring careful strategy. While the sections above show seasonal averages, it's also insightful to look at the extremes:
- During the high season, the absolute peak month showcases Beaver Creek's highest earning potential, with monthly revenues capable of climbing to $17,029, occupancy reaching a high of 52.9%, and ADRs peaking at $1,294.
- Conversely, the slowest single month of the year, typically falling within the low season, marks the market's lowest point. In this month, revenue might dip to $2,789, occupancy could drop to 17.9%, and ADRs may adjust down to $748.
- Understanding both the seasonal averages and these monthly peaks and troughs in revenue, occupancy, and ADR is crucial for maximizing your Airbnb profit potential in Beaver Creek.
Seasonal Strategies for Maximizing Profit
- Peak Season: Maximize revenue through premium pricing and potentially longer minimum stays. Ensure high availability.
- Low Season: Offer competitive pricing, special promotions (e.g., extended stay discounts), and flexible cancellation policies. Target off-season travelers like remote workers or budget-conscious guests.
- Shoulder Seasons: Implement dynamic pricing that balances peak and low rates. Target weekend travelers or specific events. Offer slightly more flexible terms than peak season.
- Regularly analyze your own performance against these Beaver Creek seasonality benchmarks and adjust your pricing and availability strategy accordingly.
Best Areas for Airbnb Investment in Beaver Creek (2026)
Exploring the top neighborhoods for short-term rentals in Beaver Creek? This section highlights key areas, outlining why they are attractive for hosts and guests, along with notable local attractions. Consider these locations based on your target guest profile and investment strategy.
| Neighborhood / Area | Why Host Here? (Target Guests & Appeal) | Key Attractions & Landmarks |
|---|---|---|
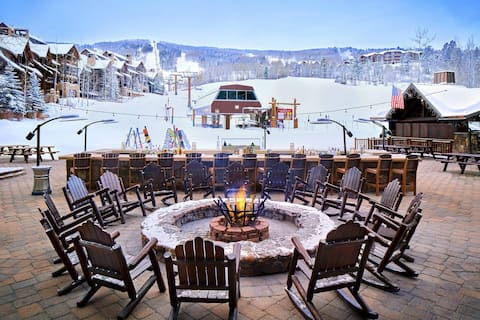
| Beaver Creek Village | The heart of Beaver Creek with upscale shops, dining, and ski access. A bustling area that attracts tourists year-round for its luxury amenities and instant access to outdoor activities. | Beaver Creek Plaza, Beaver Creek Ski Resort, Gourmet dining options, Ice skating rink, Vilar Performing Arts Center |
| Bachelor Gulch | A luxurious area known for its exquisite properties and secluded feel. This location is ideal for those looking for privacy and tranquility while being close to skiing and hiking. | Bachelor Gulch Lodge, Ski-in/Ski-out access, Mountain biking trails, Golf courses |
| Arrowhead | A picturesque area that offers a mix of privacy and community. Ideal for families and larger groups wanting a more home-like feel. | Arrowhead Alpine Club, Private slopes, Meadow Mountain |
| Avon | A vibrant town that serves as the gateway to Beaver Creek. Offers a variety of accommodations at different price points and extensive local amenities. | Minton's restaurant, Avon Recreation Center, Beaver Creek Ski Resort access, Lake Nottingham |
| Edwards | Close to Beaver Creek but offers a quieter, local atmosphere. Great for those seeking access to Beaver Creek with a more suburban feel. | Riverwalk at Edwards, Local shops and restaurants, Nearby hiking trails |
| Eagle-Vail | A residential area between Vail and Beaver Creek, known for its natural beauty and outdoor recreation. Appeals to those looking for a laid-back mountain lifestyle. | Eagle-Vail Golf Club, Skiing and snowboarding, Metro District Parks |
| Vail | Though not directly in Beaver Creek, Vail is known worldwide for its skiing and luxury resorts, making it an attractive option for Airbnb hosting. | Vail Ski Resort, Vail Village, The Betty Ford Alpine Gardens, Vail Farmers Market |
| Minturn | A lesser-known gem with authentic Colorado charm. Attracts those looking for a unique experience away from the hustle and bustle of tourist areas. | Minturn Market, Eagle River, Outdoor adventures |
Understanding Airbnb License Requirements & STR Laws in Beaver Creek (2026)
While Beaver Creek, Colorado, United States currently shows low STR regulations, specific Airbnb license requirements might still exist or change. Always verify the latest short term rental regulations and Airbnb license requirements directly with local government authorities for Beaver Creek to ensure full compliance before hosting.
(Source: AirROI data, 2026, based on 0% licensed listings)
Top Performing Airbnb Properties in Beaver Creek (2026)
Benchmark your potential! Explore examples of top-performing Airbnb properties in Beaver Creekbased on Trailing Twelve Month (TTM) revenue. Analyze their characteristics, revenue, occupancy rate, and ADR to understand what drives success in this market.

Ski in/out Private 2BDR in Ritz Bachelor Gulch
Entire Place • 2 bedrooms
Ski in/out Private 2BDR in Ritz Bachelor Gulch
Entire Place • 2 bedrooms

*New* Beaver Creek Holden road Ski-in Chalet
Entire Place • 6 bedrooms

Modern Resort-Style Living in Beaver Creek Village
Entire Place • 3 bedrooms

Beaver Creek Luxury 7-Bedroom Mountain Retreat
Entire Place • 7 bedrooms
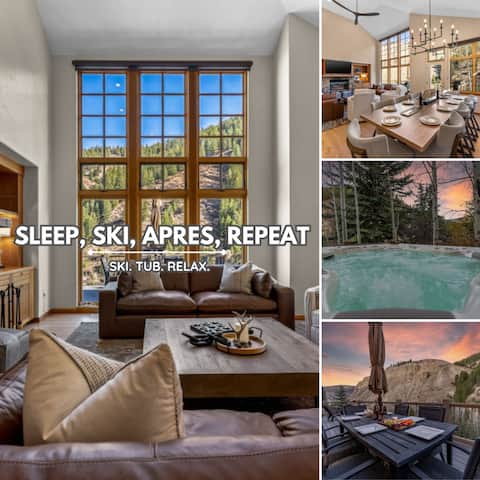
Spectacular views | Private Hot Tub | Sleeps 16
Entire Place • 5 bedrooms
Note: Performance varies based on location, size, amenities, seasonality, and management quality. Data reflects the past 12 months.
Top Performing Airbnb Hosts in Beaver Creek (2026)
Learn from the best! This table showcases top-performing Airbnb hosts in Beaver Creek based on the number of properties managed and estimated total revenue over the past year. Analyze their scale and performance metrics.
| Host Name | Properties | Grossing Revenue | Stay Reviews | Avg Rating |
|---|---|---|---|---|
| East West | 91 | $4,132,190 | 327 | 4.90/5.0 |
| ITrip | 34 | $2,376,078 | 557 | 4.80/5.0 |
| The Charter At Beaver Creek | 37 | $1,438,384 | 47 | 5.00/5.0 |
| Berkshire Hathaway HomeService | 25 | $1,197,682 | 149 | 4.80/5.0 |
| Evolve | 15 | $1,021,366 | 457 | 4.80/5.0 |
| The Borders Lodge | 14 | $869,689 | 33 | 5.00/5.0 |
| Moving Mountains | 10 | $798,645 | 20 | 5.00/5.0 |
| Remôtkey | 7 | $747,362 | 273 | 4.92/5.0 |
| St James | 11 | $678,657 | 17 | 4.50/5.0 |
| Atomic Stays | 3 | $610,930 | 80 | 4.94/5.0 |
Analyzing the strategies of top hosts, such as their property selection, pricing, and guest communication, can offer valuable lessons for optimizing your own Airbnb operations in Beaver Creek.
Dive Deeper: Advanced Beaver Creek STR Market Data (2026)
Ready to unlock more insights? AirROI provides access to advanced metrics and comprehensive Airbnb data for Beaver Creek. Explore detailed analytics beyond this report to refine your investment strategy, optimize pricing, and maximize your vacation rental profits.
Explore Advanced MetricsBeaver Creek Short-Term Rental Market Composition (2026): Property & Room Types
Room Type Distribution
Property Type Distribution
Market Composition Insights for Beaver Creek
- The Beaver Creek Airbnb market composition is heavily skewed towards Entire Home/Apt listings, which make up 96.9% of the 522 active rentals. This indicates strong guest preference for privacy and space.
- Looking at the property type distribution in Beaver Creek, Apartment/Condo properties are the most common (60.7%), reflecting the local real estate landscape.
- Houses represent a significant 36.6% portion, catering likely to families or larger groups.
- Smaller segments like hotel/boutique, others, unique stays (combined 2.7%) offer potential for unique stay experiences.
Beaver Creek Airbnb Room Capacity Analysis (2026): Bedroom Distribution
Distribution of Listings by Number of Bedrooms
Room Capacity Insights for Beaver Creek
- The dominant room capacity in Beaver Creek is 3 bedrooms listings, making up 29.7% of the market. This suggests a strong demand for properties suitable for families or small groups.
- Together, 3 bedrooms and 2 bedrooms properties represent 52.3% of the active Airbnb listings in Beaver Creek, indicating a high concentration in these sizes.
- A significant 60.5% of listings offer 3+ bedrooms, catering to larger groups and families seeking more space in Beaver Creek.
Beaver Creek Vacation Rental Guest Capacity Trends (2026)
Distribution of Listings by Guest Capacity
Guest Capacity Insights for Beaver Creek
- The most common guest capacity trend in Beaver Creek vacation rentals is listings accommodating 8+ guests (60.3%). This suggests the primary traveler segment is likely larger groups.
- Properties designed for 8+ guests and 6 guests dominate the Beaver Creek STR market, accounting for 77.7% of listings.
- 81.3% of properties accommodate 6+ guests, serving the market segment for larger families or group travel in Beaver Creek.
- On average, properties in Beaver Creek are equipped to host 6.8 guests.
Beaver Creek Airbnb Booking Patterns (2026): Available vs. Booked Days
Available Days Distribution
Booked Days Distribution
Booking Pattern Insights for Beaver Creek
- The most common availability pattern in Beaver Creek falls within the 271-366 days range, representing 79.3% of listings. This suggests many properties have significant open periods on their calendars.
- Approximately 96.5% of listings show high availability (181+ days open annually), indicating potential for increased bookings or specific owner usage patterns.
- For booked days, the 31-90 days range is most frequent in Beaver Creek (49.2%), reflecting common guest stay durations or potential owner blocking patterns.
- A notable 3.7% of properties secure long booking periods (181+ days booked per year), highlighting successful long-term rental strategies or significant owner usage.
Beaver Creek Airbnb Minimum Stay Requirements Analysis
Distribution of Listings by Minimum Night Requirement
1 Night
18 listings
3.4% of total
2 Nights
56 listings
10.7% of total
3 Nights
41 listings
7.9% of total
4-6 Nights
47 listings
9% of total
7-29 Nights
3 listings
0.6% of total
30+ Nights
357 listings
68.4% of total
Key Insights
- The most prevalent minimum stay requirement in Beaver Creek is 30+ Nights, adopted by 68.4% of listings. This highlights the market's preference for longer commitments.
- Very short stays (1-2 nights) are less common (14.1%), suggesting hosts prefer slightly longer bookings to optimize turnover.
- A significant segment (68.4%) caters to monthly stays (30+ nights) in Beaver Creek, pointing to opportunities in the extended-stay market.
Recommendations
- Align with the market by considering a 30+ Nights minimum stay, as 68.4% of Beaver Creek hosts use this setting.
- If feasible, allowing 1-night stays, especially midweek or during low season, could capture last-minute bookings, as only 3.4% currently do.
- Explore offering discounts for stays of 30+ nights to attract the 68.4% of the market seeking extended stays.
- Adjust minimum nights based on seasonality – potentially shorter during low season and longer during peak demand periods in Beaver Creek.
Beaver Creek Airbnb Cancellation Policy Trends Analysis (2026)
Limited
4 listings
0.8% of total
Refundable
5 listings
1% of total
Super Strict 30 Days
93 listings
17.8% of total
Super Strict 60 Days
161 listings
30.8% of total
Non-refundable
4 listings
0.8% of total
Flexible
6 listings
1.1% of total
Moderate
27 listings
5.2% of total
Firm
130 listings
24.9% of total
Strict
92 listings
17.6% of total
Cancellation Policy Insights for Beaver Creek
- The prevailing Airbnb cancellation policy trend in Beaver Creek is Super Strict 60 Days, used by 30.8% of listings.
- There's a relatively balanced mix between guest-friendly (6.3%) and stricter (42.5%) policies, offering choices for different guest needs.
Recommendations for Hosts
- Consider adopting a Super Strict 60 Days policy to align with the 30.8% market standard in Beaver Creek.
- Regularly review your cancellation policy against competitors and market demand shifts in Beaver Creek.
Beaver Creek STR Booking Lead Time Analysis (2026)
Average Booking Lead Time by Month
Booking Lead Time Insights for Beaver Creek
- The overall average booking lead time for vacation rentals in Beaver Creek is 86 days.
- Guests book furthest in advance for stays during January (average 112 days), likely coinciding with peak travel demand or local events.
- The shortest booking windows occur for stays in May (average 29 days), indicating more last-minute travel plans during this time.
- Seasonally, Winter (108 days avg.) sees the longest lead times, while Fall (57 days avg.) has the shortest, reflecting typical travel planning cycles.
Recommendations for Hosts
- Use the overall average lead time (86 days) as a baseline for your pricing and availability strategy in Beaver Creek.
- For January stays, consider implementing length-of-stay discounts or slightly higher rates for bookings made less than 112 days out to capitalize on advance planning.
- Target marketing efforts for the Winter season well in advance (at least 108 days) to capture early planners.
- Monitor your own booking lead times against these Beaver Creek averages to identify opportunities for dynamic pricing adjustments.
Popular & Essential Airbnb Amenities in Beaver Creek (2026)
Amenity Prevalence
Amenity Insights for Beaver Creek
- Essential amenities in Beaver Creek that guests expect include: Wifi, TV, Smoke alarm, Carbon monoxide alarm, Heating, Essentials. Lacking these (any) could significantly impact bookings.
- Popular amenities like Kitchen, Hair dryer, Coffee maker are common but not universal. Offering these can provide a competitive edge.
Recommendations for Hosts
- Ensure your listing includes all essential amenities for Beaver Creek: Wifi, TV, Smoke alarm, Carbon monoxide alarm, Heating, Essentials.
- Prioritize adding missing essentials: Wifi, TV, Smoke alarm, Carbon monoxide alarm, Heating, Essentials.
- Consider adding popular differentiators like Kitchen or Hair dryer to increase appeal.
- Highlight unique or less common amenities you offer (e.g., hot tub, dedicated workspace, EV charger) in your listing description and photos.
- Regularly check competitor amenities in Beaver Creek to stay competitive.
Beaver Creek Airbnb Guest Demographics & Profile Analysis (2026)
Guest Profile Summary for Beaver Creek
- The typical guest profile for Airbnb in Beaver Creek consists of primarily domestic travelers (93%), often arriving from nearby Denver, typically belonging to the Post-2000s (Gen Z/Alpha) group (50%), primarily speaking English or Spanish.
- Domestic travelers account for 93.3% of guests.
- Key international markets include United States (93.3%) and Mexico (2%).
- Top languages spoken are English (68.6%) followed by Spanish (15.1%).
- A significant demographic segment is the Post-2000s (Gen Z/Alpha) group, representing 50% of guests.
Recommendations for Hosts
- Target domestic marketing efforts towards travelers from Denver and New York.
- Tailor amenities and listing descriptions to appeal to the dominant Post-2000s (Gen Z/Alpha) demographic (e.g., highlight fast WiFi, smart home features, local guides).
- Highlight unique local experiences or amenities relevant to the primary guest profile.
- Consider seasonal promotions aligned with peak travel times for key origin markets.
Nearby Short-Term Rental Market Comparison
How does the Beaver Creek Airbnb market stack up against its neighbors? Compare key performance metrics like average monthly revenue, ADR, and occupancy rates in surrounding areas to understand the broader regional STR landscape.
| Market | Active Properties | Monthly Revenue | Daily Rate | Avg. Occupancy |
|---|---|---|---|---|
| Blue River | 201 | $7,203 | $609.20 | 45% |
| Aspen | 610 | $7,095 | $992.28 | 36% |
| Snowmass | 21 | $6,247 | $701.59 | 40% |
| El Jebel | 33 | $6,236 | $506.29 | 48% |
| Aspen Park | 11 | $5,825 | $395.00 | 54% |
| Indian Hills | 11 | $5,799 | $333.03 | 54% |
| Grand County | 14 | $5,137 | $513.48 | 42% |
| Glenwood Springs | 242 | $5,039 | $356.03 | 49% |
| Breckenridge | 3,051 | $4,995 | $544.32 | 40% |
| Crested Butte | 267 | $4,956 | $536.90 | 42% |