Bailey Airbnb Market Analysis 2026: Short Term Rental Data & Vacation Rental Statistics in Colorado, United States
Is Airbnb profitable in Bailey in 2026? Explore comprehensive Airbnb analytics for Bailey, Colorado, United States to uncover income potential. This 2026 STR market report for Bailey, based on AirROI data from February 2025 to January 2026, reveals key trends in the niche market of 126 active listings.
Whether you're considering an Airbnb investment in Bailey, optimizing your existing vacation rental, or exploring rental arbitrage opportunities, understanding the Bailey Airbnb data is crucial. Leveraging the low regulation environment is key to maximizing your short term rental income potential. Let's dive into the specifics.
Key Bailey Airbnb Performance Metrics Overview
Monthly Airbnb Revenue Variations & Income Potential in Bailey (2026)
Understanding the monthly revenue variations for Airbnb listings in Bailey is key to maximizing your short term rental income potential. Seasonality significantly impacts earnings. Our analysis, based on data from the past 12 months, shows that the peak revenue month for STRs in Bailey is typically July, while April often presents the lowest earnings, highlighting opportunities for strategic pricing adjustments during shoulder and low seasons. Explore the typical Airbnb income in Bailey across different performance tiers:
- Best-in-class properties (Top 10%) achieve $9,871+ monthly, often utilizing dynamic pricing and superior guest experiences.
- Strong performing properties (Top 25%) earn $7,350 or more, indicating effective management and desirable locations/amenities.
- Typical properties (Median) generate around $4,917 per month, representing the average market performance.
- Entry-level properties (Bottom 25%) see earnings around $2,892, often with potential for optimization.
Average Monthly Airbnb Earnings Trend in Bailey
Bailey Airbnb Occupancy Rate Trends (2026)
Maximize your bookings by understanding the Bailey STR occupancy trends. Seasonal demand shifts significantly influence how often properties are booked. Typically, Julysees the highest demand (peak season occupancy), while January experiences the lowest (low season). Effective strategies, like adjusting minimum stays or offering promotions, can boost occupancy during slower periods. Here's how different property tiers perform in Bailey:
- Best-in-class properties (Top 10%) achieve 85%+ occupancy, indicating high desirability and potentially optimized availability.
- Strong performing properties (Top 25%) maintain 73% or higher occupancy, suggesting good market fit and guest satisfaction.
- Typical properties (Median) have an occupancy rate around 57%.
- Entry-level properties (Bottom 25%) average 35% occupancy, potentially facing higher vacancy.
Average Monthly Occupancy Rate Trend in Bailey
Average Daily Rate (ADR) Airbnb Trends in Bailey (2026)
Effective short term rental pricing strategy in Bailey involves understanding monthly ADR fluctuations. The Average Daily Rate (ADR) for Airbnb in Bailey typically peaks in December and dips lowest during April. Leveraging Airbnb dynamic pricing tools or strategies based on this seasonality can significantly boost revenue. Here's a look at the typical nightly rates achieved:
- Best-in-class properties (Top 10%) command rates of $490+ per night, often due to premium features or locations.
- Strong performing properties (Top 25%) achieve nightly rates of $375 or more.
- Typical properties (Median) charge around $277 per night.
- Entry-level properties (Bottom 25%) earn around $198 per night.
Average Daily Rate (ADR) Trend by Month in Bailey
Get Live Bailey Market Intelligence 👇

Explore Real-time Analytics
Airbnb Seasonality Analysis & Trends in Bailey (2026)
Peak Season (July, December, August)
- Revenue averages $7,197 per month
- Occupancy rates average 62.2%
- Daily rates average $330
Shoulder Season
- Revenue averages $5,351 per month
- Occupancy maintains around 55.2%
- Daily rates hold near $307
Low Season (January, February, April)
- Revenue drops to average $3,765 per month
- Occupancy decreases to average 43.9%
- Daily rates adjust to average $276
Seasonality Insights for Bailey
- The Airbnb seasonality in Bailey shows highly seasonal trends requiring careful strategy. While the sections above show seasonal averages, it's also insightful to look at the extremes:
- During the high season, the absolute peak month showcases Bailey's highest earning potential, with monthly revenues capable of climbing to $7,973, occupancy reaching a high of 69.1%, and ADRs peaking at $376.
- Conversely, the slowest single month of the year, typically falling within the low season, marks the market's lowest point. In this month, revenue might dip to $3,267, occupancy could drop to 40.0%, and ADRs may adjust down to $252.
- Understanding both the seasonal averages and these monthly peaks and troughs in revenue, occupancy, and ADR is crucial for maximizing your Airbnb profit potential in Bailey.
Seasonal Strategies for Maximizing Profit
- Peak Season: Maximize revenue through premium pricing and potentially longer minimum stays. Ensure high availability.
- Low Season: Offer competitive pricing, special promotions (e.g., extended stay discounts), and flexible cancellation policies. Target off-season travelers like remote workers or budget-conscious guests.
- Shoulder Seasons: Implement dynamic pricing that balances peak and low rates. Target weekend travelers or specific events. Offer slightly more flexible terms than peak season.
- Regularly analyze your own performance against these Bailey seasonality benchmarks and adjust your pricing and availability strategy accordingly.
Best Areas for Airbnb Investment in Bailey (2026)
Exploring the top neighborhoods for short-term rentals in Bailey? This section highlights key areas, outlining why they are attractive for hosts and guests, along with notable local attractions. Consider these locations based on your target guest profile and investment strategy.
| Neighborhood / Area | Why Host Here? (Target Guests & Appeal) | Key Attractions & Landmarks |
|---|---|---|
| Bailey Lakes | A serene lakeside community that attracts nature lovers and families looking for a peaceful retreat. Great for summer vacations by the water. | Bailey Lakes, Hiking trails, Fishing opportunities, Local parks, Wildlife viewing |
| Pine Valley Ranch Park | Offers stunning natural scenery and outdoor recreational activities. Ideal for tourists looking to explore the beauty of the Colorado wilderness. | Pine Valley Ranch trails, Fishing in the creek, Camping sites, Wildflower viewing, Photography spots |
| Loch Lomond | A beautiful mountain lake located within the Colorado wilderness. Perfect for outdoor activities and getting away from the hustle of city life. | Loch Lomond lake, Hiking trails, Picnic areas, Wildlife observation, Stargazing opportunities |
| Buckskin Joe | A historical mining town turned tourist attraction, offering a glimpse into the Wild West era. Great for families and history buffs. | Buckskin Joe's Wild West, Gold panning, Historical exhibits, Guided tours, Staged shows |
| Mount Evans | Famous for its scenic drive and accessibility to high-altitude hikes. Attracts outdoor enthusiasts and adventure-seekers looking for breathtaking views. | Mount Evans Scenic Byway, Summit of Mount Evans, Hiking trails, Wildlife sightings, Photography vantage points |
| Kenosha Pass | Renowned for its beautiful fall colors and hiking trails. Ideal for travelers seeking picturesque views and fresh mountain air. | Kenosha Pass scenic overlook, Colorado Trail access, Wildflower hikes, Forest areas, Photography opportunities |
| St. Mary's Glacier | A stunning glacial lake and hiking area that's popular for outdoor activities year-round. Attracts hikers in summer and snowshoers in winter. | St. Mary's Glacier, Hiking routes, Snowshoeing paths, Scenic views, Wildlife observation |
| Conifer | Nearby mountain town with a charming atmosphere and local amenities. A convenient base for exploring the surrounding natural beauty of the area. | Conifer Town Center, Local dining and shopping, Hiking trails, Community events, Scenic drives |
Understanding Airbnb License Requirements & STR Laws in Bailey (2026)
While Bailey, Colorado, United States currently shows low STR regulations, specific Airbnb license requirements might still exist or change. Always verify the latest short term rental regulations and Airbnb license requirements directly with local government authorities for Bailey to ensure full compliance before hosting.
(Source: AirROI data, 2026, finding no licensed listings among those analyzed)
Top Performing Airbnb Properties in Bailey (2026)
Benchmark your potential! Explore examples of top-performing Airbnb properties in Baileybased on Trailing Twelve Month (TTM) revenue. Analyze their characteristics, revenue, occupancy rate, and ADR to understand what drives success in this market.
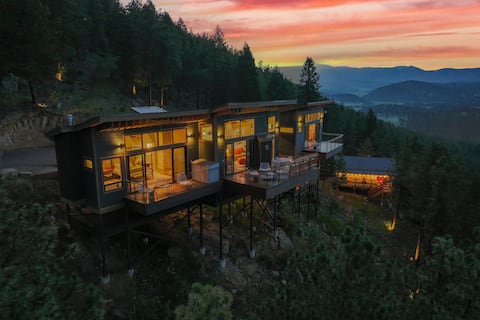
Luxury Treehouse + Glamping Tent - Views for Miles
Entire Place • 3 bedrooms

Summit Solace | LUXE 360° Views • Hot Tub • Games
Entire Place • 4 bedrooms
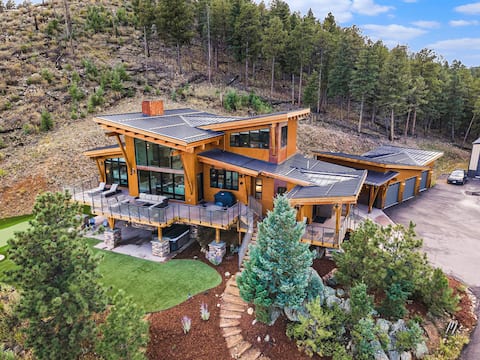
The Bailey Lodge • Private • Hot Tub • Patio+Views
Entire Place • 4 bedrooms

View Haus w/ Dome Theater & Yoga Studio + Hot Tub
Entire Place • 2 bedrooms

Stargazing Net | Hot Tub | Air Conditioning
Entire Place • 2 bedrooms

The Friendship Ranch | Mid-Century MTN A-Frame
Entire Place • 5 bedrooms
Note: Performance varies based on location, size, amenities, seasonality, and management quality. Data reflects the past 12 months.
Top Performing Airbnb Hosts in Bailey (2026)
Learn from the best! This table showcases top-performing Airbnb hosts in Bailey based on the number of properties managed and estimated total revenue over the past year. Analyze their scale and performance metrics.
| Host Name | Properties | Grossing Revenue | Stay Reviews | Avg Rating |
|---|---|---|---|---|
| AirSimplicity | 4 | $397,663 | 282 | 4.94/5.0 |
| Monica & Esteban | 2 | $234,276 | 216 | 4.93/5.0 |
| Peter | 1 | $184,344 | 174 | 4.99/5.0 |
| Melissa | 2 | $173,005 | 148 | 4.96/5.0 |
| MaryRuth | 7 | $165,601 | 218 | 4.99/5.0 |
| Sean | 3 | $162,869 | 104 | 4.99/5.0 |
| Kyle Andrew | 1 | $160,816 | 164 | 4.99/5.0 |
| Evolve | 3 | $144,827 | 86 | 4.77/5.0 |
| Seena And Kacia | 1 | $133,783 | 118 | 4.96/5.0 |
| Zachary | 2 | $132,363 | 339 | 4.84/5.0 |
Analyzing the strategies of top hosts, such as their property selection, pricing, and guest communication, can offer valuable lessons for optimizing your own Airbnb operations in Bailey.
Dive Deeper: Advanced Bailey STR Market Data (2026)
Ready to unlock more insights? AirROI provides access to advanced metrics and comprehensive Airbnb data for Bailey. Explore detailed analytics beyond this report to refine your investment strategy, optimize pricing, and maximize your vacation rental profits.
Explore Advanced MetricsBailey Short-Term Rental Market Composition (2026): Property & Room Types
Room Type Distribution
Property Type Distribution
Market Composition Insights for Bailey
- The Bailey Airbnb market composition is heavily skewed towards Entire Home/Apt listings, which make up 99.2% of the 126 active rentals. This indicates strong guest preference for privacy and space.
- Looking at the property type distribution in Bailey, Outdoor/Unique properties are the most common (50.8%), reflecting the local real estate landscape.
- Houses represent a significant 41.3% portion, catering likely to families or larger groups.
- Smaller segments like unique stays, apartment/condo, others, hotel/boutique (combined 8.0%) offer potential for unique stay experiences.
Bailey Airbnb Room Capacity Analysis (2026): Bedroom Distribution
Distribution of Listings by Number of Bedrooms
Room Capacity Insights for Bailey
- The dominant room capacity in Bailey is 3 bedrooms listings, making up 39.7% of the market. This suggests a strong demand for properties suitable for families or small groups.
- Together, 3 bedrooms and 2 bedrooms properties represent 66.7% of the active Airbnb listings in Bailey, indicating a high concentration in these sizes.
- A significant 59.6% of listings offer 3+ bedrooms, catering to larger groups and families seeking more space in Bailey.
Bailey Vacation Rental Guest Capacity Trends (2026)
Distribution of Listings by Guest Capacity
Guest Capacity Insights for Bailey
- The most common guest capacity trend in Bailey vacation rentals is listings accommodating 6 guests (36.5%). This suggests the primary traveler segment is likely larger groups.
- Properties designed for 6 guests and 8+ guests dominate the Bailey STR market, accounting for 61.9% of listings.
- 63.5% of properties accommodate 6+ guests, serving the market segment for larger families or group travel in Bailey.
- On average, properties in Bailey are equipped to host 5.7 guests.
Bailey Airbnb Booking Patterns (2026): Available vs. Booked Days
Available Days Distribution
Booked Days Distribution
Booking Pattern Insights for Bailey
- The most common availability pattern in Bailey falls within the 181-270 days range, representing 34.1% of listings. This suggests many properties have significant open periods on their calendars.
- Approximately 54.7% of listings show high availability (181+ days open annually), indicating potential for increased bookings or specific owner usage patterns.
- For booked days, the 181-270 days range is most frequent in Bailey (34.9%), reflecting common guest stay durations or potential owner blocking patterns.
- A notable 46.8% of properties secure long booking periods (181+ days booked per year), highlighting successful long-term rental strategies or significant owner usage.
Bailey Airbnb Minimum Stay Requirements Analysis
Distribution of Listings by Minimum Night Requirement
1 Night
17 listings
13.5% of total
2 Nights
57 listings
45.2% of total
3 Nights
5 listings
4% of total
4-6 Nights
1 listings
0.8% of total
7-29 Nights
1 listings
0.8% of total
30+ Nights
45 listings
35.7% of total
Key Insights
- The most prevalent minimum stay requirement in Bailey is 2 Nights, adopted by 45.2% of listings. This highlights the market's preference for shorter, flexible bookings.
- A significant segment (35.7%) caters to monthly stays (30+ nights) in Bailey, pointing to opportunities in the extended-stay market.
Recommendations
- Align with the market by considering a 2 Nights minimum stay, as 45.2% of Bailey hosts use this setting.
- If feasible, allowing 1-night stays, especially midweek or during low season, could capture last-minute bookings, as only 13.5% currently do.
- A 2-night minimum appears standard (45.2%). Consider this for weekends or peak periods.
- Explore offering discounts for stays of 30+ nights to attract the 35.7% of the market seeking extended stays.
- Adjust minimum nights based on seasonality – potentially shorter during low season and longer during peak demand periods in Bailey.
Bailey Airbnb Cancellation Policy Trends Analysis (2026)
Super Strict 30 Days
2 listings
1.6% of total
Super Strict 60 Days
1 listings
0.8% of total
Limited
10 listings
7.9% of total
Flexible
13 listings
10.3% of total
Moderate
38 listings
30.2% of total
Firm
50 listings
39.7% of total
Strict
12 listings
9.5% of total
Cancellation Policy Insights for Bailey
- The prevailing Airbnb cancellation policy trend in Bailey is Firm, used by 39.7% of listings.
- There's a relatively balanced mix between guest-friendly (40.5%) and stricter (49.2%) policies, offering choices for different guest needs.
- Strict cancellation policies are quite rare (9.5%), potentially making listings with this policy less competitive unless justified by high demand or property type.
Recommendations for Hosts
- Consider adopting a Firm policy to align with the 39.7% market standard in Bailey.
- Using a Strict policy might deter some guests, as only 9.5% of listings use it. Evaluate if potential revenue protection outweighs possible lower booking rates.
- Regularly review your cancellation policy against competitors and market demand shifts in Bailey.
Bailey STR Booking Lead Time Analysis (2026)
Average Booking Lead Time by Month
Booking Lead Time Insights for Bailey
- The overall average booking lead time for vacation rentals in Bailey is 60 days.
- Guests book furthest in advance for stays during August (average 74 days), likely coinciding with peak travel demand or local events.
- The shortest booking windows occur for stays in March (average 30 days), indicating more last-minute travel plans during this time.
- Seasonally, Summer (71 days avg.) sees the longest lead times, while Winter (38 days avg.) has the shortest, reflecting typical travel planning cycles.
Recommendations for Hosts
- Use the overall average lead time (60 days) as a baseline for your pricing and availability strategy in Bailey.
- For August stays, consider implementing length-of-stay discounts or slightly higher rates for bookings made less than 74 days out to capitalize on advance planning.
- Target marketing efforts for the Summer season well in advance (at least 71 days) to capture early planners.
- Monitor your own booking lead times against these Bailey averages to identify opportunities for dynamic pricing adjustments.
Popular & Essential Airbnb Amenities in Bailey (2026)
Amenity Prevalence
Amenity Insights for Bailey
- Essential amenities in Bailey that guests expect include: Smoke alarm, Heating, Carbon monoxide alarm, Free parking on premises. Lacking these (any) could significantly impact bookings.
- Popular amenities like Kitchen, Fire extinguisher, Coffee maker are common but not universal. Offering these can provide a competitive edge.
Recommendations for Hosts
- Ensure your listing includes all essential amenities for Bailey: Smoke alarm, Heating, Carbon monoxide alarm, Free parking on premises.
- Prioritize adding missing essentials: Smoke alarm, Heating, Carbon monoxide alarm, Free parking on premises.
- Consider adding popular differentiators like Kitchen or Fire extinguisher to increase appeal.
- Highlight unique or less common amenities you offer (e.g., hot tub, dedicated workspace, EV charger) in your listing description and photos.
- Regularly check competitor amenities in Bailey to stay competitive.
Bailey Airbnb Guest Demographics & Profile Analysis (2026)
Guest Profile Summary for Bailey
- The typical guest profile for Airbnb in Bailey consists of primarily domestic travelers (98%), often arriving from nearby Denver, typically belonging to the Post-2000s (Gen Z/Alpha) group (50%), primarily speaking English or Spanish.
- Domestic travelers account for 97.5% of guests.
- Key international markets include United States (97.5%) and DC (0.5%).
- Top languages spoken are English (73.5%) followed by Spanish (15%).
- A significant demographic segment is the Post-2000s (Gen Z/Alpha) group, representing 50% of guests.
Recommendations for Hosts
- Target domestic marketing efforts towards travelers from Denver and Austin.
- Tailor amenities and listing descriptions to appeal to the dominant Post-2000s (Gen Z/Alpha) demographic (e.g., highlight fast WiFi, smart home features, local guides).
- Highlight unique local experiences or amenities relevant to the primary guest profile.
- Consider seasonal promotions aligned with peak travel times for key origin markets.
Nearby Short-Term Rental Market Comparison
How does the Bailey Airbnb market stack up against its neighbors? Compare key performance metrics like average monthly revenue, ADR, and occupancy rates in surrounding areas to understand the broader regional STR landscape.
| Market | Active Properties | Monthly Revenue | Daily Rate | Avg. Occupancy |
|---|---|---|---|---|
| Blue River | 201 | $7,203 | $609.20 | 45% |
| Aspen | 610 | $7,095 | $992.28 | 36% |
| Snowmass | 21 | $6,247 | $701.59 | 40% |
| Aspen Park | 11 | $5,825 | $395.00 | 54% |
| Indian Hills | 11 | $5,799 | $333.03 | 54% |
| Grand County | 14 | $5,137 | $513.48 | 42% |
| Breckenridge | 3,051 | $4,995 | $544.32 | 40% |
| Crested Butte | 267 | $4,956 | $536.90 | 42% |
| Snowmass Village | 636 | $4,938 | $711.61 | 35% |
| Black Hawk | 133 | $4,884 | $328.37 | 52% |