Aurora Airbnb Market Analysis 2026: Short Term Rental Data & Vacation Rental Statistics in Colorado, United States
Is Airbnb profitable in Aurora in 2026? Explore comprehensive Airbnb analytics for Aurora, Colorado, United States to uncover income potential. This 2026 STR market report for Aurora, based on AirROI data from February 2025 to January 2026, reveals key trends in the market of 526 active listings.
Whether you're considering an Airbnb investment in Aurora, optimizing your existing vacation rental, or exploring rental arbitrage opportunities, understanding the Aurora Airbnb data is crucial. Navigating the high regulation landscape is key to maximizing your short term rental income potential. Let's dive into the specifics.
Key Aurora Airbnb Performance Metrics Overview
Monthly Airbnb Revenue Variations & Income Potential in Aurora (2026)
Understanding the monthly revenue variations for Airbnb listings in Aurora is key to maximizing your short term rental income potential. Seasonality significantly impacts earnings. Our analysis, based on data from the past 12 months, shows that the peak revenue month for STRs in Aurora is typically July, while January often presents the lowest earnings, highlighting opportunities for strategic pricing adjustments during shoulder and low seasons. Explore the typical Airbnb income in Aurora across different performance tiers:
- Best-in-class properties (Top 10%) achieve $4,907+ monthly, often utilizing dynamic pricing and superior guest experiences.
- Strong performing properties (Top 25%) earn $3,202 or more, indicating effective management and desirable locations/amenities.
- Typical properties (Median) generate around $1,733 per month, representing the average market performance.
- Entry-level properties (Bottom 25%) see earnings around $756, often with potential for optimization.
Average Monthly Airbnb Earnings Trend in Aurora
Aurora Airbnb Occupancy Rate Trends (2026)
Maximize your bookings by understanding the Aurora STR occupancy trends. Seasonal demand shifts significantly influence how often properties are booked. Typically, Junesees the highest demand (peak season occupancy), while January experiences the lowest (low season). Effective strategies, like adjusting minimum stays or offering promotions, can boost occupancy during slower periods. Here's how different property tiers perform in Aurora:
- Best-in-class properties (Top 10%) achieve 86%+ occupancy, indicating high desirability and potentially optimized availability.
- Strong performing properties (Top 25%) maintain 72% or higher occupancy, suggesting good market fit and guest satisfaction.
- Typical properties (Median) have an occupancy rate around 48%.
- Entry-level properties (Bottom 25%) average 23% occupancy, potentially facing higher vacancy.
Average Monthly Occupancy Rate Trend in Aurora
Average Daily Rate (ADR) Airbnb Trends in Aurora (2026)
Effective short term rental pricing strategy in Aurora involves understanding monthly ADR fluctuations. The Average Daily Rate (ADR) for Airbnb in Aurora typically peaks in December and dips lowest during April. Leveraging Airbnb dynamic pricing tools or strategies based on this seasonality can significantly boost revenue. Here's a look at the typical nightly rates achieved:
- Best-in-class properties (Top 10%) command rates of $261+ per night, often due to premium features or locations.
- Strong performing properties (Top 25%) achieve nightly rates of $174 or more.
- Typical properties (Median) charge around $104 per night.
- Entry-level properties (Bottom 25%) earn around $64 per night.
Average Daily Rate (ADR) Trend by Month in Aurora
Get Live Aurora Market Intelligence 👇

Explore Real-time Analytics
Airbnb Seasonality Analysis & Trends in Aurora (2026)
Peak Season (July, June, August)
- Revenue averages $2,913 per month
- Occupancy rates average 55.1%
- Daily rates average $143
Shoulder Season
- Revenue averages $2,287 per month
- Occupancy maintains around 46.3%
- Daily rates hold near $142
Low Season (January, February, April)
- Revenue drops to average $1,790 per month
- Occupancy decreases to average 43.2%
- Daily rates adjust to average $133
Seasonality Insights for Aurora
- The Airbnb seasonality in Aurora shows moderate seasonality with distinct peak and low periods. While the sections above show seasonal averages, it's also insightful to look at the extremes:
- During the high season, the absolute peak month showcases Aurora's highest earning potential, with monthly revenues capable of climbing to $3,136, occupancy reaching a high of 57.5%, and ADRs peaking at $149.
- Conversely, the slowest single month of the year, typically falling within the low season, marks the market's lowest point. In this month, revenue might dip to $1,748, occupancy could drop to 35.2%, and ADRs may adjust down to $127.
- Understanding both the seasonal averages and these monthly peaks and troughs in revenue, occupancy, and ADR is crucial for maximizing your Airbnb profit potential in Aurora.
Seasonal Strategies for Maximizing Profit
- Peak Season: Maximize revenue through premium pricing and potentially longer minimum stays. Ensure high availability.
- Low Season: Offer competitive pricing, special promotions (e.g., extended stay discounts), and flexible cancellation policies. Target off-season travelers like remote workers or budget-conscious guests.
- Shoulder Seasons: Implement dynamic pricing that balances peak and low rates. Target weekend travelers or specific events. Offer slightly more flexible terms than peak season.
- Regularly analyze your own performance against these Aurora seasonality benchmarks and adjust your pricing and availability strategy accordingly.
Best Areas for Airbnb Investment in Aurora (2026)
Exploring the top neighborhoods for short-term rentals in Aurora? This section highlights key areas, outlining why they are attractive for hosts and guests, along with notable local attractions. Consider these locations based on your target guest profile and investment strategy.
| Neighborhood / Area | Why Host Here? (Target Guests & Appeal) | Key Attractions & Landmarks |
|---|---|---|
| Southlands | A vibrant shopping and dining destination with a mix of outdoor and indoor experiences. It attracts families and visitors looking for entertainment, dining, and shopping options. | Southlands Lifestyle Center, Arts on Fire, Centennial Center Park, Wings Over the Rockies Air & Space Museum, E-470 Toll Road |
| Health Park | Known for its proximity to the major hospitals and medical facilities, attracting patients and visitors. It provides easy access to amenities and is ideal for longer stays due to the available services. | Centura Health Emergency Room, Aurora South Hospital, Medical Center of Aurora, Arapahoe Park, Cherry Creek State Park |
| Aurora Reservoir | A stunning outdoor destination for recreation and relaxation, offering scenic views, swimming, and hiking. Great for nature lovers and those seeking outdoor activities. | Aurora Reservoir, Cherry Creek Trail, Saddle Rock Golf Course, Sand Creek Regional Greenway, Usery Mountain Regional Park |
| Iliff Station | Developing area with access to public transportation and proximity to amenities, markets it as a convenient stay for visitors looking to explore the Denver-Aurora metro area. | Iliff Light Rail Station, Aurora Town Center, A-Town Pizza, Chick-fil-A, Lowry Park |
| Buckley Air Force Base | This area sees visits from military personnel and families. It's also close to various amenities, making it suitable for short-term stays. | Buckley Space Force Base, Buckley Family Housing, Buckley Fitness Center, Aurora History Museum, Rocky Mountain Arsenal National Wildlife Refuge |
| Tallyn's Reach | Offering a serene suburban lifestyle, it appeals to families and travelers looking for quiet neighborhoods with access to parks and schools. | Tallyn's Reach Park, Saddle Rock Golf Club, Southlands Mall, Springhill Park, Cherry Creek State Park |
| Columbine Park | A residential area that caters to families, it has parks, schools, and community amenities that attract longer-term visitors and families. | Columbine Park, Inverness Golf Course, Greenwood Village, Cherry Creek Reservoir, Hampden Heights Park |
| Sable Altura Chambers | A community featuring diverse amenities and local businesses, offering a mix of residential and commercial spaces attracting transient visitors. | Sable Altura Chambers Park, Aurora Central Library, James A. Bible Park, Aurora Hills Golf Course, Colorado National Monument |
Understanding Airbnb License Requirements & STR Laws in Aurora (2026)
Yes, Aurora, Colorado, United States enforces high STR regulations. Obtaining a license and ensuring compliance is almost certainly required according to current 2026 STR laws. Always verify the latest short term rental regulations and Airbnb license requirements directly with local government authorities for Aurora to ensure full compliance before hosting.
(Source: AirROI data, 2026, based on 72% licensed listings)
Top Performing Airbnb Properties in Aurora (2026)
Benchmark your potential! Explore examples of top-performing Airbnb properties in Aurorabased on Trailing Twelve Month (TTM) revenue. Analyze their characteristics, revenue, occupancy rate, and ADR to understand what drives success in this market.
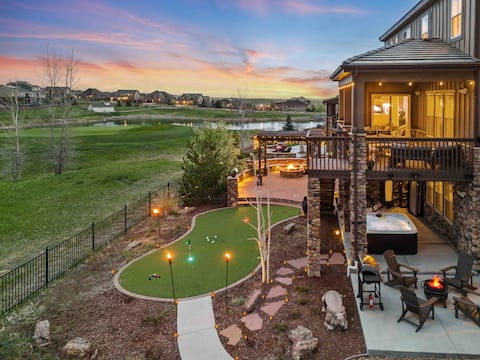
Mini-Golf Hot Tub FirePit on Golf Course Lake View
Entire Place • 7 bedrooms
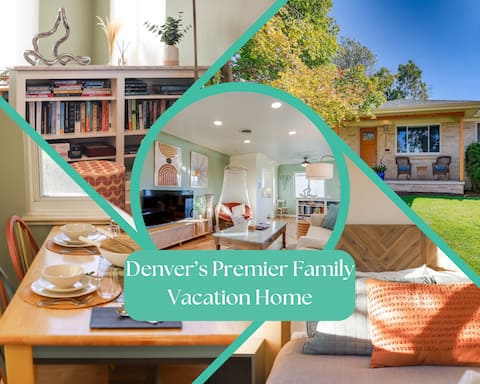
Well-Appointed | Family-Friendly Home base in DEN
Entire Place • 5 bedrooms

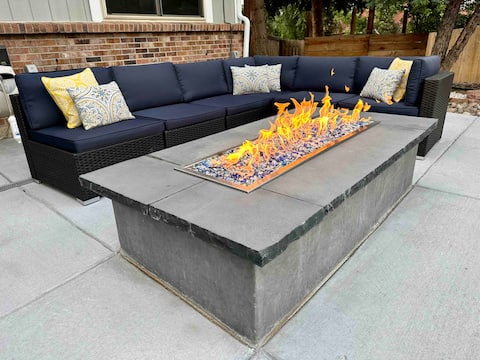
Luxury Estate Getaway
Entire Place • 5 bedrooms
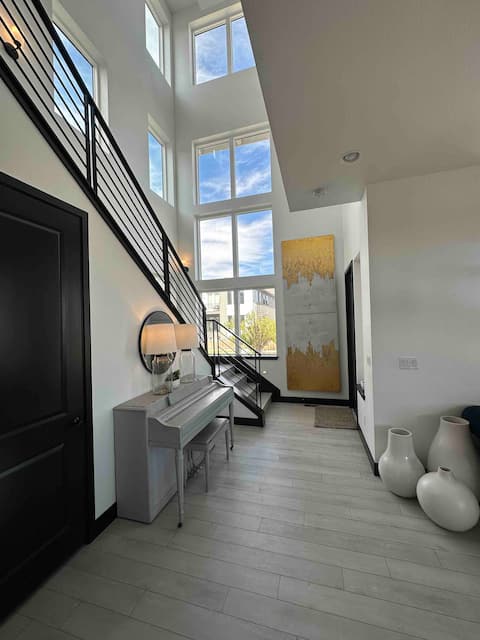
Large & Modern Home w/ Pool & Hot Tub & Fire Pit
Entire Place • 4 bedrooms
Luxury Mountain View Spa Home in The City
Entire Place • 5 bedrooms
Modern Home w/ 2 Private Suites- 15 mins to DIA
Entire Place • 4 bedrooms
Note: Performance varies based on location, size, amenities, seasonality, and management quality. Data reflects the past 12 months.
Top Performing Airbnb Hosts in Aurora (2026)
Learn from the best! This table showcases top-performing Airbnb hosts in Aurora based on the number of properties managed and estimated total revenue over the past year. Analyze their scale and performance metrics.
| Host Name | Properties | Grossing Revenue | Stay Reviews | Avg Rating |
|---|---|---|---|---|
| Evolve | 17 | $473,337 | 324 | 4.62/5.0 |
| Kevin | 2 | $219,608 | 103 | 4.96/5.0 |
| Sarah | 2 | $158,700 | 16 | 4.80/5.0 |
| Michael | 1 | $133,489 | 220 | 4.98/5.0 |
| Ian | 3 | $117,855 | 60 | 4.74/5.0 |
| Maylene | 3 | $117,090 | 54 | 4.74/5.0 |
| Scott | 2 | $113,135 | 25 | 4.70/5.0 |
| Brad And Kami | 1 | $109,708 | 113 | 4.97/5.0 |
| Harry | 4 | $100,788 | 52 | 4.90/5.0 |
| Xavier | 7 | $97,221 | 299 | 4.85/5.0 |
Analyzing the strategies of top hosts, such as their property selection, pricing, and guest communication, can offer valuable lessons for optimizing your own Airbnb operations in Aurora.
Dive Deeper: Advanced Aurora STR Market Data (2026)
Ready to unlock more insights? AirROI provides access to advanced metrics and comprehensive Airbnb data for Aurora. Explore detailed analytics beyond this report to refine your investment strategy, optimize pricing, and maximize your vacation rental profits.
Explore Advanced MetricsAurora Short-Term Rental Market Composition (2026): Property & Room Types
Room Type Distribution
Property Type Distribution
Market Composition Insights for Aurora
- The Aurora Airbnb market composition is heavily skewed towards Entire Home/Apt listings, which make up 67.1% of the 526 active rentals. This indicates strong guest preference for privacy and space.
- However, a notable 32.3% share for Private Rooms suggests opportunities for budget-conscious travelers or hosts renting out spare rooms.
- Looking at the property type distribution in Aurora, House properties are the most common (74.9%), reflecting the local real estate landscape.
- Houses represent a significant 74.9% portion, catering likely to families or larger groups.
- Smaller segments like hotel/boutique, unique stays, outdoor/unique (combined 4.0%) offer potential for unique stay experiences.
Aurora Airbnb Room Capacity Analysis (2026): Bedroom Distribution
Distribution of Listings by Number of Bedrooms
Room Capacity Insights for Aurora
- The dominant room capacity in Aurora is 2 bedrooms listings, making up 19.4% of the market. This suggests a strong demand for properties suitable for couples or solo travelers.
- Together, 2 bedrooms and 3 bedrooms properties represent 37.7% of the active Airbnb listings in Aurora, indicating a high concentration in these sizes.
- A significant 35.4% of listings offer 3+ bedrooms, catering to larger groups and families seeking more space in Aurora.
Aurora Vacation Rental Guest Capacity Trends (2026)
Distribution of Listings by Guest Capacity
Guest Capacity Insights for Aurora
- The most common guest capacity trend in Aurora vacation rentals is listings accommodating 8+ guests (19.2%). This suggests the primary traveler segment is likely larger groups.
- Properties designed for 8+ guests and 4 guests dominate the Aurora STR market, accounting for 34.2% of listings.
- 35.7% of properties accommodate 6+ guests, serving the market segment for larger families or group travel in Aurora.
- On average, properties in Aurora are equipped to host 3.8 guests.
Aurora Airbnb Booking Patterns (2026): Available vs. Booked Days
Available Days Distribution
Booked Days Distribution
Booking Pattern Insights for Aurora
- The most common availability pattern in Aurora falls within the 271-366 days range, representing 46.4% of listings. This suggests many properties have significant open periods on their calendars.
- Approximately 75.5% of listings show high availability (181+ days open annually), indicating potential for increased bookings or specific owner usage patterns.
- For booked days, the 31-90 days range is most frequent in Aurora (29.1%), reflecting common guest stay durations or potential owner blocking patterns.
- A notable 26.4% of properties secure long booking periods (181+ days booked per year), highlighting successful long-term rental strategies or significant owner usage.
Aurora Airbnb Minimum Stay Requirements Analysis
Distribution of Listings by Minimum Night Requirement
1 Night
99 listings
18.8% of total
2 Nights
87 listings
16.5% of total
3 Nights
47 listings
8.9% of total
4-6 Nights
39 listings
7.4% of total
7-29 Nights
44 listings
8.4% of total
30+ Nights
210 listings
39.9% of total
Key Insights
- The most prevalent minimum stay requirement in Aurora is 30+ Nights, adopted by 39.9% of listings. This highlights the market's preference for longer commitments.
- A significant segment (39.9%) caters to monthly stays (30+ nights) in Aurora, pointing to opportunities in the extended-stay market.
Recommendations
- Align with the market by considering a 30+ Nights minimum stay, as 39.9% of Aurora hosts use this setting.
- If feasible, allowing 1-night stays, especially midweek or during low season, could capture last-minute bookings, as only 18.8% currently do.
- Explore offering discounts for stays of 30+ nights to attract the 39.9% of the market seeking extended stays.
- Adjust minimum nights based on seasonality – potentially shorter during low season and longer during peak demand periods in Aurora.
Aurora Airbnb Cancellation Policy Trends Analysis (2026)
Limited
8 listings
1.5% of total
Super Strict 30 Days
2 listings
0.4% of total
Super Strict 60 Days
2 listings
0.4% of total
Flexible
158 listings
30.1% of total
Moderate
135 listings
25.7% of total
Firm
148 listings
28.2% of total
Strict
72 listings
13.7% of total
Cancellation Policy Insights for Aurora
- The prevailing Airbnb cancellation policy trend in Aurora is Flexible, used by 30.1% of listings.
- There's a relatively balanced mix between guest-friendly (55.8%) and stricter (41.9%) policies, offering choices for different guest needs.
Recommendations for Hosts
- Consider adopting a Flexible policy to align with the 30.1% market standard in Aurora.
- Using a Strict policy might deter some guests, as only 13.7% of listings use it. Evaluate if potential revenue protection outweighs possible lower booking rates.
- Regularly review your cancellation policy against competitors and market demand shifts in Aurora.
Aurora STR Booking Lead Time Analysis (2026)
Average Booking Lead Time by Month
Booking Lead Time Insights for Aurora
- The overall average booking lead time for vacation rentals in Aurora is 30 days.
- Guests book furthest in advance for stays during June (average 48 days), likely coinciding with peak travel demand or local events.
- The shortest booking windows occur for stays in February (average 19 days), indicating more last-minute travel plans during this time.
- Seasonally, Summer (41 days avg.) sees the longest lead times, while Winter (24 days avg.) has the shortest, reflecting typical travel planning cycles.
Recommendations for Hosts
- Use the overall average lead time (30 days) as a baseline for your pricing and availability strategy in Aurora.
- For June stays, consider implementing length-of-stay discounts or slightly higher rates for bookings made less than 48 days out to capitalize on advance planning.
- Target marketing efforts for the Summer season well in advance (at least 41 days) to capture early planners.
- Monitor your own booking lead times against these Aurora averages to identify opportunities for dynamic pricing adjustments.
Popular & Essential Airbnb Amenities in Aurora (2026)
Amenity Prevalence
Amenity Insights for Aurora
- Essential amenities in Aurora that guests expect include: Wifi, Smoke alarm. Lacking these (any) could significantly impact bookings.
- Popular amenities like TV, Air conditioning, Carbon monoxide alarm are common but not universal. Offering these can provide a competitive edge.
Recommendations for Hosts
- Ensure your listing includes all essential amenities for Aurora: Wifi, Smoke alarm.
- Prioritize adding missing essentials: Wifi, Smoke alarm.
- Consider adding popular differentiators like TV or Air conditioning to increase appeal.
- Highlight unique or less common amenities you offer (e.g., hot tub, dedicated workspace, EV charger) in your listing description and photos.
- Regularly check competitor amenities in Aurora to stay competitive.
Aurora Airbnb Guest Demographics & Profile Analysis (2026)
Guest Profile Summary for Aurora
- The typical guest profile for Airbnb in Aurora consists of primarily domestic travelers (94%), often arriving from nearby Denver, typically belonging to the Post-2000s (Gen Z/Alpha) group (50%), primarily speaking English or Spanish.
- Domestic travelers account for 93.7% of guests.
- Key international markets include United States (93.7%) and Canada (0.8%).
- Top languages spoken are English (67.1%) followed by Spanish (15.9%).
- A significant demographic segment is the Post-2000s (Gen Z/Alpha) group, representing 50% of guests.
Recommendations for Hosts
- Target domestic marketing efforts towards travelers from Denver and Albuquerque.
- Tailor amenities and listing descriptions to appeal to the dominant Post-2000s (Gen Z/Alpha) demographic (e.g., highlight fast WiFi, smart home features, local guides).
- Highlight unique local experiences or amenities relevant to the primary guest profile.
- Consider seasonal promotions aligned with peak travel times for key origin markets.
Nearby Short-Term Rental Market Comparison
How does the Aurora Airbnb market stack up against its neighbors? Compare key performance metrics like average monthly revenue, ADR, and occupancy rates in surrounding areas to understand the broader regional STR landscape.
| Market | Active Properties | Monthly Revenue | Daily Rate | Avg. Occupancy |
|---|---|---|---|---|
| Aspen Park | 11 | $5,825 | $395.00 | 54% |
| Indian Hills | 11 | $5,799 | $333.03 | 54% |
| Grand County | 14 | $5,137 | $513.48 | 42% |
| Black Hawk | 133 | $4,884 | $328.37 | 52% |
| Central City | 10 | $4,789 | $318.09 | 52% |
| Bailey | 126 | $4,611 | $310.32 | 53% |
| Cascade-Chipita Park | 103 | $4,541 | $330.50 | 52% |
| Estes Park | 1,311 | $4,504 | $383.02 | 45% |
| Woodmoor | 43 | $4,444 | $335.63 | 46% |
| Applewood | 18 | $4,400 | $269.95 | 56% |