Mansfield Airbnb Market Analysis 2026: Short Term Rental Data & Vacation Rental Statistics in Capitol Planning Region, United States
Is Airbnb profitable in Mansfield in 2026? Explore comprehensive Airbnb analytics for Mansfield, Capitol Planning Region, United States to uncover income potential. This 2026 STR market report for Mansfield, based on AirROI data from February 2025 to January 2026, reveals key trends in the niche market of 26 active listings.
Whether you're considering an Airbnb investment in Mansfield, optimizing your existing vacation rental, or exploring rental arbitrage opportunities, understanding the Mansfield Airbnb data is crucial. Leveraging the low regulation environment is key to maximizing your short term rental income potential. Let's dive into the specifics.
Key Mansfield Airbnb Performance Metrics Overview
Monthly Airbnb Revenue Variations & Income Potential in Mansfield (2026)
Understanding the monthly revenue variations for Airbnb listings in Mansfield is key to maximizing your short term rental income potential. Seasonality significantly impacts earnings. Our analysis, based on data from the past 12 months, shows that the peak revenue month for STRs in Mansfield is typically July, while February often presents the lowest earnings, highlighting opportunities for strategic pricing adjustments during shoulder and low seasons. Explore the typical Airbnb income in Mansfield across different performance tiers:
- Best-in-class properties (Top 10%) achieve $5,137+ monthly, often utilizing dynamic pricing and superior guest experiences.
- Strong performing properties (Top 25%) earn $3,212 or more, indicating effective management and desirable locations/amenities.
- Typical properties (Median) generate around $1,868 per month, representing the average market performance.
- Entry-level properties (Bottom 25%) see earnings around $1,016, often with potential for optimization.
Average Monthly Airbnb Earnings Trend in Mansfield
Mansfield Airbnb Occupancy Rate Trends (2026)
Maximize your bookings by understanding the Mansfield STR occupancy trends. Seasonal demand shifts significantly influence how often properties are booked. Typically, Julysees the highest demand (peak season occupancy), while January experiences the lowest (low season). Effective strategies, like adjusting minimum stays or offering promotions, can boost occupancy during slower periods. Here's how different property tiers perform in Mansfield:
- Best-in-class properties (Top 10%) achieve 82%+ occupancy, indicating high desirability and potentially optimized availability.
- Strong performing properties (Top 25%) maintain 63% or higher occupancy, suggesting good market fit and guest satisfaction.
- Typical properties (Median) have an occupancy rate around 44%.
- Entry-level properties (Bottom 25%) average 25% occupancy, potentially facing higher vacancy.
Average Monthly Occupancy Rate Trend in Mansfield
Average Daily Rate (ADR) Airbnb Trends in Mansfield (2026)
Effective short term rental pricing strategy in Mansfield involves understanding monthly ADR fluctuations. The Average Daily Rate (ADR) for Airbnb in Mansfield typically peaks in July and dips lowest during January. Leveraging Airbnb dynamic pricing tools or strategies based on this seasonality can significantly boost revenue. Here's a look at the typical nightly rates achieved:
- Best-in-class properties (Top 10%) command rates of $553+ per night, often due to premium features or locations.
- Strong performing properties (Top 25%) achieve nightly rates of $262 or more.
- Typical properties (Median) charge around $157 per night.
- Entry-level properties (Bottom 25%) earn around $89 per night.
Average Daily Rate (ADR) Trend by Month in Mansfield
Get Live Mansfield Market Intelligence 👇

Explore Real-time Analytics
Airbnb Seasonality Analysis & Trends in Mansfield (2026)
Peak Season (July, September, October)
- Revenue averages $4,035 per month
- Occupancy rates average 55.9%
- Daily rates average $268
Shoulder Season
- Revenue averages $2,518 per month
- Occupancy maintains around 43.5%
- Daily rates hold near $265
Low Season (January, February, March)
- Revenue drops to average $1,597 per month
- Occupancy decreases to average 40.9%
- Daily rates adjust to average $258
Seasonality Insights for Mansfield
- The Airbnb seasonality in Mansfield shows highly seasonal trends requiring careful strategy. While the sections above show seasonal averages, it's also insightful to look at the extremes:
- During the high season, the absolute peak month showcases Mansfield's highest earning potential, with monthly revenues capable of climbing to $4,421, occupancy reaching a high of 56.5%, and ADRs peaking at $293.
- Conversely, the slowest single month of the year, typically falling within the low season, marks the market's lowest point. In this month, revenue might dip to $1,459, occupancy could drop to 25.6%, and ADRs may adjust down to $244.
- Understanding both the seasonal averages and these monthly peaks and troughs in revenue, occupancy, and ADR is crucial for maximizing your Airbnb profit potential in Mansfield.
Seasonal Strategies for Maximizing Profit
- Peak Season: Maximize revenue through premium pricing and potentially longer minimum stays. Ensure high availability.
- Low Season: Offer competitive pricing, special promotions (e.g., extended stay discounts), and flexible cancellation policies. Target off-season travelers like remote workers or budget-conscious guests.
- Shoulder Seasons: Implement dynamic pricing that balances peak and low rates. Target weekend travelers or specific events. Offer slightly more flexible terms than peak season.
- Regularly analyze your own performance against these Mansfield seasonality benchmarks and adjust your pricing and availability strategy accordingly.
Best Areas for Airbnb Investment in Mansfield (2026)
Exploring the top neighborhoods for short-term rentals in Mansfield? This section highlights key areas, outlining why they are attractive for hosts and guests, along with notable local attractions. Consider these locations based on your target guest profile and investment strategy.
| Neighborhood / Area | Why Host Here? (Target Guests & Appeal) | Key Attractions & Landmarks |
|---|---|---|
| Downtown Mansfield | The central business district with a mix of historic buildings and modern amenities. Popular among business travelers and tourists for its easy access to local shops, dining, and entertainment. | Richland Carrousel Park, Mansfield Memorial Museum, Little Buckeye Children’s Museum, Mansfield Art Center, Theaters and Live Music Venues |
| Mansfield Park | A family-friendly neighborhood featuring large parks and recreational activities, appealing to families and those looking for outdoor experiences. | Mansfield Parks and Recreation, Richland Mall, Local Hiking Trails, Community Events, Picnic Areas |
| Lake Mansfield | Scenic area with beautiful lake views and outdoor recreation, ideal for guests looking for a peaceful getaway and nature activities. | Mansfield Lake Park, Fishing and Boating, Nature Trails, Picnic Areas, Bird Watching Spots |
| North End | A quiet residential area with a close-knit community, attractive for those who prefer a more laid-back stay while still being close to downtown attractions. | Local Diners and Coffee Shops, Historic Homes, Community Festivals, Nearby Parks, Walking Trails |
| West Side | Developing area with new shopping and dining options, drawing young professionals and families to explore the growing community. | Local Breweries, Shopping Centers, Restaurants, Emerging Art Scene, Bowling Alleys |
| East Mansfield | A suburban area with good schools and family-oriented facilities, popular among travelers visiting relatives or attending local events. | Schools and Educational Institutions, Family Recreation Centers, Community Pools, Local Parks, Shopping Facilities |
| Mansfield Sports District | Home to several sports facilities and arenas, attracting sports fans and visitors attending events, games, and tournaments. | AVITA Health Stadium, Mansfield Motorsports Park, Local Sports Events, Bowling Centers, Fitness Facilities |
| Heritage Woods | An inviting community known for its rich history and community events, drawing visitors interested in culture and local traditions. | Historical Society of Richland County, Annual Heritage Festivals, Art and Cultural Events, Local Museums, Community Gardens |
Understanding Airbnb License Requirements & STR Laws in Mansfield (2026)
While Mansfield, Capitol Planning Region, United States currently shows low STR regulations, specific Airbnb license requirements might still exist or change. Always verify the latest short term rental regulations and Airbnb license requirements directly with local government authorities for Mansfield to ensure full compliance before hosting.
(Source: AirROI data, 2026, finding no licensed listings among those analyzed)
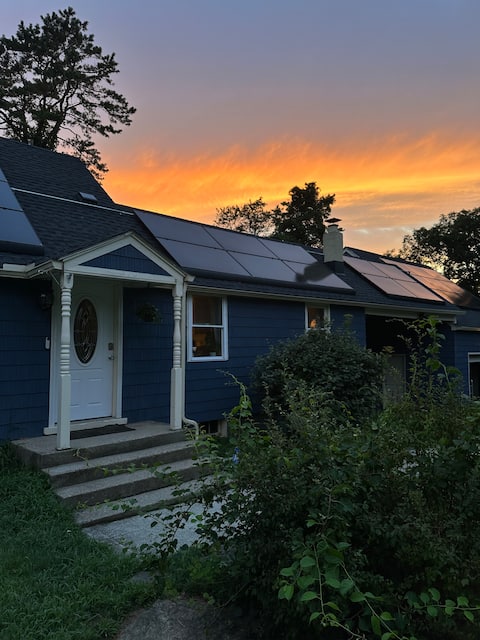
Top Performing Airbnb Properties in Mansfield (2026)
Benchmark your potential! Explore examples of top-performing Airbnb properties in Mansfieldbased on Trailing Twelve Month (TTM) revenue. Analyze their characteristics, revenue, occupancy rate, and ADR to understand what drives success in this market.

Huskies Hill Retreat
Entire Place • 5 bedrooms
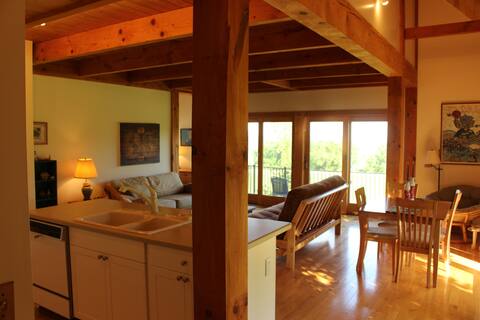
Green Energy Ecohaven
Entire Place • 1 bedroom
Stunning Mansfield Getaway near UConn & ECSU
Entire Place • 3 bedrooms

Tranquil Forest Haven
Entire Place • 4 bedrooms

Boondock Oasis on the River
Entire Place • 3 bedrooms

Whispering Pines at UConn
Entire Place • 5 bedrooms
Note: Performance varies based on location, size, amenities, seasonality, and management quality. Data reflects the past 12 months.
Top Performing Airbnb Hosts in Mansfield (2026)
Learn from the best! This table showcases top-performing Airbnb hosts in Mansfield based on the number of properties managed and estimated total revenue over the past year. Analyze their scale and performance metrics.
| Host Name | Properties | Grossing Revenue | Stay Reviews | Avg Rating |
|---|---|---|---|---|
| Emmanuel | 5 | $187,486 | 30 | 4.49/5.0 |
| Douglas | 2 | $78,307 | 384 | 4.95/5.0 |
| Mariana | 1 | $49,893 | 68 | 4.76/5.0 |
| Emma | 1 | $39,457 | 38 | 4.92/5.0 |
| Kathy | 2 | $36,870 | 115 | 4.93/5.0 |
| Nathan | 1 | $34,241 | 11 | 4.73/5.0 |
| Judy And Terry | 2 | $32,265 | 286 | 4.97/5.0 |
| Kathryn | 1 | $30,239 | 61 | 4.90/5.0 |
| Chris | 1 | $27,766 | 204 | 5.00/5.0 |
| Ben | 1 | $26,066 | 80 | 4.95/5.0 |
Analyzing the strategies of top hosts, such as their property selection, pricing, and guest communication, can offer valuable lessons for optimizing your own Airbnb operations in Mansfield.
Dive Deeper: Advanced Mansfield STR Market Data (2026)
Ready to unlock more insights? AirROI provides access to advanced metrics and comprehensive Airbnb data for Mansfield. Explore detailed analytics beyond this report to refine your investment strategy, optimize pricing, and maximize your vacation rental profits.
Explore Advanced MetricsMansfield Short-Term Rental Market Composition (2026): Property & Room Types
Room Type Distribution
Property Type Distribution
Market Composition Insights for Mansfield
- The Mansfield Airbnb market composition is heavily skewed towards Entire Home/Apt listings, which make up 69.2% of the 26 active rentals. This indicates strong guest preference for privacy and space.
- However, a notable 30.8% share for Private Rooms suggests opportunities for budget-conscious travelers or hosts renting out spare rooms.
- Looking at the property type distribution in Mansfield, House properties are the most common (53.8%), reflecting the local real estate landscape.
- Houses represent a significant 53.8% portion, catering likely to families or larger groups.
- The presence of 7.7% Hotel/Boutique listings indicates integration with traditional hospitality.
Mansfield Airbnb Room Capacity Analysis (2026): Bedroom Distribution
Distribution of Listings by Number of Bedrooms
Room Capacity Insights for Mansfield
- The dominant room capacity in Mansfield is 1 bedroom listings, making up 19.2% of the market. This suggests a strong demand for properties suitable for couples or solo travelers.
- Together, 1 bedroom and 3 bedrooms properties represent 34.6% of the active Airbnb listings in Mansfield, indicating a high concentration in these sizes.
- A significant 34.6% of listings offer 3+ bedrooms, catering to larger groups and families seeking more space in Mansfield.
Mansfield Vacation Rental Guest Capacity Trends (2026)
Distribution of Listings by Guest Capacity
Guest Capacity Insights for Mansfield
- The most common guest capacity trend in Mansfield vacation rentals is listings accommodating 8+ guests (23.1%). This suggests the primary traveler segment is likely larger groups.
- Properties designed for 8+ guests and 2 guests dominate the Mansfield STR market, accounting for 38.5% of listings.
- 34.6% of properties accommodate 6+ guests, serving the market segment for larger families or group travel in Mansfield.
- On average, properties in Mansfield are equipped to host 3.5 guests.
Mansfield Airbnb Booking Patterns (2026): Available vs. Booked Days
Available Days Distribution
Booked Days Distribution
Booking Pattern Insights for Mansfield
- The most common availability pattern in Mansfield falls within the 271-366 days range, representing 38.5% of listings. This suggests many properties have significant open periods on their calendars.
- Approximately 69.3% of listings show high availability (181+ days open annually), indicating potential for increased bookings or specific owner usage patterns.
- For booked days, the 31-90 days range is most frequent in Mansfield (30.8%), reflecting common guest stay durations or potential owner blocking patterns.
- A notable 34.6% of properties secure long booking periods (181+ days booked per year), highlighting successful long-term rental strategies or significant owner usage.
Mansfield Airbnb Minimum Stay Requirements Analysis
Distribution of Listings by Minimum Night Requirement
1 Night
9 listings
34.6% of total
2 Nights
4 listings
15.4% of total
3 Nights
3 listings
11.5% of total
4-6 Nights
1 listings
3.8% of total
7-29 Nights
1 listings
3.8% of total
30+ Nights
8 listings
30.8% of total
Key Insights
- The most prevalent minimum stay requirement in Mansfield is 1 Night, adopted by 34.6% of listings. This highlights the market's preference for shorter, flexible bookings.
- A significant segment (30.8%) caters to monthly stays (30+ nights) in Mansfield, pointing to opportunities in the extended-stay market.
Recommendations
- Align with the market by considering a 1 Night minimum stay, as 34.6% of Mansfield hosts use this setting.
- Explore offering discounts for stays of 30+ nights to attract the 30.8% of the market seeking extended stays.
- Adjust minimum nights based on seasonality – potentially shorter during low season and longer during peak demand periods in Mansfield.
Mansfield Airbnb Cancellation Policy Trends Analysis (2026)
Flexible
11 listings
42.3% of total
Moderate
10 listings
38.5% of total
Firm
5 listings
19.2% of total
Cancellation Policy Insights for Mansfield
- The prevailing Airbnb cancellation policy trend in Mansfield is Flexible, used by 42.3% of listings.
- The market strongly favors guest-friendly terms, with 80.8% of listings offering Flexible or Moderate policies. This suggests guests in Mansfield may expect booking flexibility.
Recommendations for Hosts
- Consider adopting a Flexible policy to align with the 42.3% market standard in Mansfield.
- Regularly review your cancellation policy against competitors and market demand shifts in Mansfield.
Mansfield STR Booking Lead Time Analysis (2026)
Average Booking Lead Time by Month
Booking Lead Time Insights for Mansfield
- The overall average booking lead time for vacation rentals in Mansfield is 49 days.
- Guests book furthest in advance for stays during May (average 80 days), likely coinciding with peak travel demand or local events.
- The shortest booking windows occur for stays in June (average 26 days), indicating more last-minute travel plans during this time.
- Seasonally, Spring (66 days avg.) sees the longest lead times, while Winter (34 days avg.) has the shortest, reflecting typical travel planning cycles.
Recommendations for Hosts
- Use the overall average lead time (49 days) as a baseline for your pricing and availability strategy in Mansfield.
- For May stays, consider implementing length-of-stay discounts or slightly higher rates for bookings made less than 80 days out to capitalize on advance planning.
- Target marketing efforts for the Spring season well in advance (at least 66 days) to capture early planners.
- Monitor your own booking lead times against these Mansfield averages to identify opportunities for dynamic pricing adjustments.
Popular & Essential Airbnb Amenities in Mansfield (2026)
Amenity Prevalence
Amenity Insights for Mansfield
- Essential amenities in Mansfield that guests expect include: Free parking on premises, Bed linens, Wifi, Smoke alarm, Hot water, Carbon monoxide alarm, Heating. Lacking these (any) could significantly impact bookings.
- Popular amenities like Refrigerator, Air conditioning, Coffee maker are common but not universal. Offering these can provide a competitive edge.
Recommendations for Hosts
- Ensure your listing includes all essential amenities for Mansfield: Free parking on premises, Bed linens, Wifi, Smoke alarm, Hot water, Carbon monoxide alarm, Heating.
- Prioritize adding missing essentials: Carbon monoxide alarm, Heating.
- Consider adding popular differentiators like Refrigerator or Air conditioning to increase appeal.
- Highlight unique or less common amenities you offer (e.g., hot tub, dedicated workspace, EV charger) in your listing description and photos.
- Regularly check competitor amenities in Mansfield to stay competitive.
Mansfield Airbnb Guest Demographics & Profile Analysis (2026)
Guest Profile Summary for Mansfield
- The typical guest profile for Airbnb in Mansfield consists of primarily domestic travelers (94%), often arriving from nearby New York, typically belonging to the Post-2000s (Gen Z/Alpha) group (50%), primarily speaking English or Spanish.
- Domestic travelers account for 93.6% of guests.
- Key international markets include United States (93.6%) and Canada (2.1%).
- Top languages spoken are English (67.7%) followed by Spanish (8.9%).
- A significant demographic segment is the Post-2000s (Gen Z/Alpha) group, representing 50% of guests.
Recommendations for Hosts
- Target domestic marketing efforts towards travelers from New York and Boston.
- Tailor amenities and listing descriptions to appeal to the dominant Post-2000s (Gen Z/Alpha) demographic (e.g., highlight fast WiFi, smart home features, local guides).
- Highlight unique local experiences or amenities relevant to the primary guest profile.
- Consider seasonal promotions aligned with peak travel times for key origin markets.
Nearby Short-Term Rental Market Comparison
How does the Mansfield Airbnb market stack up against its neighbors? Compare key performance metrics like average monthly revenue, ADR, and occupancy rates in surrounding areas to understand the broader regional STR landscape.
| Market | Active Properties | Monthly Revenue | Daily Rate | Avg. Occupancy |
|---|---|---|---|---|
| Sag Harbor | 15 | $6,129 | $1280.84 | 40% |
| Town of East Hampton | 1,327 | $5,945 | $986.02 | 36% |
| Middletown | 395 | $5,781 | $589.01 | 45% |
| North Andover | 12 | $5,625 | $440.84 | 45% |
| Town of Southampton | 1,201 | $5,620 | $1002.45 | 33% |
| Town of Ancram | 22 | $5,616 | $512.55 | 38% |
| Southampton | 19 | $5,405 | $1456.43 | 30% |
| New Shoreham | 120 | $5,359 | $637.79 | 45% |
| Wellesley | 22 | $5,310 | $520.90 | 50% |
| Monmouth Beach | 12 | $5,209 | $794.91 | 38% |