Coventry Airbnb Market Analysis 2026: Short Term Rental Data & Vacation Rental Statistics in Capitol Planning Region, United States
Is Airbnb profitable in Coventry in 2026? Explore comprehensive Airbnb analytics for Coventry, Capitol Planning Region, United States to uncover income potential. This 2026 STR market report for Coventry, based on AirROI data from February 2025 to January 2026, reveals key trends in the niche market of 28 active listings.
Whether you're considering an Airbnb investment in Coventry, optimizing your existing vacation rental, or exploring rental arbitrage opportunities, understanding the Coventry Airbnb data is crucial. Leveraging the low regulation environment is key to maximizing your short term rental income potential. Let's dive into the specifics.
Key Coventry Airbnb Performance Metrics Overview
Monthly Airbnb Revenue Variations & Income Potential in Coventry (2026)
Understanding the monthly revenue variations for Airbnb listings in Coventry is key to maximizing your short term rental income potential. Seasonality significantly impacts earnings. Our analysis, based on data from the past 12 months, shows that the peak revenue month for STRs in Coventry is typically July, while February often presents the lowest earnings, highlighting opportunities for strategic pricing adjustments during shoulder and low seasons. Explore the typical Airbnb income in Coventry across different performance tiers:
- Best-in-class properties (Top 10%) achieve $7,910+ monthly, often utilizing dynamic pricing and superior guest experiences.
- Strong performing properties (Top 25%) earn $5,871 or more, indicating effective management and desirable locations/amenities.
- Typical properties (Median) generate around $3,445 per month, representing the average market performance.
- Entry-level properties (Bottom 25%) see earnings around $2,206, often with potential for optimization.
Average Monthly Airbnb Earnings Trend in Coventry
Coventry Airbnb Occupancy Rate Trends (2026)
Maximize your bookings by understanding the Coventry STR occupancy trends. Seasonal demand shifts significantly influence how often properties are booked. Typically, Augustsees the highest demand (peak season occupancy), while February experiences the lowest (low season). Effective strategies, like adjusting minimum stays or offering promotions, can boost occupancy during slower periods. Here's how different property tiers perform in Coventry:
- Best-in-class properties (Top 10%) achieve 85%+ occupancy, indicating high desirability and potentially optimized availability.
- Strong performing properties (Top 25%) maintain 73% or higher occupancy, suggesting good market fit and guest satisfaction.
- Typical properties (Median) have an occupancy rate around 57%.
- Entry-level properties (Bottom 25%) average 37% occupancy, potentially facing higher vacancy.
Average Monthly Occupancy Rate Trend in Coventry
Average Daily Rate (ADR) Airbnb Trends in Coventry (2026)
Effective short term rental pricing strategy in Coventry involves understanding monthly ADR fluctuations. The Average Daily Rate (ADR) for Airbnb in Coventry typically peaks in July and dips lowest during February. Leveraging Airbnb dynamic pricing tools or strategies based on this seasonality can significantly boost revenue. Here's a look at the typical nightly rates achieved:
- Best-in-class properties (Top 10%) command rates of $365+ per night, often due to premium features or locations.
- Strong performing properties (Top 25%) achieve nightly rates of $298 or more.
- Typical properties (Median) charge around $234 per night.
- Entry-level properties (Bottom 25%) earn around $147 per night.
Average Daily Rate (ADR) Trend by Month in Coventry
Get Live Coventry Market Intelligence 👇

Explore Real-time Analytics
Airbnb Seasonality Analysis & Trends in Coventry (2026)
Peak Season (July, August, October)
- Revenue averages $5,994 per month
- Occupancy rates average 69.3%
- Daily rates average $274
Shoulder Season
- Revenue averages $4,079 per month
- Occupancy maintains around 54.9%
- Daily rates hold near $266
Low Season (January, February, March)
- Revenue drops to average $2,559 per month
- Occupancy decreases to average 42.4%
- Daily rates adjust to average $250
Seasonality Insights for Coventry
- The Airbnb seasonality in Coventry shows highly seasonal trends requiring careful strategy. While the sections above show seasonal averages, it's also insightful to look at the extremes:
- During the high season, the absolute peak month showcases Coventry's highest earning potential, with monthly revenues capable of climbing to $6,646, occupancy reaching a high of 75.4%, and ADRs peaking at $277.
- Conversely, the slowest single month of the year, typically falling within the low season, marks the market's lowest point. In this month, revenue might dip to $1,963, occupancy could drop to 39.1%, and ADRs may adjust down to $240.
- Understanding both the seasonal averages and these monthly peaks and troughs in revenue, occupancy, and ADR is crucial for maximizing your Airbnb profit potential in Coventry.
Seasonal Strategies for Maximizing Profit
- Peak Season: Maximize revenue through premium pricing and potentially longer minimum stays. Ensure high availability.
- Low Season: Offer competitive pricing, special promotions (e.g., extended stay discounts), and flexible cancellation policies. Target off-season travelers like remote workers or budget-conscious guests.
- Shoulder Seasons: Implement dynamic pricing that balances peak and low rates. Target weekend travelers or specific events. Offer slightly more flexible terms than peak season.
- Regularly analyze your own performance against these Coventry seasonality benchmarks and adjust your pricing and availability strategy accordingly.
Best Areas for Airbnb Investment in Coventry (2026)
Exploring the top neighborhoods for short-term rentals in Coventry? This section highlights key areas, outlining why they are attractive for hosts and guests, along with notable local attractions. Consider these locations based on your target guest profile and investment strategy.
| Neighborhood / Area | Why Host Here? (Target Guests & Appeal) | Key Attractions & Landmarks |
|---|---|---|
| City Centre | The heart of Coventry, offering a mix of historical architecture, shopping, and dining options. It's popular with tourists visiting the Cathedral and other landmarks. | Coventry Cathedral, Herbert Art Gallery and Museum, Shopping at West Orchards, Coventry Transport Museum, Belgrade Theatre |
| Canley | A well-connected residential area popular with students due to its proximity to Coventry University, making it ideal for short-term student rentals. | University of Warwick, Canley Park, local cafés and shops |
| Earlsdon | A charming suburb known for its independent shops and vibrant community atmosphere, appealing to visitors looking for local culture and history. | Earlsdon High Street, Coventry Mystery Play, local pubs |
| Hillfields | A diverse neighborhood close to the city center, with affordable accommodation options and a unique multicultural experience. | Hillfields Market, local eateries, community events |
| Spon End and Stoke | These areas offer access to both historical sites and the scenic Sadler's Pumping Station, attracting tourists and local visitors alike. | Coventry's canal system, War Memorial Park, Sadler's Pumping Station |
| Radford | Known for its rich history and local amenities, Radford appeals to families and groups looking for budget-friendly stays close to the city. | Historic buildings, Radford Cemetery, local parks |
| Whitley | A quieter area with easy access to the city center and the Ricoh Arena, making it attractive to sports fans and business visitors. | Ricoh Arena, local restaurants, Cannon Park |
| Lakeside | Located near parks and nature reserves, this area is ideal for those seeking relaxation and outdoor activities, appealing to families and nature lovers. | Coombe Country Park, local nature trails, water sports facilities |
Understanding Airbnb License Requirements & STR Laws in Coventry (2026)
While Coventry, Capitol Planning Region, United States currently shows low STR regulations, specific Airbnb license requirements might still exist or change. Always verify the latest short term rental regulations and Airbnb license requirements directly with local government authorities for Coventry to ensure full compliance before hosting.
(Source: AirROI data, 2026, finding no licensed listings among those analyzed)
Top Performing Airbnb Properties in Coventry (2026)
Benchmark your potential! Explore examples of top-performing Airbnb properties in Coventrybased on Trailing Twelve Month (TTM) revenue. Analyze their characteristics, revenue, occupancy rate, and ADR to understand what drives success in this market.

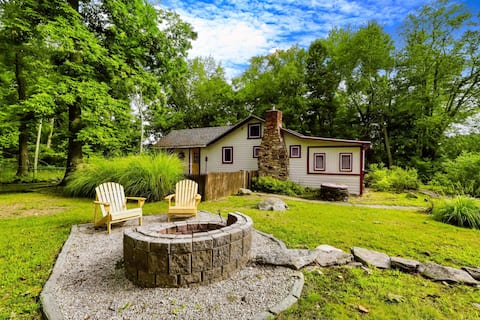
Cozy cottage 5 minutes from UConn
Entire Place • 3 bedrooms

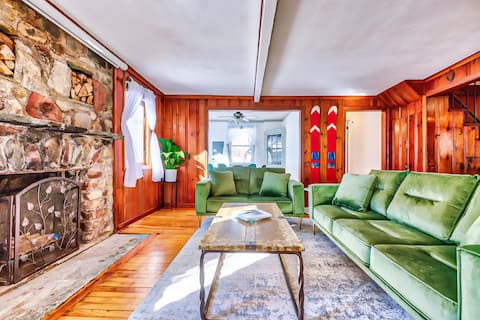
Waterfront 10 min to Uconn - fire pit outdoor tv
Entire Place • 3 bedrooms
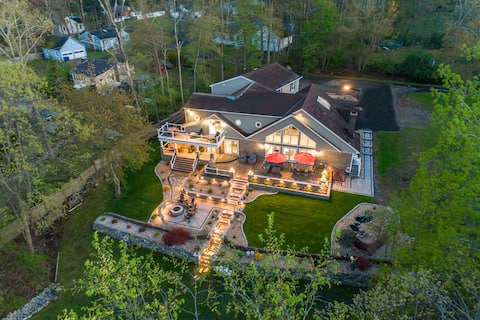
Lakefront Luxury, Kayaks, Fire Pit, Games, Theater
Entire Place • 5 bedrooms

Luxury Secluded Home on Equestrian Estate
Entire Place • 7 bedrooms
Lake - PetsOK - Wi-Fi - W&D - Fire Pit - Kayaks
Entire Place • 2 bedrooms
Lakefront - King - W&D - Fire Pit - Kayaks - SUPs
Entire Place • 3 bedrooms
Note: Performance varies based on location, size, amenities, seasonality, and management quality. Data reflects the past 12 months.
Top Performing Airbnb Hosts in Coventry (2026)
Learn from the best! This table showcases top-performing Airbnb hosts in Coventry based on the number of properties managed and estimated total revenue over the past year. Analyze their scale and performance metrics.
| Host Name | Properties | Grossing Revenue | Stay Reviews | Avg Rating |
|---|---|---|---|---|
| Joe | 3 | $200,884 | 487 | 4.83/5.0 |
| Evolve | 4 | $158,131 | 120 | 4.79/5.0 |
| Jennifer | 1 | $109,217 | 142 | 4.99/5.0 |
| Jeri | 3 | $103,390 | 264 | 5.00/5.0 |
| Jena | 1 | $82,917 | 155 | 5.00/5.0 |
| Maria | 1 | $78,873 | 7 | 5.00/5.0 |
| Richard | 1 | $78,063 | 344 | 4.93/5.0 |
| David | 1 | $46,308 | 33 | 5.00/5.0 |
| Julie | 1 | $44,490 | 43 | 4.93/5.0 |
| Thomas | 1 | $40,527 | 46 | 4.96/5.0 |
Analyzing the strategies of top hosts, such as their property selection, pricing, and guest communication, can offer valuable lessons for optimizing your own Airbnb operations in Coventry.
Dive Deeper: Advanced Coventry STR Market Data (2026)
Ready to unlock more insights? AirROI provides access to advanced metrics and comprehensive Airbnb data for Coventry. Explore detailed analytics beyond this report to refine your investment strategy, optimize pricing, and maximize your vacation rental profits.
Explore Advanced MetricsCoventry Short-Term Rental Market Composition (2026): Property & Room Types
Room Type Distribution
Property Type Distribution
Market Composition Insights for Coventry
- The Coventry Airbnb market composition is heavily skewed towards Entire Home/Apt listings, which make up 96.4% of the 28 active rentals. This indicates strong guest preference for privacy and space.
- Looking at the property type distribution in Coventry, House properties are the most common (57.1%), reflecting the local real estate landscape.
- Houses represent a significant 57.1% portion, catering likely to families or larger groups.
- Smaller segments like hotel/boutique (combined 3.6%) offer potential for unique stay experiences.
Coventry Airbnb Room Capacity Analysis (2026): Bedroom Distribution
Distribution of Listings by Number of Bedrooms
Room Capacity Insights for Coventry
- The dominant room capacity in Coventry is 3 bedrooms listings, making up 35.7% of the market. This suggests a strong demand for properties suitable for families or small groups.
- Together, 3 bedrooms and 1 bedroom properties represent 60.7% of the active Airbnb listings in Coventry, indicating a high concentration in these sizes.
- A significant 46.4% of listings offer 3+ bedrooms, catering to larger groups and families seeking more space in Coventry.
Coventry Vacation Rental Guest Capacity Trends (2026)
Distribution of Listings by Guest Capacity
Guest Capacity Insights for Coventry
- The most common guest capacity trend in Coventry vacation rentals is listings accommodating 6 guests (32.1%). This suggests the primary traveler segment is likely larger groups.
- Properties designed for 6 guests and 4 guests dominate the Coventry STR market, accounting for 50.0% of listings.
- 49.9% of properties accommodate 6+ guests, serving the market segment for larger families or group travel in Coventry.
- On average, properties in Coventry are equipped to host 4.8 guests.
Coventry Airbnb Booking Patterns (2026): Available vs. Booked Days
Available Days Distribution
Booked Days Distribution
Booking Pattern Insights for Coventry
- The most common availability pattern in Coventry falls within the 91-180 days range, representing 39.3% of listings. This suggests many properties have significant open periods on their calendars.
- Approximately 53.5% of listings show high availability (181+ days open annually), indicating potential for increased bookings or specific owner usage patterns.
- For booked days, the 181-270 days range is most frequent in Coventry (32.1%), reflecting common guest stay durations or potential owner blocking patterns.
- A notable 46.4% of properties secure long booking periods (181+ days booked per year), highlighting successful long-term rental strategies or significant owner usage.
Coventry Airbnb Minimum Stay Requirements Analysis
Distribution of Listings by Minimum Night Requirement
1 Night
5 listings
17.9% of total
2 Nights
7 listings
25% of total
4-6 Nights
1 listings
3.6% of total
30+ Nights
15 listings
53.6% of total
Key Insights
- The most prevalent minimum stay requirement in Coventry is 30+ Nights, adopted by 53.6% of listings. This highlights the market's preference for longer commitments.
- A significant segment (53.6%) caters to monthly stays (30+ nights) in Coventry, pointing to opportunities in the extended-stay market.
Recommendations
- Align with the market by considering a 30+ Nights minimum stay, as 53.6% of Coventry hosts use this setting.
- If feasible, allowing 1-night stays, especially midweek or during low season, could capture last-minute bookings, as only 17.9% currently do.
- Explore offering discounts for stays of 30+ nights to attract the 53.6% of the market seeking extended stays.
- Adjust minimum nights based on seasonality – potentially shorter during low season and longer during peak demand periods in Coventry.
Coventry Airbnb Cancellation Policy Trends Analysis (2026)
Flexible
3 listings
10.7% of total
Moderate
7 listings
25% of total
Firm
13 listings
46.4% of total
Strict
5 listings
17.9% of total
Cancellation Policy Insights for Coventry
- The prevailing Airbnb cancellation policy trend in Coventry is Firm, used by 46.4% of listings.
- A majority (64.3%) of hosts in Coventry utilize Firm or Strict policies, indicating a market where hosts prioritize booking security.
Recommendations for Hosts
- Consider adopting a Firm policy to align with the 46.4% market standard in Coventry.
- Regularly review your cancellation policy against competitors and market demand shifts in Coventry.
Coventry STR Booking Lead Time Analysis (2026)
Average Booking Lead Time by Month
Booking Lead Time Insights for Coventry
- The overall average booking lead time for vacation rentals in Coventry is 65 days.
- Guests book furthest in advance for stays during May (average 118 days), likely coinciding with peak travel demand or local events.
- The shortest booking windows occur for stays in February (average 22 days), indicating more last-minute travel plans during this time.
- Seasonally, Spring (72 days avg.) sees the longest lead times, while Winter (34 days avg.) has the shortest, reflecting typical travel planning cycles.
Recommendations for Hosts
- Use the overall average lead time (65 days) as a baseline for your pricing and availability strategy in Coventry.
- For May stays, consider implementing length-of-stay discounts or slightly higher rates for bookings made less than 118 days out to capitalize on advance planning.
- Target marketing efforts for the Spring season well in advance (at least 72 days) to capture early planners.
- Monitor your own booking lead times against these Coventry averages to identify opportunities for dynamic pricing adjustments.
Popular & Essential Airbnb Amenities in Coventry (2026)
Amenity Prevalence
Amenity Insights for Coventry
- Essential amenities in Coventry that guests expect include: Dishes and silverware, Smoke alarm, Hot water, Wifi, Carbon monoxide alarm, Free parking on premises, TV, Kitchen, Air conditioning. Lacking these (any) could significantly impact bookings.
- Popular amenities like Cooking basics are common but not universal. Offering these can provide a competitive edge.
Recommendations for Hosts
- Ensure your listing includes all essential amenities for Coventry: Dishes and silverware, Smoke alarm, Hot water, Wifi, Carbon monoxide alarm, Free parking on premises, TV, Kitchen, Air conditioning.
- Prioritize adding missing essentials: Smoke alarm, Hot water, Wifi, Carbon monoxide alarm, Free parking on premises, TV, Kitchen, Air conditioning.
- Consider adding popular differentiators like Cooking basics to increase appeal.
- Highlight unique or less common amenities you offer (e.g., hot tub, dedicated workspace, EV charger) in your listing description and photos.
- Regularly check competitor amenities in Coventry to stay competitive.
Coventry Airbnb Guest Demographics & Profile Analysis (2026)
Guest Profile Summary for Coventry
- The typical guest profile for Airbnb in Coventry consists of primarily domestic travelers (96%), often arriving from nearby New York, typically belonging to the Post-2000s (Gen Z/Alpha) group (50%), primarily speaking English or Spanish.
- Domestic travelers account for 95.5% of guests.
- Key international markets include United States (95.5%) and Canada (1%).
- Top languages spoken are English (66.7%) followed by Spanish (14.5%).
- A significant demographic segment is the Post-2000s (Gen Z/Alpha) group, representing 50% of guests.
Recommendations for Hosts
- Target domestic marketing efforts towards travelers from New York and Boston.
- Tailor amenities and listing descriptions to appeal to the dominant Post-2000s (Gen Z/Alpha) demographic (e.g., highlight fast WiFi, smart home features, local guides).
- Highlight unique local experiences or amenities relevant to the primary guest profile.
- Consider seasonal promotions aligned with peak travel times for key origin markets.
Nearby Short-Term Rental Market Comparison
How does the Coventry Airbnb market stack up against its neighbors? Compare key performance metrics like average monthly revenue, ADR, and occupancy rates in surrounding areas to understand the broader regional STR landscape.
| Market | Active Properties | Monthly Revenue | Daily Rate | Avg. Occupancy |
|---|---|---|---|---|
| Sag Harbor | 15 | $6,129 | $1280.84 | 40% |
| Town of East Hampton | 1,327 | $5,945 | $986.02 | 36% |
| Middletown | 395 | $5,781 | $589.01 | 45% |
| North Andover | 12 | $5,625 | $440.84 | 45% |
| Town of Southampton | 1,201 | $5,620 | $1002.45 | 33% |
| Town of Ancram | 22 | $5,616 | $512.55 | 38% |
| Southampton | 19 | $5,405 | $1456.43 | 30% |
| New Shoreham | 120 | $5,359 | $637.79 | 45% |
| Wellesley | 22 | $5,310 | $520.90 | 50% |
| Monmouth Beach | 12 | $5,209 | $794.91 | 38% |