Bloomfield Airbnb Market Analysis 2026: Short Term Rental Data & Vacation Rental Statistics in Capitol Planning Region, United States
Is Airbnb profitable in Bloomfield in 2026? Explore comprehensive Airbnb analytics for Bloomfield, Capitol Planning Region, United States to uncover income potential. This 2026 STR market report for Bloomfield, based on AirROI data from February 2025 to January 2026, reveals key trends in the niche market of 48 active listings.
Whether you're considering an Airbnb investment in Bloomfield, optimizing your existing vacation rental, or exploring rental arbitrage opportunities, understanding the Bloomfield Airbnb data is crucial. Leveraging the low regulation environment is key to maximizing your short term rental income potential. Let's dive into the specifics.
Key Bloomfield Airbnb Performance Metrics Overview
Monthly Airbnb Revenue Variations & Income Potential in Bloomfield (2026)
Understanding the monthly revenue variations for Airbnb listings in Bloomfield is key to maximizing your short term rental income potential. Seasonality significantly impacts earnings. Our analysis, based on data from the past 12 months, shows that the peak revenue month for STRs in Bloomfield is typically August, while January often presents the lowest earnings, highlighting opportunities for strategic pricing adjustments during shoulder and low seasons. Explore the typical Airbnb income in Bloomfield across different performance tiers:
- Best-in-class properties (Top 10%) achieve $8,438+ monthly, often utilizing dynamic pricing and superior guest experiences.
- Strong performing properties (Top 25%) earn $5,300 or more, indicating effective management and desirable locations/amenities.
- Typical properties (Median) generate around $2,290 per month, representing the average market performance.
- Entry-level properties (Bottom 25%) see earnings around $756, often with potential for optimization.
Average Monthly Airbnb Earnings Trend in Bloomfield
Bloomfield Airbnb Occupancy Rate Trends (2026)
Maximize your bookings by understanding the Bloomfield STR occupancy trends. Seasonal demand shifts significantly influence how often properties are booked. Typically, Julysees the highest demand (peak season occupancy), while January experiences the lowest (low season). Effective strategies, like adjusting minimum stays or offering promotions, can boost occupancy during slower periods. Here's how different property tiers perform in Bloomfield:
- Best-in-class properties (Top 10%) achieve 72%+ occupancy, indicating high desirability and potentially optimized availability.
- Strong performing properties (Top 25%) maintain 58% or higher occupancy, suggesting good market fit and guest satisfaction.
- Typical properties (Median) have an occupancy rate around 40%.
- Entry-level properties (Bottom 25%) average 23% occupancy, potentially facing higher vacancy.
Average Monthly Occupancy Rate Trend in Bloomfield
Average Daily Rate (ADR) Airbnb Trends in Bloomfield (2026)
Effective short term rental pricing strategy in Bloomfield involves understanding monthly ADR fluctuations. The Average Daily Rate (ADR) for Airbnb in Bloomfield typically peaks in October and dips lowest during April. Leveraging Airbnb dynamic pricing tools or strategies based on this seasonality can significantly boost revenue. Here's a look at the typical nightly rates achieved:
- Best-in-class properties (Top 10%) command rates of $511+ per night, often due to premium features or locations.
- Strong performing properties (Top 25%) achieve nightly rates of $345 or more.
- Typical properties (Median) charge around $112 per night.
- Entry-level properties (Bottom 25%) earn around $62 per night.
Average Daily Rate (ADR) Trend by Month in Bloomfield
Get Live Bloomfield Market Intelligence 👇

Explore Real-time Analytics
Airbnb Seasonality Analysis & Trends in Bloomfield (2026)
Peak Season (August, October, July)
- Revenue averages $4,838 per month
- Occupancy rates average 52.8%
- Daily rates average $240
Shoulder Season
- Revenue averages $3,690 per month
- Occupancy maintains around 39.6%
- Daily rates hold near $236
Low Season (January, March, April)
- Revenue drops to average $2,574 per month
- Occupancy decreases to average 34.5%
- Daily rates adjust to average $195
Seasonality Insights for Bloomfield
- The Airbnb seasonality in Bloomfield shows highly seasonal trends requiring careful strategy. While the sections above show seasonal averages, it's also insightful to look at the extremes:
- During the high season, the absolute peak month showcases Bloomfield's highest earning potential, with monthly revenues capable of climbing to $4,946, occupancy reaching a high of 56.4%, and ADRs peaking at $278.
- Conversely, the slowest single month of the year, typically falling within the low season, marks the market's lowest point. In this month, revenue might dip to $2,129, occupancy could drop to 28.2%, and ADRs may adjust down to $169.
- Understanding both the seasonal averages and these monthly peaks and troughs in revenue, occupancy, and ADR is crucial for maximizing your Airbnb profit potential in Bloomfield.
Seasonal Strategies for Maximizing Profit
- Peak Season: Maximize revenue through premium pricing and potentially longer minimum stays. Ensure high availability.
- Low Season: Offer competitive pricing, special promotions (e.g., extended stay discounts), and flexible cancellation policies. Target off-season travelers like remote workers or budget-conscious guests.
- Shoulder Seasons: Implement dynamic pricing that balances peak and low rates. Target weekend travelers or specific events. Offer slightly more flexible terms than peak season.
- Regularly analyze your own performance against these Bloomfield seasonality benchmarks and adjust your pricing and availability strategy accordingly.
Best Areas for Airbnb Investment in Bloomfield (2026)
Exploring the top neighborhoods for short-term rentals in Bloomfield? This section highlights key areas, outlining why they are attractive for hosts and guests, along with notable local attractions. Consider these locations based on your target guest profile and investment strategy.
| Neighborhood / Area | Why Host Here? (Target Guests & Appeal) | Key Attractions & Landmarks |
|---|---|---|
| Bloomfield Center | The vibrant commercial district that attracts visitors for shopping and dining. It's a hub for cultural events and festivals, making it appealing for short-term rentals. | Bloomfield Shopping District, Bloomfield Public Library, Bloomfield Free Public Library, Van Buren Park, Watsessing Park |
| Glen Ridge | A picturesque suburb known for its historic homes and close-knit community. Ideal for families and those seeking a quiet getaway close to Bloomfield's amenities. | Glen Ridge Historic District, Glen Ridge Country Club, Clinton Road Park, Glen Ridge Train Station, Brookside Park |
| Cedar Grove | A charming township offering parks and outdoor spaces. Attracts visitors looking for a peaceful retreat while remaining within reach of urban attractions. | Cedar Grove Park, Robert A. Smith Park, Glen Ridge Reservation, Cedar Grove Community Center, Montclair State University |
| Montclair | An artsy town with a vibrant community and plenty of restaurants, galleries, and live music venues. Perfect for travelers who appreciate a rich cultural scene. | Montclair Art Museum, Wellmont Theater, Nishuane Park, Edgemont Memorial Park, Montclair Flea Market |
| Nutley | A charming township with a suburban feel, offering parks and recreational activities. Great for families seeking a safe and quiet area. | Yanticaw Park, Nutley Park, Kingsland Park, Nutley Historical Society, Nutley Farmers Market |
| West Orange | Home to the scenic South Mountain Reservation, this area features nature trails and views. Ideal for outdoor enthusiasts and those seeking a nature-centered stay. | South Mountain Reservation, Turtle Back Zoo, Regal Signature Cinema, West Orange 4th of July Parade, Edison National Historic Park |
| East Orange | An urban area with diverse culture and rich history. Offers an eclectic mix of dining and entertainment, appealing to various types of visitors. | East Orange Farmer's Market, City Hall, East Orange Museum, East Orange General Hospital, Montclair State University |
| South Orange | A vibrant community filled with cultural and recreational opportunities. Ideal for visitors looking for a lively atmosphere and local flair. | Seton Hall University, South Orange Performing Arts Center, Mead Park, The Baird Center, Floods Hill |
Understanding Airbnb License Requirements & STR Laws in Bloomfield (2026)
While Bloomfield, Capitol Planning Region, United States currently shows low STR regulations, specific Airbnb license requirements might still exist or change. Always verify the latest short term rental regulations and Airbnb license requirements directly with local government authorities for Bloomfield to ensure full compliance before hosting.
(Source: AirROI data, 2026, based on 2% licensed listings)
Top Performing Airbnb Properties in Bloomfield (2026)
Benchmark your potential! Explore examples of top-performing Airbnb properties in Bloomfieldbased on Trailing Twelve Month (TTM) revenue. Analyze their characteristics, revenue, occupancy rate, and ADR to understand what drives success in this market.
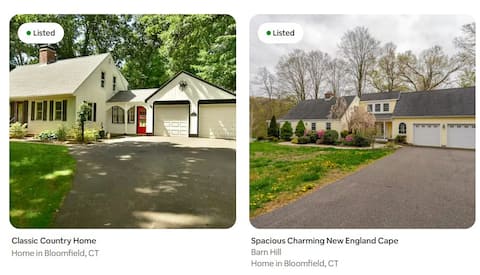
The Gathering -2 House Compound
Entire Place • 10 bedrooms
Ideal Family Stay | Sleeps 20 in Bloomfield, CT
Entire Place • 10 bedrooms
Global Retreat
Entire Place • 7 bedrooms
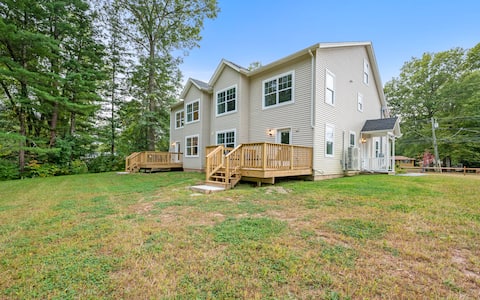
Spacious 5BR Home w/ KING Bed, Wi-Fi & Parking
Entire Place • 5 bedrooms
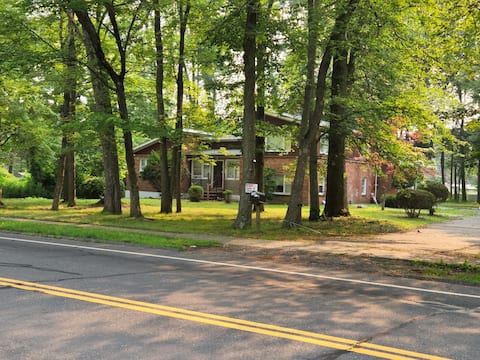
Unique Stay | 3 Kings & 2 Queens in Beautiful Home
Entire Place • 5 bedrooms

Luxury 5BR Home in Central Bloomfield Spot
Entire Place • 5 bedrooms
Note: Performance varies based on location, size, amenities, seasonality, and management quality. Data reflects the past 12 months.
Top Performing Airbnb Hosts in Bloomfield (2026)
Learn from the best! This table showcases top-performing Airbnb hosts in Bloomfield based on the number of properties managed and estimated total revenue over the past year. Analyze their scale and performance metrics.
| Host Name | Properties | Grossing Revenue | Stay Reviews | Avg Rating |
|---|---|---|---|---|
| Diamond | 8 | $562,991 | 142 | 4.39/5.0 |
| Carol | 4 | $318,701 | 215 | 4.94/5.0 |
| Owen | 1 | $92,534 | 58 | 4.71/5.0 |
| Andy | 5 | $87,820 | 84 | 4.71/5.0 |
| Management Team | 1 | $76,247 | 16 | 4.31/5.0 |
| Erica | 2 | $52,313 | 125 | 4.88/5.0 |
| Corina | 1 | $40,082 | 146 | 4.96/5.0 |
| Luke | 1 | $37,896 | 118 | 4.92/5.0 |
| Ell | 11 | $34,258 | 108 | 4.52/5.0 |
| Julianne | 1 | $28,999 | 133 | 4.97/5.0 |
Analyzing the strategies of top hosts, such as their property selection, pricing, and guest communication, can offer valuable lessons for optimizing your own Airbnb operations in Bloomfield.
Dive Deeper: Advanced Bloomfield STR Market Data (2026)
Ready to unlock more insights? AirROI provides access to advanced metrics and comprehensive Airbnb data for Bloomfield. Explore detailed analytics beyond this report to refine your investment strategy, optimize pricing, and maximize your vacation rental profits.
Explore Advanced MetricsBloomfield Short-Term Rental Market Composition (2026): Property & Room Types
Room Type Distribution
Property Type Distribution
Market Composition Insights for Bloomfield
- The Bloomfield Airbnb market composition is heavily skewed towards Entire Home/Apt listings, which make up 60.4% of the 48 active rentals. This indicates strong guest preference for privacy and space.
- However, a notable 39.6% share for Private Rooms suggests opportunities for budget-conscious travelers or hosts renting out spare rooms.
- Looking at the property type distribution in Bloomfield, House properties are the most common (77.1%), reflecting the local real estate landscape.
- Houses represent a significant 77.1% portion, catering likely to families or larger groups.
- Smaller segments like unique stays (combined 2.1%) offer potential for unique stay experiences.
Bloomfield Airbnb Room Capacity Analysis (2026): Bedroom Distribution
Distribution of Listings by Number of Bedrooms
Room Capacity Insights for Bloomfield
- The dominant room capacity in Bloomfield is 5+ bedrooms listings, making up 25% of the market. This suggests a strong demand for properties suitable for families or small groups.
- Together, 5+ bedrooms and 1 bedroom properties represent 43.8% of the active Airbnb listings in Bloomfield, indicating a high concentration in these sizes.
- A significant 37.5% of listings offer 3+ bedrooms, catering to larger groups and families seeking more space in Bloomfield.
Bloomfield Vacation Rental Guest Capacity Trends (2026)
Distribution of Listings by Guest Capacity
Guest Capacity Insights for Bloomfield
- The most common guest capacity trend in Bloomfield vacation rentals is listings accommodating 8+ guests (29.2%). This suggests the primary traveler segment is likely larger groups.
- Properties designed for 8+ guests and 4 guests dominate the Bloomfield STR market, accounting for 41.7% of listings.
- 35.5% of properties accommodate 6+ guests, serving the market segment for larger families or group travel in Bloomfield.
- On average, properties in Bloomfield are equipped to host 3.6 guests.
Bloomfield Airbnb Booking Patterns (2026): Available vs. Booked Days
Available Days Distribution
Booked Days Distribution
Booking Pattern Insights for Bloomfield
- The most common availability pattern in Bloomfield falls within the 271-366 days range, representing 52.1% of listings. This suggests many properties have significant open periods on their calendars.
- Approximately 81.3% of listings show high availability (181+ days open annually), indicating potential for increased bookings or specific owner usage patterns.
- For booked days, the 31-90 days range is most frequent in Bloomfield (33.3%), reflecting common guest stay durations or potential owner blocking patterns.
- A notable 20.9% of properties secure long booking periods (181+ days booked per year), highlighting successful long-term rental strategies or significant owner usage.
Bloomfield Airbnb Minimum Stay Requirements Analysis
Distribution of Listings by Minimum Night Requirement
1 Night
7 listings
14.6% of total
2 Nights
15 listings
31.3% of total
4-6 Nights
10 listings
20.8% of total
7-29 Nights
2 listings
4.2% of total
30+ Nights
14 listings
29.2% of total
Key Insights
- The most prevalent minimum stay requirement in Bloomfield is 2 Nights, adopted by 31.3% of listings. This highlights the market's preference for shorter, flexible bookings.
- A significant segment (29.2%) caters to monthly stays (30+ nights) in Bloomfield, pointing to opportunities in the extended-stay market.
Recommendations
- Align with the market by considering a 2 Nights minimum stay, as 31.3% of Bloomfield hosts use this setting.
- If feasible, allowing 1-night stays, especially midweek or during low season, could capture last-minute bookings, as only 14.6% currently do.
- A 2-night minimum appears standard (31.3%). Consider this for weekends or peak periods.
- Explore offering discounts for stays of 30+ nights to attract the 29.2% of the market seeking extended stays.
- Adjust minimum nights based on seasonality – potentially shorter during low season and longer during peak demand periods in Bloomfield.
Bloomfield Airbnb Cancellation Policy Trends Analysis (2026)
Flexible
11 listings
23.4% of total
Moderate
2 listings
4.3% of total
Firm
23 listings
48.9% of total
Strict
11 listings
23.4% of total
Cancellation Policy Insights for Bloomfield
- The prevailing Airbnb cancellation policy trend in Bloomfield is Firm, used by 48.9% of listings.
- A majority (72.3%) of hosts in Bloomfield utilize Firm or Strict policies, indicating a market where hosts prioritize booking security.
Recommendations for Hosts
- Consider adopting a Firm policy to align with the 48.9% market standard in Bloomfield.
- Regularly review your cancellation policy against competitors and market demand shifts in Bloomfield.
Bloomfield STR Booking Lead Time Analysis (2026)
Average Booking Lead Time by Month
Booking Lead Time Insights for Bloomfield
- The overall average booking lead time for vacation rentals in Bloomfield is 43 days.
- Guests book furthest in advance for stays during December (average 75 days), likely coinciding with peak travel demand or local events.
- The shortest booking windows occur for stays in February (average 18 days), indicating more last-minute travel plans during this time.
- Seasonally, Fall (52 days avg.) sees the longest lead times, while Winter (40 days avg.) has the shortest, reflecting typical travel planning cycles.
Recommendations for Hosts
- Use the overall average lead time (43 days) as a baseline for your pricing and availability strategy in Bloomfield.
- For December stays, consider implementing length-of-stay discounts or slightly higher rates for bookings made less than 75 days out to capitalize on advance planning.
- Target marketing efforts for the Fall season well in advance (at least 52 days) to capture early planners.
- Monitor your own booking lead times against these Bloomfield averages to identify opportunities for dynamic pricing adjustments.
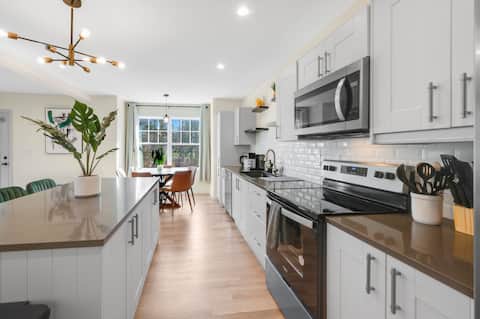
Popular & Essential Airbnb Amenities in Bloomfield (2026)
Amenity Prevalence
Amenity Insights for Bloomfield
- Essential amenities in Bloomfield that guests expect include: Wifi, Free parking on premises, Smoke alarm, Air conditioning. Lacking these (any) could significantly impact bookings.
- Popular amenities like Heating, Carbon monoxide alarm, TV are common but not universal. Offering these can provide a competitive edge.
Recommendations for Hosts
- Ensure your listing includes all essential amenities for Bloomfield: Wifi, Free parking on premises, Smoke alarm, Air conditioning.
- Prioritize adding missing essentials: Smoke alarm, Air conditioning.
- Consider adding popular differentiators like Heating or Carbon monoxide alarm to increase appeal.
- Highlight unique or less common amenities you offer (e.g., hot tub, dedicated workspace, EV charger) in your listing description and photos.
- Regularly check competitor amenities in Bloomfield to stay competitive.
Bloomfield Airbnb Guest Demographics & Profile Analysis (2026)
Guest Profile Summary for Bloomfield
- The typical guest profile for Airbnb in Bloomfield consists of primarily domestic travelers (92%), often arriving from nearby New York, typically belonging to the Post-2000s (Gen Z/Alpha) group (50%), primarily speaking English or Spanish.
- Domestic travelers account for 92.4% of guests.
- Key international markets include United States (92.4%) and Canada (1.1%).
- Top languages spoken are English (63.4%) followed by Spanish (19%).
- A significant demographic segment is the Post-2000s (Gen Z/Alpha) group, representing 50% of guests.
Recommendations for Hosts
- Target domestic marketing efforts towards travelers from New York and Boston.
- Tailor amenities and listing descriptions to appeal to the dominant Post-2000s (Gen Z/Alpha) demographic (e.g., highlight fast WiFi, smart home features, local guides).
- Highlight unique local experiences or amenities relevant to the primary guest profile.
- Consider seasonal promotions aligned with peak travel times for key origin markets.
Nearby Short-Term Rental Market Comparison
How does the Bloomfield Airbnb market stack up against its neighbors? Compare key performance metrics like average monthly revenue, ADR, and occupancy rates in surrounding areas to understand the broader regional STR landscape.
| Market | Active Properties | Monthly Revenue | Daily Rate | Avg. Occupancy |
|---|---|---|---|---|
| Sag Harbor | 15 | $6,129 | $1280.84 | 40% |
| Town of East Hampton | 1,327 | $5,945 | $986.02 | 36% |
| Middletown | 395 | $5,781 | $589.01 | 45% |
| North Andover | 12 | $5,625 | $440.84 | 45% |
| Town of Southampton | 1,201 | $5,620 | $1002.45 | 33% |
| Town of Ancram | 22 | $5,616 | $512.55 | 38% |
| Southampton | 19 | $5,405 | $1456.43 | 30% |
| New Shoreham | 120 | $5,359 | $637.79 | 45% |
| Wellesley | 22 | $5,310 | $520.90 | 50% |
| Monmouth Beach | 12 | $5,209 | $794.91 | 38% |