Willow Creek Airbnb Market Analysis 2026: Short Term Rental Data & Vacation Rental Statistics in California, United States
Is Airbnb profitable in Willow Creek in 2026? Explore comprehensive Airbnb analytics for Willow Creek, California, United States to uncover income potential. This 2026 STR market report for Willow Creek, based on AirROI data from February 2025 to January 2026, reveals key trends in the niche market of 24 active listings.
Whether you're considering an Airbnb investment in Willow Creek, optimizing your existing vacation rental, or exploring rental arbitrage opportunities, understanding the Willow Creek Airbnb data is crucial. Leveraging the low regulation environment is key to maximizing your short term rental income potential. Let's dive into the specifics.
Key Willow Creek Airbnb Performance Metrics Overview
Monthly Airbnb Revenue Variations & Income Potential in Willow Creek (2026)
Understanding the monthly revenue variations for Airbnb listings in Willow Creek is key to maximizing your short term rental income potential. Seasonality significantly impacts earnings. Our analysis, based on data from the past 12 months, shows that the peak revenue month for STRs in Willow Creek is typically July, while February often presents the lowest earnings, highlighting opportunities for strategic pricing adjustments during shoulder and low seasons. Explore the typical Airbnb income in Willow Creek across different performance tiers:
- Best-in-class properties (Top 10%) achieve $6,889+ monthly, often utilizing dynamic pricing and superior guest experiences.
- Strong performing properties (Top 25%) earn $4,134 or more, indicating effective management and desirable locations/amenities.
- Typical properties (Median) generate around $2,377 per month, representing the average market performance.
- Entry-level properties (Bottom 25%) see earnings around $1,251, often with potential for optimization.
Average Monthly Airbnb Earnings Trend in Willow Creek
Willow Creek Airbnb Occupancy Rate Trends (2026)
Maximize your bookings by understanding the Willow Creek STR occupancy trends. Seasonal demand shifts significantly influence how often properties are booked. Typically, Augustsees the highest demand (peak season occupancy), while February experiences the lowest (low season). Effective strategies, like adjusting minimum stays or offering promotions, can boost occupancy during slower periods. Here's how different property tiers perform in Willow Creek:
- Best-in-class properties (Top 10%) achieve 76%+ occupancy, indicating high desirability and potentially optimized availability.
- Strong performing properties (Top 25%) maintain 55% or higher occupancy, suggesting good market fit and guest satisfaction.
- Typical properties (Median) have an occupancy rate around 40%.
- Entry-level properties (Bottom 25%) average 18% occupancy, potentially facing higher vacancy.
Average Monthly Occupancy Rate Trend in Willow Creek
Average Daily Rate (ADR) Airbnb Trends in Willow Creek (2026)
Effective short term rental pricing strategy in Willow Creek involves understanding monthly ADR fluctuations. The Average Daily Rate (ADR) for Airbnb in Willow Creek typically peaks in June and dips lowest during February. Leveraging Airbnb dynamic pricing tools or strategies based on this seasonality can significantly boost revenue. Here's a look at the typical nightly rates achieved:
- Best-in-class properties (Top 10%) command rates of $421+ per night, often due to premium features or locations.
- Strong performing properties (Top 25%) achieve nightly rates of $305 or more.
- Typical properties (Median) charge around $213 per night.
- Entry-level properties (Bottom 25%) earn around $155 per night.
Average Daily Rate (ADR) Trend by Month in Willow Creek
Get Live Willow Creek Market Intelligence 👇

Explore Real-time Analytics
Airbnb Seasonality Analysis & Trends in Willow Creek (2026)
Peak Season (July, August, June)
- Revenue averages $4,441 per month
- Occupancy rates average 48.8%
- Daily rates average $247
Shoulder Season
- Revenue averages $3,145 per month
- Occupancy maintains around 40.0%
- Daily rates hold near $243
Low Season (January, February, March)
- Revenue drops to average $2,146 per month
- Occupancy decreases to average 30.5%
- Daily rates adjust to average $227
Seasonality Insights for Willow Creek
- The Airbnb seasonality in Willow Creek shows highly seasonal trends requiring careful strategy. While the sections above show seasonal averages, it's also insightful to look at the extremes:
- During the high season, the absolute peak month showcases Willow Creek's highest earning potential, with monthly revenues capable of climbing to $4,951, occupancy reaching a high of 54.6%, and ADRs peaking at $256.
- Conversely, the slowest single month of the year, typically falling within the low season, marks the market's lowest point. In this month, revenue might dip to $1,302, occupancy could drop to 25.3%, and ADRs may adjust down to $214.
- Understanding both the seasonal averages and these monthly peaks and troughs in revenue, occupancy, and ADR is crucial for maximizing your Airbnb profit potential in Willow Creek.
Seasonal Strategies for Maximizing Profit
- Peak Season: Maximize revenue through premium pricing and potentially longer minimum stays. Ensure high availability.
- Low Season: Offer competitive pricing, special promotions (e.g., extended stay discounts), and flexible cancellation policies. Target off-season travelers like remote workers or budget-conscious guests.
- Shoulder Seasons: Implement dynamic pricing that balances peak and low rates. Target weekend travelers or specific events. Offer slightly more flexible terms than peak season.
- Regularly analyze your own performance against these Willow Creek seasonality benchmarks and adjust your pricing and availability strategy accordingly.
Best Areas for Airbnb Investment in Willow Creek (2026)
Exploring the top neighborhoods for short-term rentals in Willow Creek? This section highlights key areas, outlining why they are attractive for hosts and guests, along with notable local attractions. Consider these locations based on your target guest profile and investment strategy.
| Neighborhood / Area | Why Host Here? (Target Guests & Appeal) | Key Attractions & Landmarks |
|---|---|---|
| Willow Creek Downtown | The heart of Willow Creek, offering quaint shops, local dining, and easy access to outdoor activities. A charming location that attracts visitors looking to explore the local culture and art scene. | Willow Creek Historical Museum, Klamath River, Local Artisan Shops, Humboldt-Toiyabe National Forest, Willow Creek Nature Trail |
| Hexenhaus | A unique and mysterious area known for its stunning natural beauty. Visitors are drawn to its tranquil environment and opportunities for hiking and water activities. | Hexenhaus Woods, Fishing on the Klamath River, Scenic Hiking Trails, Wildlife Viewing, Local Art Installations |
| Trinity River | This area is perfect for those interested in river activities such as fishing, kayaking, and rafting. The natural beauty and accessibility to outdoor sports make it a popular choice for adventure seekers. | Trinity River Rafting, Trinity Lake, Hiking Trails, Wildlife Watching, Scenic Picnic Areas |
| Redwood National and State Parks | A short drive from Willow Creek, this stunning area is famous for its towering redwoods. It attracts nature lovers and tourists interested in hiking and photography. | Tall Trees Grove, Lady Bird Johnson Grove, All Species Trail, Redwood Creek, Scenic Drives |
| Humboldt Redwoods State Park | Known for its majestic redwoods, this park offers peaceful scenery and various outdoor activities. It's a great location for those looking to escape into nature and unwind. | Avenue of the Giants, Visitor Center, Nature Trails, Historic Benbow Inn, Picnic Areas |
| Hoopa Valley | A culturally rich area surrounded by stunning landscapes, attracting those interested in learning about Native American culture and traditions. | Hoopa Valley Tribal Museum, Cultural Events, Nature Trails, River Activities, Community Events |
| Willow Creek Community Center | A vibrant community location hosting various events and activities. It serves as a hub for visitors and locals alike, providing experience of local life. | Community Events, Art Exhibits, Workshops, Outdoor Activities, Local Markets |
| Local Farms and Vineyards | This area offers a taste of local agriculture, with opportunities for farm tours, wine tasting, and experiencing rural life in Humboldt County. | Farm Tours, Wine Tasting Rooms, Local Produce Markets, Agricultural Events, Scenic Views |
Understanding Airbnb License Requirements & STR Laws in Willow Creek (2026)
While Willow Creek, California, United States currently shows low STR regulations, specific Airbnb license requirements might still exist or change. Always verify the latest short term rental regulations and Airbnb license requirements directly with local government authorities for Willow Creek to ensure full compliance before hosting.
(Source: AirROI data, 2026, finding no licensed listings among those analyzed)
Top Performing Airbnb Properties in Willow Creek (2026)
Benchmark your potential! Explore examples of top-performing Airbnb properties in Willow Creekbased on Trailing Twelve Month (TTM) revenue. Analyze their characteristics, revenue, occupancy rate, and ADR to understand what drives success in this market.
Riverfront Eco Nest- HotTub- Sauna- Cold Plunge
Entire Place • 3 bedrooms
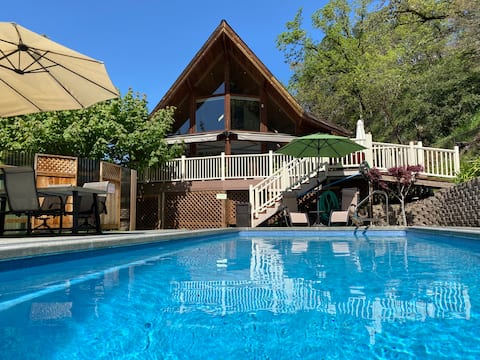
Stunning Fairway Chalet, Heated Pool, Mtn View
Entire Place • 4 bedrooms

Mountain Getaway A modern retreat
Entire Place • 3 bedrooms

Willow Creek River Retreat
Entire Place • 3 bedrooms

Bigfoot River House
Entire Place • 3 bedrooms

Peaceful 2 bdrm in the woods-
Entire Place • 2 bedrooms
Note: Performance varies based on location, size, amenities, seasonality, and management quality. Data reflects the past 12 months.
Top Performing Airbnb Hosts in Willow Creek (2026)
Learn from the best! This table showcases top-performing Airbnb hosts in Willow Creek based on the number of properties managed and estimated total revenue over the past year. Analyze their scale and performance metrics.
| Host Name | Properties | Grossing Revenue | Stay Reviews | Avg Rating |
|---|---|---|---|---|
| Ryan | 1 | $122,818 | 129 | 4.95/5.0 |
| Matt & Elizabeth | 1 | $92,151 | 113 | 4.96/5.0 |
| Stacia | 1 | $77,340 | 22 | 5.00/5.0 |
| Marc | 1 | $46,307 | 21 | 4.95/5.0 |
| Kelly | 1 | $38,615 | 120 | 4.88/5.0 |
| Milia | 1 | $35,241 | 57 | 4.84/5.0 |
| Darrell & Joan | 1 | $33,493 | 235 | 4.89/5.0 |
| Lewis & Larissa | 1 | $31,374 | 39 | 4.95/5.0 |
| Brenda | 1 | $26,869 | 246 | 4.83/5.0 |
| Heather | 1 | $26,246 | 32 | 4.97/5.0 |
Analyzing the strategies of top hosts, such as their property selection, pricing, and guest communication, can offer valuable lessons for optimizing your own Airbnb operations in Willow Creek.
Dive Deeper: Advanced Willow Creek STR Market Data (2026)
Ready to unlock more insights? AirROI provides access to advanced metrics and comprehensive Airbnb data for Willow Creek. Explore detailed analytics beyond this report to refine your investment strategy, optimize pricing, and maximize your vacation rental profits.
Explore Advanced MetricsWillow Creek Short-Term Rental Market Composition (2026): Property & Room Types
Room Type Distribution
Property Type Distribution
Market Composition Insights for Willow Creek
- The Willow Creek Airbnb market composition is heavily skewed towards Entire Home/Apt listings, which make up 95.8% of the 24 active rentals. This indicates strong guest preference for privacy and space.
- Looking at the property type distribution in Willow Creek, House properties are the most common (75%), reflecting the local real estate landscape.
- Houses represent a significant 75% portion, catering likely to families or larger groups.
- Smaller segments like unique stays, apartment/condo (combined 8.4%) offer potential for unique stay experiences.
Willow Creek Airbnb Room Capacity Analysis (2026): Bedroom Distribution
Distribution of Listings by Number of Bedrooms
Room Capacity Insights for Willow Creek
- The dominant room capacity in Willow Creek is 3 bedrooms listings, making up 45.8% of the market. This suggests a strong demand for properties suitable for families or small groups.
- Together, 3 bedrooms and 2 bedrooms properties represent 70.8% of the active Airbnb listings in Willow Creek, indicating a high concentration in these sizes.
- A significant 54.1% of listings offer 3+ bedrooms, catering to larger groups and families seeking more space in Willow Creek.
Willow Creek Vacation Rental Guest Capacity Trends (2026)
Distribution of Listings by Guest Capacity
Guest Capacity Insights for Willow Creek
- The most common guest capacity trend in Willow Creek vacation rentals is listings accommodating 6 guests (29.2%). This suggests the primary traveler segment is likely larger groups.
- Properties designed for 6 guests and 8+ guests dominate the Willow Creek STR market, accounting for 54.2% of listings.
- 54.2% of properties accommodate 6+ guests, serving the market segment for larger families or group travel in Willow Creek.
- On average, properties in Willow Creek are equipped to host 5.3 guests.
Willow Creek Airbnb Booking Patterns (2026): Available vs. Booked Days
Available Days Distribution
Booked Days Distribution
Booking Pattern Insights for Willow Creek
- The most common availability pattern in Willow Creek falls within the 271-366 days range, representing 41.7% of listings. This suggests many properties have significant open periods on their calendars.
- Approximately 79.2% of listings show high availability (181+ days open annually), indicating potential for increased bookings or specific owner usage patterns.
- For booked days, the 91-180 days range is most frequent in Willow Creek (37.5%), reflecting common guest stay durations or potential owner blocking patterns.
- A notable 20.8% of properties secure long booking periods (181+ days booked per year), highlighting successful long-term rental strategies or significant owner usage.
Willow Creek Airbnb Minimum Stay Requirements Analysis
Distribution of Listings by Minimum Night Requirement
1 Night
6 listings
25% of total
2 Nights
8 listings
33.3% of total
3 Nights
1 listings
4.2% of total
4-6 Nights
1 listings
4.2% of total
30+ Nights
8 listings
33.3% of total
Key Insights
- The most prevalent minimum stay requirement in Willow Creek is 2 Nights, adopted by 33.3% of listings. This highlights the market's preference for shorter, flexible bookings.
- A significant segment (33.3%) caters to monthly stays (30+ nights) in Willow Creek, pointing to opportunities in the extended-stay market.
Recommendations
- Align with the market by considering a 2 Nights minimum stay, as 33.3% of Willow Creek hosts use this setting.
- If feasible, allowing 1-night stays, especially midweek or during low season, could capture last-minute bookings, as only 25% currently do.
- Explore offering discounts for stays of 30+ nights to attract the 33.3% of the market seeking extended stays.
- Adjust minimum nights based on seasonality – potentially shorter during low season and longer during peak demand periods in Willow Creek.
Willow Creek Airbnb Cancellation Policy Trends Analysis (2026)
Super Strict 30 Days
1 listings
4.2% of total
Flexible
4 listings
16.7% of total
Moderate
9 listings
37.5% of total
Firm
8 listings
33.3% of total
Strict
2 listings
8.3% of total
Cancellation Policy Insights for Willow Creek
- The prevailing Airbnb cancellation policy trend in Willow Creek is Moderate, used by 37.5% of listings.
- There's a relatively balanced mix between guest-friendly (54.2%) and stricter (41.6%) policies, offering choices for different guest needs.
- Strict cancellation policies are quite rare (8.3%), potentially making listings with this policy less competitive unless justified by high demand or property type.
Recommendations for Hosts
- Consider adopting a Moderate policy to align with the 37.5% market standard in Willow Creek.
- Using a Strict policy might deter some guests, as only 8.3% of listings use it. Evaluate if potential revenue protection outweighs possible lower booking rates.
- Regularly review your cancellation policy against competitors and market demand shifts in Willow Creek.
Willow Creek STR Booking Lead Time Analysis (2026)
Average Booking Lead Time by Month
Booking Lead Time Insights for Willow Creek
- The overall average booking lead time for vacation rentals in Willow Creek is 40 days.
- Guests book furthest in advance for stays during July (average 92 days), likely coinciding with peak travel demand or local events.
- The shortest booking windows occur for stays in February (average 9 days), indicating more last-minute travel plans during this time.
- Seasonally, Summer (79 days avg.) sees the longest lead times, while Winter (15 days avg.) has the shortest, reflecting typical travel planning cycles.
Recommendations for Hosts
- Use the overall average lead time (40 days) as a baseline for your pricing and availability strategy in Willow Creek.
- For July stays, consider implementing length-of-stay discounts or slightly higher rates for bookings made less than 92 days out to capitalize on advance planning.
- During February, focus on last-minute booking availability and promotions, as guests book with very short notice (9 days avg.).
- Target marketing efforts for the Summer season well in advance (at least 79 days) to capture early planners.
- Monitor your own booking lead times against these Willow Creek averages to identify opportunities for dynamic pricing adjustments.
Popular & Essential Airbnb Amenities in Willow Creek (2026)
Amenity Prevalence
Amenity Insights for Willow Creek
- Essential amenities in Willow Creek that guests expect include: Refrigerator, Heating, Kitchen. Lacking these (any) could significantly impact bookings.
- Popular amenities like Coffee maker, Smoke alarm, Dishes and silverware are common but not universal. Offering these can provide a competitive edge.
Recommendations for Hosts
- Ensure your listing includes all essential amenities for Willow Creek: Refrigerator, Heating, Kitchen.
- Prioritize adding missing essentials: Refrigerator, Heating, Kitchen.
- Consider adding popular differentiators like Coffee maker or Smoke alarm to increase appeal.
- Highlight unique or less common amenities you offer (e.g., hot tub, dedicated workspace, EV charger) in your listing description and photos.
- Regularly check competitor amenities in Willow Creek to stay competitive.
Willow Creek Airbnb Guest Demographics & Profile Analysis (2026)
Guest Profile Summary for Willow Creek
- The typical guest profile for Airbnb in Willow Creek consists of primarily domestic travelers (97%), often arriving from nearby Eureka, typically belonging to the Post-2000s (Gen Z/Alpha) group (50%), primarily speaking English or Spanish.
- Domestic travelers account for 97.2% of guests.
- Key international markets include United States (97.2%) and United Kingdom (1.1%).
- Top languages spoken are English (70.6%) followed by Spanish (10.8%).
- A significant demographic segment is the Post-2000s (Gen Z/Alpha) group, representing 50% of guests.
Recommendations for Hosts
- Target domestic marketing efforts towards travelers from Eureka and San Francisco.
- Tailor amenities and listing descriptions to appeal to the dominant Post-2000s (Gen Z/Alpha) demographic (e.g., highlight fast WiFi, smart home features, local guides).
- Highlight unique local experiences or amenities relevant to the primary guest profile.
- Consider seasonal promotions aligned with peak travel times for key origin markets.
Nearby Short-Term Rental Market Comparison
How does the Willow Creek Airbnb market stack up against its neighbors? Compare key performance metrics like average monthly revenue, ADR, and occupancy rates in surrounding areas to understand the broader regional STR landscape.
| Market | Active Properties | Monthly Revenue | Daily Rate | Avg. Occupancy |
|---|---|---|---|---|
| Irish Beach | 42 | $7,066 | $443.87 | 55% |
| Albion | 56 | $6,083 | $502.91 | 46% |
| Trinidad | 143 | $5,045 | $328.66 | 56% |
| Caspar | 42 | $5,016 | $410.50 | 48% |
| Shasta Lake | 23 | $4,482 | $423.63 | 47% |
| Samoa | 10 | $4,275 | $268.80 | 54% |
| Shasta County | 45 | $4,007 | $421.35 | 32% |
| Elk | 29 | $3,882 | $450.18 | 35% |
| Orick | 37 | $3,818 | $302.81 | 43% |
| Fort Bragg | 229 | $3,790 | $361.39 | 40% |