Victorville Airbnb Market Analysis 2026: Short Term Rental Data & Vacation Rental Statistics in California, United States
Is Airbnb profitable in Victorville in 2026? Explore comprehensive Airbnb analytics for Victorville, California, United States to uncover income potential. This 2026 STR market report for Victorville, based on AirROI data from February 2025 to January 2026, reveals key trends in the niche market of 123 active listings.
Whether you're considering an Airbnb investment in Victorville, optimizing your existing vacation rental, or exploring rental arbitrage opportunities, understanding the Victorville Airbnb data is crucial. Understanding the local regulations is key to maximizing your short term rental income potential. Let's dive into the specifics.
Key Victorville Airbnb Performance Metrics Overview
Monthly Airbnb Revenue Variations & Income Potential in Victorville (2026)
Understanding the monthly revenue variations for Airbnb listings in Victorville is key to maximizing your short term rental income potential. Seasonality significantly impacts earnings. Our analysis, based on data from the past 12 months, shows that the peak revenue month for STRs in Victorville is typically March, while September often presents the lowest earnings, highlighting opportunities for strategic pricing adjustments during shoulder and low seasons. Explore the typical Airbnb income in Victorville across different performance tiers:
- Best-in-class properties (Top 10%) achieve $5,561+ monthly, often utilizing dynamic pricing and superior guest experiences.
- Strong performing properties (Top 25%) earn $3,508 or more, indicating effective management and desirable locations/amenities.
- Typical properties (Median) generate around $1,701 per month, representing the average market performance.
- Entry-level properties (Bottom 25%) see earnings around $576, often with potential for optimization.
Average Monthly Airbnb Earnings Trend in Victorville
Victorville Airbnb Occupancy Rate Trends (2026)
Maximize your bookings by understanding the Victorville STR occupancy trends. Seasonal demand shifts significantly influence how often properties are booked. Typically, Februarysees the highest demand (peak season occupancy), while January experiences the lowest (low season). Effective strategies, like adjusting minimum stays or offering promotions, can boost occupancy during slower periods. Here's how different property tiers perform in Victorville:
- Best-in-class properties (Top 10%) achieve 79%+ occupancy, indicating high desirability and potentially optimized availability.
- Strong performing properties (Top 25%) maintain 60% or higher occupancy, suggesting good market fit and guest satisfaction.
- Typical properties (Median) have an occupancy rate around 40%.
- Entry-level properties (Bottom 25%) average 20% occupancy, potentially facing higher vacancy.
Average Monthly Occupancy Rate Trend in Victorville
Average Daily Rate (ADR) Airbnb Trends in Victorville (2026)
Effective short term rental pricing strategy in Victorville involves understanding monthly ADR fluctuations. The Average Daily Rate (ADR) for Airbnb in Victorville typically peaks in December and dips lowest during February. Leveraging Airbnb dynamic pricing tools or strategies based on this seasonality can significantly boost revenue. Here's a look at the typical nightly rates achieved:
- Best-in-class properties (Top 10%) command rates of $335+ per night, often due to premium features or locations.
- Strong performing properties (Top 25%) achieve nightly rates of $235 or more.
- Typical properties (Median) charge around $116 per night.
- Entry-level properties (Bottom 25%) earn around $51 per night.
Average Daily Rate (ADR) Trend by Month in Victorville
Get Live Victorville Market Intelligence 👇

Explore Real-time Analytics
Airbnb Seasonality Analysis & Trends in Victorville (2026)
Peak Season (March, April, February)
- Revenue averages $2,760 per month
- Occupancy rates average 50.4%
- Daily rates average $165
Shoulder Season
- Revenue averages $2,365 per month
- Occupancy maintains around 38.5%
- Daily rates hold near $182
Low Season (June, August, September)
- Revenue drops to average $2,152 per month
- Occupancy decreases to average 38.3%
- Daily rates adjust to average $176
Seasonality Insights for Victorville
- The Airbnb seasonality in Victorville shows moderate seasonality with distinct peak and low periods. While the sections above show seasonal averages, it's also insightful to look at the extremes:
- During the high season, the absolute peak month showcases Victorville's highest earning potential, with monthly revenues capable of climbing to $3,003, occupancy reaching a high of 53.2%, and ADRs peaking at $189.
- Conversely, the slowest single month of the year, typically falling within the low season, marks the market's lowest point. In this month, revenue might dip to $1,931, occupancy could drop to 34.9%, and ADRs may adjust down to $156.
- Understanding both the seasonal averages and these monthly peaks and troughs in revenue, occupancy, and ADR is crucial for maximizing your Airbnb profit potential in Victorville.
Seasonal Strategies for Maximizing Profit
- Peak Season: Maximize revenue through premium pricing and potentially longer minimum stays. Ensure high availability.
- Low Season: Offer competitive pricing, special promotions (e.g., extended stay discounts), and flexible cancellation policies. Target off-season travelers like remote workers or budget-conscious guests.
- Shoulder Seasons: Implement dynamic pricing that balances peak and low rates. Target weekend travelers or specific events. Offer slightly more flexible terms than peak season.
- Regularly analyze your own performance against these Victorville seasonality benchmarks and adjust your pricing and availability strategy accordingly.
Best Areas for Airbnb Investment in Victorville (2026)
Exploring the top neighborhoods for short-term rentals in Victorville? This section highlights key areas, outlining why they are attractive for hosts and guests, along with notable local attractions. Consider these locations based on your target guest profile and investment strategy.
| Neighborhood / Area | Why Host Here? (Target Guests & Appeal) | Key Attractions & Landmarks |
|---|---|---|
| Downtown Victorville | The heart of Victorville, offering a mix of local shops, restaurants, and entertainment options. It's a convenient location for guests seeking access to the city’s amenities and public transportation. | Victorville City Hall, Historic Route 66, Victor Valley Museum, Civic Center Park, California Route 66 Museum |
| Victorville Mall Area | A shopping hub with a variety of stores and dining options. Perfect for guests who want to stay close to retail and are looking for family-friendly accommodations. | Victorville Mall, Regal Cinemas Victorville, Buffalo Wild Wings, Costco, Target |
| Apple Valley | A nearby town that shares proximity with Victorville, known for its residential neighborhoods and outdoor activities. Appeals to those looking for a quieter stay with nature access. | Apple Valley Golf Course, Jess Ranch Marketplace, Apple Valley Lake, Horsemen's Center, St. Mary's Medical Center |
| Spring Valley Lake | A picturesque community area with a lake offering recreational activities. Appeals to guests looking for a relaxing getaway surrounded by nature. | Spring Valley Lake, Spring Valley Lake Community Center, Walking paths, Picnic areas, Fishing opportunities |
| Old Town Victorville | A historical district showcasing Victorville’s rich history and quaint shops. Attracts visitors interested in culture and heritage. | Old Town Theatre, Historic buildings, Unique boutiques, Local art shops, Community events |
| Hesperia | Adjacent to Victorville, this area is often overlooked but offers affordable lodging and access to the beautiful High Desert. | Hesperia Lakes, Civic Plaza Park, Hesperia Golf and Country Club, Lake Hesperia, Pioneer Park |
| North Victorville | A quieter suburban area that is still close to commercial hubs. Ideal for families and longer-term stays. | Newly developed residential areas, Parks and recreation centers, Community events, Victorville Sports Complex, Schools |
| High Desert | The broader High Desert area includes various attractions and outdoor activities, appealing to adventure seekers and nature lovers. | Mojave National Preserve, Apple Valley and Hesperia hiking trails, Outdoor sports, Antelope Valley Poppy Reserve, Joshua Tree National Park nearby |
Understanding Airbnb License Requirements & STR Laws in Victorville (2026)
With 15% of listings showing registration in 2026, understanding potential Airbnb license requirements is crucial in Victorville. Always verify the latest short term rental regulations and Airbnb license requirements directly with local government authorities for Victorville to ensure full compliance before hosting.
(Source: AirROI data, 2026, based on 15% licensed listings)
Top Performing Airbnb Properties in Victorville (2026)
Benchmark your potential! Explore examples of top-performing Airbnb properties in Victorvillebased on Trailing Twelve Month (TTM) revenue. Analyze their characteristics, revenue, occupancy rate, and ADR to understand what drives success in this market.
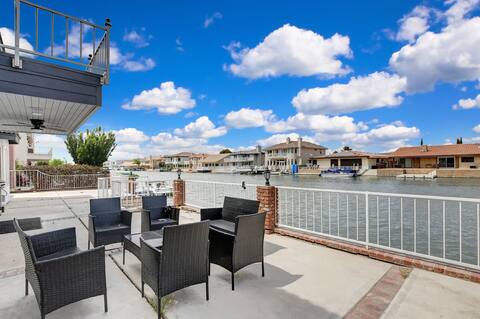
Lakefront Lakehouse Retreat
Entire Place • 4 bedrooms
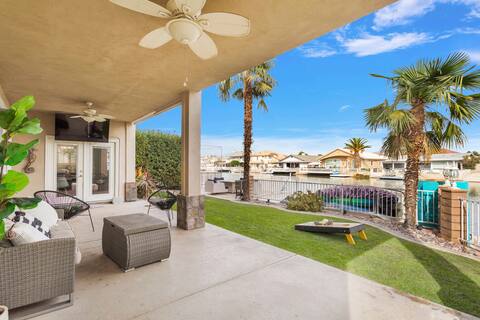
Lakefront Serenity Retreat
Entire Place • 6 bedrooms

Lakefront Oasis on The Open Water
Entire Place • 4 bedrooms

Harbor Haven Lakehouse
Entire Place • 4 bedrooms
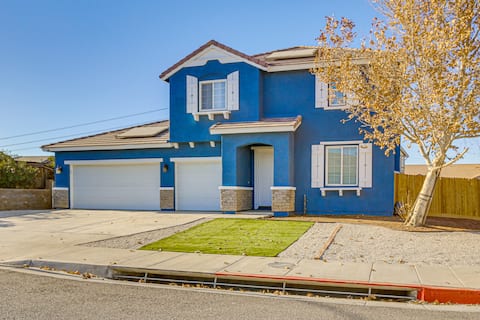
Pool Table & Charcoal Grill: Home in Victorville!
Entire Place • 5 bedrooms
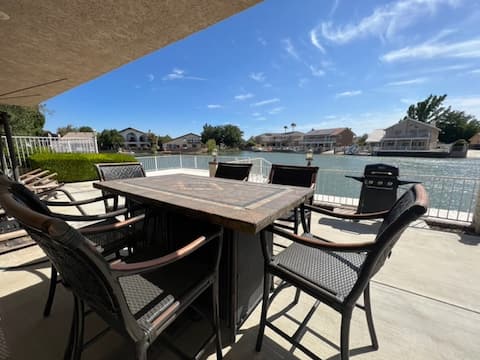
Lakefront Spring Valley Lake - Hot Tub No Parties!
Entire Place • 4 bedrooms
Note: Performance varies based on location, size, amenities, seasonality, and management quality. Data reflects the past 12 months.
Top Performing Airbnb Hosts in Victorville (2026)
Learn from the best! This table showcases top-performing Airbnb hosts in Victorville based on the number of properties managed and estimated total revenue over the past year. Analyze their scale and performance metrics.
| Host Name | Properties | Grossing Revenue | Stay Reviews | Avg Rating |
|---|---|---|---|---|
| Evolve | 5 | $166,332 | 60 | 4.80/5.0 |
| Chuck | 2 | $136,806 | 283 | 4.95/5.0 |
| Marion | 3 | $99,790 | 130 | 4.77/5.0 |
| Paul | 1 | $83,106 | 91 | 4.90/5.0 |
| Mike | 1 | $79,746 | 38 | 5.00/5.0 |
| Carol Ann | 1 | $75,903 | 37 | 4.97/5.0 |
| Barbara | 1 | $67,857 | 33 | 5.00/5.0 |
| Victor | 1 | $54,493 | 38 | 4.74/5.0 |
| Sarah | 1 | $54,055 | 143 | 4.97/5.0 |
| Grace | 3 | $52,985 | 82 | 4.01/5.0 |
Analyzing the strategies of top hosts, such as their property selection, pricing, and guest communication, can offer valuable lessons for optimizing your own Airbnb operations in Victorville.
Dive Deeper: Advanced Victorville STR Market Data (2026)
Ready to unlock more insights? AirROI provides access to advanced metrics and comprehensive Airbnb data for Victorville. Explore detailed analytics beyond this report to refine your investment strategy, optimize pricing, and maximize your vacation rental profits.
Explore Advanced MetricsVictorville Short-Term Rental Market Composition (2026): Property & Room Types
Room Type Distribution
Property Type Distribution
Market Composition Insights for Victorville
- The Victorville Airbnb market composition is heavily skewed towards Entire Home/Apt listings, which make up 62.6% of the 123 active rentals. This indicates strong guest preference for privacy and space.
- However, a notable 37.4% share for Private Rooms suggests opportunities for budget-conscious travelers or hosts renting out spare rooms.
- Looking at the property type distribution in Victorville, House properties are the most common (82.1%), reflecting the local real estate landscape.
- Houses represent a significant 82.1% portion, catering likely to families or larger groups.
- The presence of 6.5% Hotel/Boutique listings indicates integration with traditional hospitality.
- Smaller segments like others, apartment/condo, outdoor/unique (combined 11.4%) offer potential for unique stay experiences.
Victorville Airbnb Room Capacity Analysis (2026): Bedroom Distribution
Distribution of Listings by Number of Bedrooms
Room Capacity Insights for Victorville
- The dominant room capacity in Victorville is 4 bedrooms listings, making up 22.8% of the market. This suggests a strong demand for properties suitable for families or small groups.
- Together, 4 bedrooms and 3 bedrooms properties represent 39.1% of the active Airbnb listings in Victorville, indicating a high concentration in these sizes.
- A significant 45.6% of listings offer 3+ bedrooms, catering to larger groups and families seeking more space in Victorville.
Victorville Vacation Rental Guest Capacity Trends (2026)
Distribution of Listings by Guest Capacity
Guest Capacity Insights for Victorville
- The most common guest capacity trend in Victorville vacation rentals is listings accommodating 8+ guests (32.5%). This suggests the primary traveler segment is likely larger groups.
- Properties designed for 8+ guests and 6 guests dominate the Victorville STR market, accounting for 43.1% of listings.
- 46.4% of properties accommodate 6+ guests, serving the market segment for larger families or group travel in Victorville.
- On average, properties in Victorville are equipped to host 4.0 guests.
Victorville Airbnb Booking Patterns (2026): Available vs. Booked Days
Available Days Distribution
Booked Days Distribution
Booking Pattern Insights for Victorville
- The most common availability pattern in Victorville falls within the 271-366 days range, representing 50.4% of listings. This suggests many properties have significant open periods on their calendars.
- Approximately 84.5% of listings show high availability (181+ days open annually), indicating potential for increased bookings or specific owner usage patterns.
- For booked days, the 91-180 days range is most frequent in Victorville (35%), reflecting common guest stay durations or potential owner blocking patterns.
- A notable 16.2% of properties secure long booking periods (181+ days booked per year), highlighting successful long-term rental strategies or significant owner usage.
Victorville Airbnb Minimum Stay Requirements Analysis
Distribution of Listings by Minimum Night Requirement
1 Night
37 listings
30.1% of total
2 Nights
25 listings
20.3% of total
3 Nights
6 listings
4.9% of total
4-6 Nights
7 listings
5.7% of total
7-29 Nights
13 listings
10.6% of total
30+ Nights
35 listings
28.5% of total
Key Insights
- The most prevalent minimum stay requirement in Victorville is 1 Night, adopted by 30.1% of listings. This highlights the market's preference for shorter, flexible bookings.
- A significant segment (28.5%) caters to monthly stays (30+ nights) in Victorville, pointing to opportunities in the extended-stay market.
Recommendations
- Align with the market by considering a 1 Night minimum stay, as 30.1% of Victorville hosts use this setting.
- Explore offering discounts for stays of 30+ nights to attract the 28.5% of the market seeking extended stays.
- Adjust minimum nights based on seasonality – potentially shorter during low season and longer during peak demand periods in Victorville.
Victorville Airbnb Cancellation Policy Trends Analysis (2026)
Limited
1 listings
0.8% of total
Super Strict 30 Days
1 listings
0.8% of total
Flexible
31 listings
25.2% of total
Moderate
39 listings
31.7% of total
Firm
33 listings
26.8% of total
Strict
18 listings
14.6% of total
Cancellation Policy Insights for Victorville
- The prevailing Airbnb cancellation policy trend in Victorville is Moderate, used by 31.7% of listings.
- There's a relatively balanced mix between guest-friendly (56.9%) and stricter (41.4%) policies, offering choices for different guest needs.
Recommendations for Hosts
- Consider adopting a Moderate policy to align with the 31.7% market standard in Victorville.
- Using a Strict policy might deter some guests, as only 14.6% of listings use it. Evaluate if potential revenue protection outweighs possible lower booking rates.
- Regularly review your cancellation policy against competitors and market demand shifts in Victorville.
Victorville STR Booking Lead Time Analysis (2026)
Average Booking Lead Time by Month
Booking Lead Time Insights for Victorville
- The overall average booking lead time for vacation rentals in Victorville is 19 days.
- Guests book furthest in advance for stays during June (average 26 days), likely coinciding with peak travel demand or local events.
- The shortest booking windows occur for stays in February (average 15 days), indicating more last-minute travel plans during this time.
- Seasonally, Summer (22 days avg.) sees the longest lead times, while Winter (17 days avg.) has the shortest, reflecting typical travel planning cycles.
Recommendations for Hosts
- Use the overall average lead time (19 days) as a baseline for your pricing and availability strategy in Victorville.
- Target marketing efforts for the Summer season well in advance (at least 22 days) to capture early planners.
- Monitor your own booking lead times against these Victorville averages to identify opportunities for dynamic pricing adjustments.
Popular & Essential Airbnb Amenities in Victorville (2026)
Amenity Prevalence
Amenity Insights for Victorville
- Essential amenities in Victorville that guests expect include: Wifi, Air conditioning, Smoke alarm, TV, Carbon monoxide alarm. Lacking these (any) could significantly impact bookings.
- Popular amenities like Free parking on premises, Heating, Kitchen are common but not universal. Offering these can provide a competitive edge.
Recommendations for Hosts
- Ensure your listing includes all essential amenities for Victorville: Wifi, Air conditioning, Smoke alarm, TV, Carbon monoxide alarm.
- Prioritize adding missing essentials: Wifi, Air conditioning, Smoke alarm, TV, Carbon monoxide alarm.
- Consider adding popular differentiators like Free parking on premises or Heating to increase appeal.
- Highlight unique or less common amenities you offer (e.g., hot tub, dedicated workspace, EV charger) in your listing description and photos.
- Regularly check competitor amenities in Victorville to stay competitive.
Victorville Airbnb Guest Demographics & Profile Analysis (2026)
Guest Profile Summary for Victorville
- The typical guest profile for Airbnb in Victorville consists of primarily domestic travelers (93%), often arriving from nearby Los Angeles, typically belonging to the Post-2000s (Gen Z/Alpha) group (50%), primarily speaking English or Spanish.
- Domestic travelers account for 93.2% of guests.
- Key international markets include United States (93.2%) and Philippines (1.6%).
- Top languages spoken are English (64.7%) followed by Spanish (22.7%).
- A significant demographic segment is the Post-2000s (Gen Z/Alpha) group, representing 50% of guests.
Recommendations for Hosts
- Target domestic marketing efforts towards travelers from Los Angeles and Victorville.
- Tailor amenities and listing descriptions to appeal to the dominant Post-2000s (Gen Z/Alpha) demographic (e.g., highlight fast WiFi, smart home features, local guides).
- Highlight unique local experiences or amenities relevant to the primary guest profile.
- Consider seasonal promotions aligned with peak travel times for key origin markets.
Nearby Short-Term Rental Market Comparison
How does the Victorville Airbnb market stack up against its neighbors? Compare key performance metrics like average monthly revenue, ADR, and occupancy rates in surrounding areas to understand the broader regional STR landscape.
| Market | Active Properties | Monthly Revenue | Daily Rate | Avg. Occupancy |
|---|---|---|---|---|
| Newport Beach | 1,273 | $8,950 | $744.06 | 47% |
| Malibu | 251 | $8,293 | $1263.89 | 35% |
| Thousand Palms | 33 | $8,119 | $725.48 | 36% |
| Manhattan Beach | 267 | $7,875 | $585.30 | 53% |
| GlenOak Hills | 41 | $7,394 | $648.65 | 41% |
| Bermuda Dunes | 143 | $7,324 | $664.90 | 39% |
| Avalon | 249 | $6,705 | $696.60 | 38% |
| Rancho Santa Fe | 34 | $6,074 | $913.16 | 35% |
| Unincorporated Santa Monica Mountains | 119 | $6,008 | $699.60 | 38% |
| Encinitas | 559 | $5,940 | $543.93 | 49% |