Ventura Airbnb Market Analysis 2026: Short Term Rental Data & Vacation Rental Statistics in California, United States
Is Airbnb profitable in Ventura in 2026? Explore comprehensive Airbnb analytics for Ventura, California, United States to uncover income potential. This 2026 STR market report for Ventura, based on AirROI data from February 2025 to January 2026, reveals key trends in the market of 303 active listings.
Whether you're considering an Airbnb investment in Ventura, optimizing your existing vacation rental, or exploring rental arbitrage opportunities, understanding the Ventura Airbnb data is crucial. Leveraging the low regulation environment is key to maximizing your short term rental income potential. Let's dive into the specifics.
Key Ventura Airbnb Performance Metrics Overview
Monthly Airbnb Revenue Variations & Income Potential in Ventura (2026)
Understanding the monthly revenue variations for Airbnb listings in Ventura is key to maximizing your short term rental income potential. Seasonality significantly impacts earnings. Our analysis, based on data from the past 12 months, shows that the peak revenue month for STRs in Ventura is typically July, while January often presents the lowest earnings, highlighting opportunities for strategic pricing adjustments during shoulder and low seasons. Explore the typical Airbnb income in Ventura across different performance tiers:
- Best-in-class properties (Top 10%) achieve $11,639+ monthly, often utilizing dynamic pricing and superior guest experiences.
- Strong performing properties (Top 25%) earn $7,486 or more, indicating effective management and desirable locations/amenities.
- Typical properties (Median) generate around $4,445 per month, representing the average market performance.
- Entry-level properties (Bottom 25%) see earnings around $2,334, often with potential for optimization.
Average Monthly Airbnb Earnings Trend in Ventura
Ventura Airbnb Occupancy Rate Trends (2026)
Maximize your bookings by understanding the Ventura STR occupancy trends. Seasonal demand shifts significantly influence how often properties are booked. Typically, Julysees the highest demand (peak season occupancy), while January experiences the lowest (low season). Effective strategies, like adjusting minimum stays or offering promotions, can boost occupancy during slower periods. Here's how different property tiers perform in Ventura:
- Best-in-class properties (Top 10%) achieve 86%+ occupancy, indicating high desirability and potentially optimized availability.
- Strong performing properties (Top 25%) maintain 71% or higher occupancy, suggesting good market fit and guest satisfaction.
- Typical properties (Median) have an occupancy rate around 52%.
- Entry-level properties (Bottom 25%) average 29% occupancy, potentially facing higher vacancy.
Average Monthly Occupancy Rate Trend in Ventura
Average Daily Rate (ADR) Airbnb Trends in Ventura (2026)
Effective short term rental pricing strategy in Ventura involves understanding monthly ADR fluctuations. The Average Daily Rate (ADR) for Airbnb in Ventura typically peaks in June and dips lowest during February. Leveraging Airbnb dynamic pricing tools or strategies based on this seasonality can significantly boost revenue. Here's a look at the typical nightly rates achieved:
- Best-in-class properties (Top 10%) command rates of $690+ per night, often due to premium features or locations.
- Strong performing properties (Top 25%) achieve nightly rates of $424 or more.
- Typical properties (Median) charge around $275 per night.
- Entry-level properties (Bottom 25%) earn around $155 per night.
Average Daily Rate (ADR) Trend by Month in Ventura
Get Live Ventura Market Intelligence 👇

Explore Real-time Analytics
Airbnb Seasonality Analysis & Trends in Ventura (2026)
Peak Season (July, August, June)
- Revenue averages $7,783 per month
- Occupancy rates average 59.6%
- Daily rates average $362
Shoulder Season
- Revenue averages $5,409 per month
- Occupancy maintains around 48.9%
- Daily rates hold near $342
Low Season (January, February, September)
- Revenue drops to average $4,244 per month
- Occupancy decreases to average 44.6%
- Daily rates adjust to average $326
Seasonality Insights for Ventura
- The Airbnb seasonality in Ventura shows highly seasonal trends requiring careful strategy. While the sections above show seasonal averages, it's also insightful to look at the extremes:
- During the high season, the absolute peak month showcases Ventura's highest earning potential, with monthly revenues capable of climbing to $8,647, occupancy reaching a high of 63.6%, and ADRs peaking at $370.
- Conversely, the slowest single month of the year, typically falling within the low season, marks the market's lowest point. In this month, revenue might dip to $3,699, occupancy could drop to 38.1%, and ADRs may adjust down to $304.
- Understanding both the seasonal averages and these monthly peaks and troughs in revenue, occupancy, and ADR is crucial for maximizing your Airbnb profit potential in Ventura.
Seasonal Strategies for Maximizing Profit
- Peak Season: Maximize revenue through premium pricing and potentially longer minimum stays. Ensure high availability.
- Low Season: Offer competitive pricing, special promotions (e.g., extended stay discounts), and flexible cancellation policies. Target off-season travelers like remote workers or budget-conscious guests.
- Shoulder Seasons: Implement dynamic pricing that balances peak and low rates. Target weekend travelers or specific events. Offer slightly more flexible terms than peak season.
- Regularly analyze your own performance against these Ventura seasonality benchmarks and adjust your pricing and availability strategy accordingly.
Best Areas for Airbnb Investment in Ventura (2026)
Exploring the top neighborhoods for short-term rentals in Ventura? This section highlights key areas, outlining why they are attractive for hosts and guests, along with notable local attractions. Consider these locations based on your target guest profile and investment strategy.
| Neighborhood / Area | Why Host Here? (Target Guests & Appeal) | Key Attractions & Landmarks |
|---|---|---|
| Ventura Pier | A popular spot for tourists with beautiful ocean views, fishing, and access to local restaurants. Ideal for hosting Airbnbs seeking waterfront experiences. | Ventura Harbor, Ventura Pier, Mission San Buenaventura, Ventura Beach, Promenade Park |
| San Buenaventura State Beach | A family-friendly beach destination with miles of sandy shoreline, perfect for sunbathing and water activities. Strong appeal for beachgoers and families. | San Buenaventura State Beach, Surfers Point, California State University Channel Islands, Beach Volleyball Courts, Picnic Areas |
| Historic Downtown Ventura | Charming downtown area filled with boutique shops, eateries, and cultural events. Attracts visitors looking for a taste of local history and vibrant culture. | Ventura County Fairgrounds, Rubicon Theatre Company, Camarillo Ranch House, Historic Plaza Park, Ventura Botanical Gardens |
| Westside Ventura | A residential area known for its local vibe and proximity to the beach. Offers a more laid-back experience and attracts families and couples. | Westside Park, Family-friendly cafes, Local shops, Quick access to beaches, Community events |
| The Ventura Oaks | A peaceful neighborhood near the mountains, great for outdoor enthusiasts who love hiking and biking, offers a different experience from the beach. | Los Padres National Forest, Ventura River Trail, Toby's Feed Barn, Nature hikes, Biking trails |
| Fairgrounds Area | Close to the Ventura County Fairgrounds, this area is great for event attendees and fair visitors, ideal for short-term rentals during events. | Ventura County Fair, Concerts and events at fairgrounds, Local food vendors, Cultural festivals, Easy access to downtown |
| East End Ventura | A quieter area with spacious homes and parks, suitable for families and long-term stays, away from the hustle of the beach. | Hiking trails, Parks, Local grocery stores, Family-friendly schools, Community parks |
| Ventura Harbor | Located near the marina, this area is popular for boating, dining, and magical sunsets, making it a picturesque spot for vacationers. | Ventura Harbor Village, Boating and fishing tours, Beach and water sports, Restaurants with seaside views, Art galleries |
Understanding Airbnb License Requirements & STR Laws in Ventura (2026)
While Ventura, California, United States currently shows low STR regulations, specific Airbnb license requirements might still exist or change. Always verify the latest short term rental regulations and Airbnb license requirements directly with local government authorities for Ventura to ensure full compliance before hosting.
(Source: AirROI data, 2026, finding no licensed listings among those analyzed)
Top Performing Airbnb Properties in Ventura (2026)
Benchmark your potential! Explore examples of top-performing Airbnb properties in Venturabased on Trailing Twelve Month (TTM) revenue. Analyze their characteristics, revenue, occupancy rate, and ADR to understand what drives success in this market.
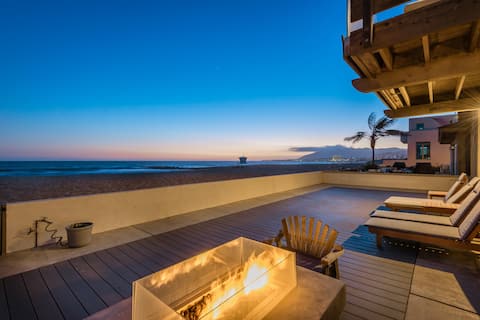
Oceanfront Luxury w/ Pool, Firepits & Gym
Entire Place • 5 bedrooms

Seascape - Beachfront Splendor in Mussel Shoals
Entire Place • 3 bedrooms
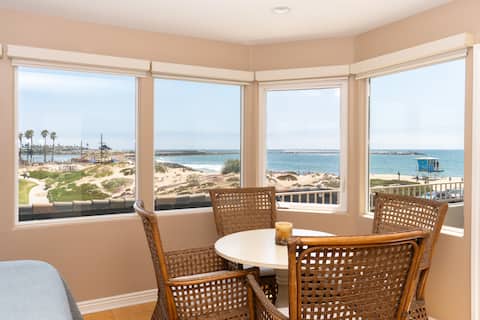
Seacliff Beach Retreat – Amazing Beachfront for 6
Entire Place • 3 bedrooms
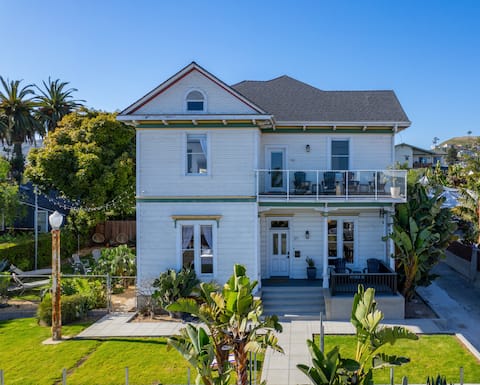
Historic Victorian Beach House (The Sudden House)
Entire Place • 5 bedrooms
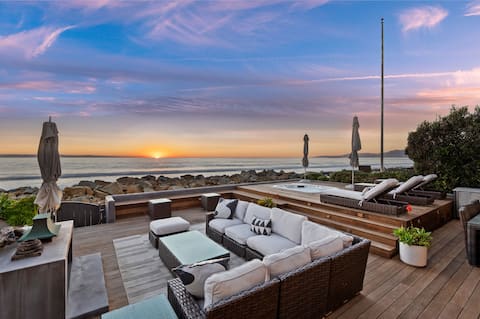
Contemporary Beach House with Expansive Ocean View
Entire Place • 5 bedrooms

Sandy Cove House on Faria beach
Entire Place • 3 bedrooms
Note: Performance varies based on location, size, amenities, seasonality, and management quality. Data reflects the past 12 months.
Top Performing Airbnb Hosts in Ventura (2026)
Learn from the best! This table showcases top-performing Airbnb hosts in Ventura based on the number of properties managed and estimated total revenue over the past year. Analyze their scale and performance metrics.
| Host Name | Properties | Grossing Revenue | Stay Reviews | Avg Rating |
|---|---|---|---|---|
| SunnyDays | 20 | $1,241,685 | 405 | 4.63/5.0 |
| Sandy Shores Realty | 10 | $723,564 | 481 | 4.75/5.0 |
| Lisa | 8 | $696,521 | 555 | 4.92/5.0 |
| Paradise Retreats | 5 | $595,489 | 59 | 4.67/5.0 |
| REMAX Gold Coast | 5 | $402,671 | 95 | 4.77/5.0 |
| Sarah | 6 | $340,980 | 447 | 4.95/5.0 |
| Paran | 1 | $333,604 | 93 | 5.00/5.0 |
| Grand Welcome Vacation Rentals | 1 | $290,134 | 18 | 4.89/5.0 |
| Shelley | 1 | $229,846 | 43 | 5.00/5.0 |
| Jayne | 1 | $212,811 | 101 | 4.99/5.0 |
Analyzing the strategies of top hosts, such as their property selection, pricing, and guest communication, can offer valuable lessons for optimizing your own Airbnb operations in Ventura.
Dive Deeper: Advanced Ventura STR Market Data (2026)
Ready to unlock more insights? AirROI provides access to advanced metrics and comprehensive Airbnb data for Ventura. Explore detailed analytics beyond this report to refine your investment strategy, optimize pricing, and maximize your vacation rental profits.
Explore Advanced MetricsVentura Short-Term Rental Market Composition (2026): Property & Room Types
Room Type Distribution
Property Type Distribution
Market Composition Insights for Ventura
- The Ventura Airbnb market composition is heavily skewed towards Entire Home/Apt listings, which make up 89.8% of the 303 active rentals. This indicates strong guest preference for privacy and space.
- Looking at the property type distribution in Ventura, House properties are the most common (76.2%), reflecting the local real estate landscape.
- Houses represent a significant 76.2% portion, catering likely to families or larger groups.
- The presence of 7.3% Hotel/Boutique listings indicates integration with traditional hospitality.
- Smaller segments like others, outdoor/unique (combined 4.0%) offer potential for unique stay experiences.
Ventura Airbnb Room Capacity Analysis (2026): Bedroom Distribution
Distribution of Listings by Number of Bedrooms
Room Capacity Insights for Ventura
- The dominant room capacity in Ventura is 2 bedrooms listings, making up 29% of the market. This suggests a strong demand for properties suitable for couples or solo travelers.
- Together, 2 bedrooms and 3 bedrooms properties represent 55.7% of the active Airbnb listings in Ventura, indicating a high concentration in these sizes.
- A significant 37.3% of listings offer 3+ bedrooms, catering to larger groups and families seeking more space in Ventura.
Ventura Vacation Rental Guest Capacity Trends (2026)
Distribution of Listings by Guest Capacity
Guest Capacity Insights for Ventura
- The most common guest capacity trend in Ventura vacation rentals is listings accommodating 6 guests (22.8%). This suggests the primary traveler segment is likely larger groups.
- Properties designed for 6 guests and 4 guests dominate the Ventura STR market, accounting for 44.9% of listings.
- 46.3% of properties accommodate 6+ guests, serving the market segment for larger families or group travel in Ventura.
- On average, properties in Ventura are equipped to host 4.7 guests.
Ventura Airbnb Booking Patterns (2026): Available vs. Booked Days
Available Days Distribution
Booked Days Distribution
Booking Pattern Insights for Ventura
- The most common availability pattern in Ventura falls within the 271-366 days range, representing 33.7% of listings. This suggests many properties have significant open periods on their calendars.
- Approximately 66.0% of listings show high availability (181+ days open annually), indicating potential for increased bookings or specific owner usage patterns.
- For booked days, the 91-180 days range is most frequent in Ventura (32%), reflecting common guest stay durations or potential owner blocking patterns.
- A notable 36.3% of properties secure long booking periods (181+ days booked per year), highlighting successful long-term rental strategies or significant owner usage.
Ventura Airbnb Minimum Stay Requirements Analysis
Distribution of Listings by Minimum Night Requirement
1 Night
28 listings
9.2% of total
2 Nights
72 listings
23.8% of total
3 Nights
27 listings
8.9% of total
4-6 Nights
12 listings
4% of total
7-29 Nights
31 listings
10.2% of total
30+ Nights
133 listings
43.9% of total
Key Insights
- The most prevalent minimum stay requirement in Ventura is 30+ Nights, adopted by 43.9% of listings. This highlights the market's preference for longer commitments.
- A significant segment (43.9%) caters to monthly stays (30+ nights) in Ventura, pointing to opportunities in the extended-stay market.
Recommendations
- Align with the market by considering a 30+ Nights minimum stay, as 43.9% of Ventura hosts use this setting.
- If feasible, allowing 1-night stays, especially midweek or during low season, could capture last-minute bookings, as only 9.2% currently do.
- Explore offering discounts for stays of 30+ nights to attract the 43.9% of the market seeking extended stays.
- Adjust minimum nights based on seasonality – potentially shorter during low season and longer during peak demand periods in Ventura.
Ventura Airbnb Cancellation Policy Trends Analysis (2026)
Super Strict 60 Days
8 listings
2.6% of total
Super Strict 30 Days
30 listings
9.9% of total
Limited
1 listings
0.3% of total
Flexible
29 listings
9.6% of total
Moderate
75 listings
24.8% of total
Firm
124 listings
40.9% of total
Strict
36 listings
11.9% of total
Cancellation Policy Insights for Ventura
- The prevailing Airbnb cancellation policy trend in Ventura is Firm, used by 40.9% of listings.
- A majority (52.8%) of hosts in Ventura utilize Firm or Strict policies, indicating a market where hosts prioritize booking security.
Recommendations for Hosts
- Consider adopting a Firm policy to align with the 40.9% market standard in Ventura.
- Using a Strict policy might deter some guests, as only 11.9% of listings use it. Evaluate if potential revenue protection outweighs possible lower booking rates.
- Regularly review your cancellation policy against competitors and market demand shifts in Ventura.
Ventura STR Booking Lead Time Analysis (2026)
Average Booking Lead Time by Month
Booking Lead Time Insights for Ventura
- The overall average booking lead time for vacation rentals in Ventura is 47 days.
- Guests book furthest in advance for stays during July (average 64 days), likely coinciding with peak travel demand or local events.
- The shortest booking windows occur for stays in January (average 32 days), indicating more last-minute travel plans during this time.
- Seasonally, Summer (59 days avg.) sees the longest lead times, while Winter (41 days avg.) has the shortest, reflecting typical travel planning cycles.
Recommendations for Hosts
- Use the overall average lead time (47 days) as a baseline for your pricing and availability strategy in Ventura.
- For July stays, consider implementing length-of-stay discounts or slightly higher rates for bookings made less than 64 days out to capitalize on advance planning.
- Target marketing efforts for the Summer season well in advance (at least 59 days) to capture early planners.
- Monitor your own booking lead times against these Ventura averages to identify opportunities for dynamic pricing adjustments.
Popular & Essential Airbnb Amenities in Ventura (2026)
Amenity Prevalence
Amenity Insights for Ventura
- Essential amenities in Ventura that guests expect include: Wifi, Smoke alarm, Carbon monoxide alarm. Lacking these (any) could significantly impact bookings.
- Popular amenities like Kitchen, TV, Heating are common but not universal. Offering these can provide a competitive edge.
Recommendations for Hosts
- Ensure your listing includes all essential amenities for Ventura: Wifi, Smoke alarm, Carbon monoxide alarm.
- Prioritize adding missing essentials: Wifi, Smoke alarm, Carbon monoxide alarm.
- Consider adding popular differentiators like Kitchen or TV to increase appeal.
- Highlight unique or less common amenities you offer (e.g., hot tub, dedicated workspace, EV charger) in your listing description and photos.
- Regularly check competitor amenities in Ventura to stay competitive.
Ventura Airbnb Guest Demographics & Profile Analysis (2026)
Guest Profile Summary for Ventura
- The typical guest profile for Airbnb in Ventura consists of primarily domestic travelers (94%), often arriving from nearby Los Angeles, typically belonging to the Post-2000s (Gen Z/Alpha) group (50%), primarily speaking English or Spanish.
- Domestic travelers account for 94.1% of guests.
- Key international markets include United States (94.1%) and United Kingdom (1.1%).
- Top languages spoken are English (64.7%) followed by Spanish (15.6%).
- A significant demographic segment is the Post-2000s (Gen Z/Alpha) group, representing 50% of guests.
Recommendations for Hosts
- Target domestic marketing efforts towards travelers from Los Angeles and San Diego.
- Tailor amenities and listing descriptions to appeal to the dominant Post-2000s (Gen Z/Alpha) demographic (e.g., highlight fast WiFi, smart home features, local guides).
- Highlight unique local experiences or amenities relevant to the primary guest profile.
- Consider seasonal promotions aligned with peak travel times for key origin markets.
Nearby Short-Term Rental Market Comparison
How does the Ventura Airbnb market stack up against its neighbors? Compare key performance metrics like average monthly revenue, ADR, and occupancy rates in surrounding areas to understand the broader regional STR landscape.
| Market | Active Properties | Monthly Revenue | Daily Rate | Avg. Occupancy |
|---|---|---|---|---|
| Montecito | 127 | $10,744 | $950.35 | 51% |
| Malibu | 251 | $8,293 | $1263.89 | 35% |
| Manhattan Beach | 267 | $7,875 | $585.30 | 53% |
| Los Olivos | 30 | $7,240 | $705.20 | 43% |
| Santa Ynez | 119 | $6,967 | $589.34 | 42% |
| Toro Canyon | 33 | $6,935 | $717.58 | 42% |
| Avila Beach | 94 | $6,770 | $582.34 | 41% |
| Avalon | 249 | $6,705 | $696.60 | 38% |
| Summerland | 88 | $6,323 | $494.72 | 49% |
| Unincorporated Santa Monica Mountains | 119 | $6,008 | $699.60 | 38% |