Three Rivers Airbnb Market Analysis 2026: Short Term Rental Data & Vacation Rental Statistics in California, United States
Is Airbnb profitable in Three Rivers in 2026? Explore comprehensive Airbnb analytics for Three Rivers, California, United States to uncover income potential. This 2026 STR market report for Three Rivers, based on AirROI data from February 2025 to January 2026, reveals key trends in the market of 407 active listings.
Whether you're considering an Airbnb investment in Three Rivers, optimizing your existing vacation rental, or exploring rental arbitrage opportunities, understanding the Three Rivers Airbnb data is crucial. Leveraging the low regulation environment is key to maximizing your short term rental income potential. Let's dive into the specifics.
Key Three Rivers Airbnb Performance Metrics Overview
Monthly Airbnb Revenue Variations & Income Potential in Three Rivers (2026)
Understanding the monthly revenue variations for Airbnb listings in Three Rivers is key to maximizing your short term rental income potential. Seasonality significantly impacts earnings. Our analysis, based on data from the past 12 months, shows that the peak revenue month for STRs in Three Rivers is typically July, while February often presents the lowest earnings, highlighting opportunities for strategic pricing adjustments during shoulder and low seasons. Explore the typical Airbnb income in Three Rivers across different performance tiers:
- Best-in-class properties (Top 10%) achieve $10,901+ monthly, often utilizing dynamic pricing and superior guest experiences.
- Strong performing properties (Top 25%) earn $7,814 or more, indicating effective management and desirable locations/amenities.
- Typical properties (Median) generate around $5,107 per month, representing the average market performance.
- Entry-level properties (Bottom 25%) see earnings around $3,169, often with potential for optimization.
Average Monthly Airbnb Earnings Trend in Three Rivers
Three Rivers Airbnb Occupancy Rate Trends (2026)
Maximize your bookings by understanding the Three Rivers STR occupancy trends. Seasonal demand shifts significantly influence how often properties are booked. Typically, Julysees the highest demand (peak season occupancy), while January experiences the lowest (low season). Effective strategies, like adjusting minimum stays or offering promotions, can boost occupancy during slower periods. Here's how different property tiers perform in Three Rivers:
- Best-in-class properties (Top 10%) achieve 81%+ occupancy, indicating high desirability and potentially optimized availability.
- Strong performing properties (Top 25%) maintain 69% or higher occupancy, suggesting good market fit and guest satisfaction.
- Typical properties (Median) have an occupancy rate around 52%.
- Entry-level properties (Bottom 25%) average 33% occupancy, potentially facing higher vacancy.
Average Monthly Occupancy Rate Trend in Three Rivers
Average Daily Rate (ADR) Airbnb Trends in Three Rivers (2026)
Effective short term rental pricing strategy in Three Rivers involves understanding monthly ADR fluctuations. The Average Daily Rate (ADR) for Airbnb in Three Rivers typically peaks in June and dips lowest during February. Leveraging Airbnb dynamic pricing tools or strategies based on this seasonality can significantly boost revenue. Here's a look at the typical nightly rates achieved:
- Best-in-class properties (Top 10%) command rates of $602+ per night, often due to premium features or locations.
- Strong performing properties (Top 25%) achieve nightly rates of $436 or more.
- Typical properties (Median) charge around $319 per night.
- Entry-level properties (Bottom 25%) earn around $232 per night.
Average Daily Rate (ADR) Trend by Month in Three Rivers
Get Live Three Rivers Market Intelligence 👇

Explore Real-time Analytics
Airbnb Seasonality Analysis & Trends in Three Rivers (2026)
Peak Season (July, June, August)
- Revenue averages $9,184 per month
- Occupancy rates average 69.5%
- Daily rates average $428
Shoulder Season
- Revenue averages $5,772 per month
- Occupancy maintains around 50.6%
- Daily rates hold near $382
Low Season (January, February, March)
- Revenue drops to average $3,240 per month
- Occupancy decreases to average 32.6%
- Daily rates adjust to average $340
Seasonality Insights for Three Rivers
- The Airbnb seasonality in Three Rivers shows highly seasonal trends requiring careful strategy. While the sections above show seasonal averages, it's also insightful to look at the extremes:
- During the high season, the absolute peak month showcases Three Rivers's highest earning potential, with monthly revenues capable of climbing to $9,781, occupancy reaching a high of 72.5%, and ADRs peaking at $448.
- Conversely, the slowest single month of the year, typically falling within the low season, marks the market's lowest point. In this month, revenue might dip to $2,698, occupancy could drop to 26.8%, and ADRs may adjust down to $322.
- Understanding both the seasonal averages and these monthly peaks and troughs in revenue, occupancy, and ADR is crucial for maximizing your Airbnb profit potential in Three Rivers.
Seasonal Strategies for Maximizing Profit
- Peak Season: Maximize revenue through premium pricing and potentially longer minimum stays. Ensure high availability.
- Low Season: Offer competitive pricing, special promotions (e.g., extended stay discounts), and flexible cancellation policies. Target off-season travelers like remote workers or budget-conscious guests.
- Shoulder Seasons: Implement dynamic pricing that balances peak and low rates. Target weekend travelers or specific events. Offer slightly more flexible terms than peak season.
- Regularly analyze your own performance against these Three Rivers seasonality benchmarks and adjust your pricing and availability strategy accordingly.
Best Areas for Airbnb Investment in Three Rivers (2026)
Exploring the top neighborhoods for short-term rentals in Three Rivers? This section highlights key areas, outlining why they are attractive for hosts and guests, along with notable local attractions. Consider these locations based on your target guest profile and investment strategy.
| Neighborhood / Area | Why Host Here? (Target Guests & Appeal) | Key Attractions & Landmarks |
|---|---|---|
| Sequoia National Park | A stunning natural wonder that attracts visitors with its towering sequoia trees and breathtaking scenery. Ideal for nature enthusiasts and outdoor activities such as hiking and camping. | Giant Forest, General Sherman Tree, Moro Rock, Sequoia Lake, Tharp's Log |
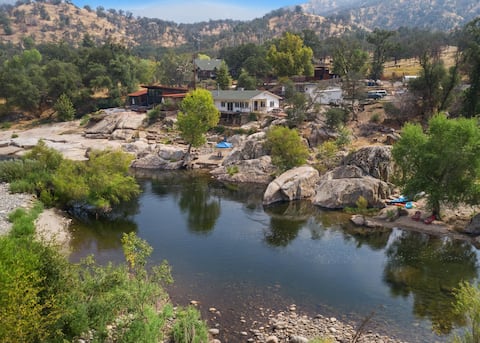
| Three Rivers Village | A charming small town that serves as a gateway to Sequoia National Park. Offers local shops, dining, and riverfront views, making it appealing for family vacations and nature retreats. | Three Rivers Historical Museum, Kaweah River, Local Art Galleries, Sequoia Foothills, Wildlife Viewing |
| Lake Kaweah | An excellent location for water activities and camping, Lake Kaweah attracts visitors for boating, fishing, and relaxing by the water. It complements the outdoor offerings of nearby national parks. | Lake Kaweah Recreation Area, Fishing and Boating, Picnic Areas, Wildlife Viewing, Hiking Around the Lake |
| Tule River Indian Reservation | Offers cultural experiences and a unique perspective on Native American history. Visitors interested in cultural education and local traditions will find it intriguing. | Cultural Events, Tule River Casino, Local Craft Markets, Nature Trails, Traditional Tribal Celebrations |
| Kings Canyon National Park | Just a short drive from Three Rivers, Kings Canyon offers stunning canyons and diverse ecosystems, attracting hikers and nature lovers. Perfect for extended stays for nature exploration. | Grant Grove, King's Canyon Scenic Byway, Cedar Grove, Giant Sequoias, Hiking Trails |
| Visalia | A nearby city with a variety of amenities including shopping, dining, and entertainment. Appeals to visitors looking for more urban experiences close to nature destinations. | Sequoia Mall, Visalia Fox Theatre, Visalia Convention Center, Downtown Visalia, Adventure Park |
| Woodlake | A quaint nearby town with scenic views and access to the beautiful Sierra foothills, Woodlake is ideal for guests looking for a peaceful getaway near the mountains. | Lake Woodlake, Local Vineyards, Scenic Drives, Hiking Trails, Community Events |
| Sierra Foothills | The region boasts beautiful landscapes and a range of outdoor activities, perfect for tourists seeking adventure, wine tasting, and a taste of rural California. | Local Wineries, Hiking and Biking Trails, Agricultural Tours, Charming Small Towns, Wildflower Fields |
Understanding Airbnb License Requirements & STR Laws in Three Rivers (2026)
While Three Rivers, California, United States currently shows low STR regulations, specific Airbnb license requirements might still exist or change. Always verify the latest short term rental regulations and Airbnb license requirements directly with local government authorities for Three Rivers to ensure full compliance before hosting.
(Source: AirROI data, 2026, finding no licensed listings among those analyzed)
Top Performing Airbnb Properties in Three Rivers (2026)
Benchmark your potential! Explore examples of top-performing Airbnb properties in Three Riversbased on Trailing Twelve Month (TTM) revenue. Analyze their characteristics, revenue, occupancy rate, and ADR to understand what drives success in this market.
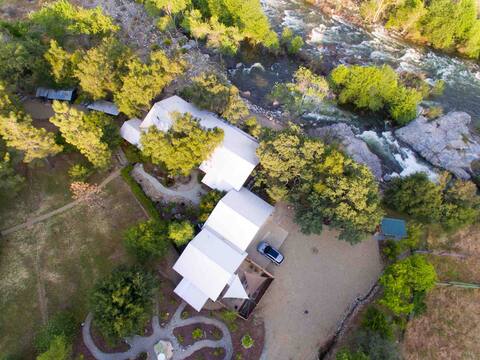
Entire Riverfront Villa w/ serene swimming hole.
Entire Place • 7 bedrooms

River Stars -3 Side-by-side Riverfront Homes
Entire Place • 11 bedrooms
Sequoia Falls
Entire Place • 4 bedrooms

Kaweah Chakra Riverfront Luxury & Swimming
Entire Place • 7 bedrooms

Top 1 HOME! Your Dream VACATiON is here!
Entire Place • 4 bedrooms
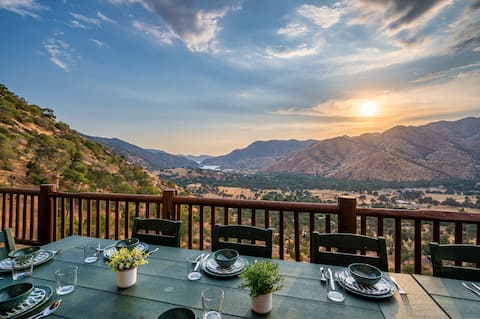
Spectacular Views 150 Acres Log Cabin 4 King Beds
Entire Place • 5 bedrooms
Note: Performance varies based on location, size, amenities, seasonality, and management quality. Data reflects the past 12 months.
Top Performing Airbnb Hosts in Three Rivers (2026)
Learn from the best! This table showcases top-performing Airbnb hosts in Three Rivers based on the number of properties managed and estimated total revenue over the past year. Analyze their scale and performance metrics.
| Host Name | Properties | Grossing Revenue | Stay Reviews | Avg Rating |
|---|---|---|---|---|
| Sequoia Vacation Rentals | 20 | $1,188,229 | 2130 | 4.85/5.0 |
| Pam | 18 | $1,116,425 | 4147 | 4.91/5.0 |
| Daniel Mark | 6 | $905,467 | 375 | 4.64/5.0 |
| Srey | 8 | $806,396 | 1385 | 4.94/5.0 |
| Georgel | 5 | $747,614 | 267 | 4.91/5.0 |
| Kenneth | 10 | $704,724 | 906 | 4.86/5.0 |
| Shea | 15 | $618,547 | 4057 | 4.84/5.0 |
| Adam | 6 | $614,384 | 1722 | 4.85/5.0 |
| John | 11 | $591,502 | 877 | 4.89/5.0 |
| Nataliya | 4 | $555,160 | 231 | 4.91/5.0 |
Analyzing the strategies of top hosts, such as their property selection, pricing, and guest communication, can offer valuable lessons for optimizing your own Airbnb operations in Three Rivers.
Dive Deeper: Advanced Three Rivers STR Market Data (2026)
Ready to unlock more insights? AirROI provides access to advanced metrics and comprehensive Airbnb data for Three Rivers. Explore detailed analytics beyond this report to refine your investment strategy, optimize pricing, and maximize your vacation rental profits.
Explore Advanced MetricsThree Rivers Short-Term Rental Market Composition (2026): Property & Room Types
Room Type Distribution
Property Type Distribution
Market Composition Insights for Three Rivers
- The Three Rivers Airbnb market composition is heavily skewed towards Entire Home/Apt listings, which make up 96.1% of the 407 active rentals. This indicates strong guest preference for privacy and space.
- Looking at the property type distribution in Three Rivers, House properties are the most common (65.1%), reflecting the local real estate landscape.
- Houses represent a significant 65.1% portion, catering likely to families or larger groups.
- The presence of 5.9% Hotel/Boutique listings indicates integration with traditional hospitality.
- Smaller segments like others, apartment/condo, unique stays (combined 6.9%) offer potential for unique stay experiences.
Three Rivers Airbnb Room Capacity Analysis (2026): Bedroom Distribution
Distribution of Listings by Number of Bedrooms
Room Capacity Insights for Three Rivers
- The dominant room capacity in Three Rivers is 1 bedroom listings, making up 29.2% of the market. This suggests a strong demand for properties suitable for couples or solo travelers.
- Together, 1 bedroom and 3 bedrooms properties represent 57.7% of the active Airbnb listings in Three Rivers, indicating a high concentration in these sizes.
- A significant 42.0% of listings offer 3+ bedrooms, catering to larger groups and families seeking more space in Three Rivers.
Three Rivers Vacation Rental Guest Capacity Trends (2026)
Distribution of Listings by Guest Capacity
Guest Capacity Insights for Three Rivers
- The most common guest capacity trend in Three Rivers vacation rentals is listings accommodating 8+ guests (29%). This suggests the primary traveler segment is likely larger groups.
- Properties designed for 8+ guests and 2 guests dominate the Three Rivers STR market, accounting for 53.3% of listings.
- 48.0% of properties accommodate 6+ guests, serving the market segment for larger families or group travel in Three Rivers.
- On average, properties in Three Rivers are equipped to host 5.0 guests.
Three Rivers Airbnb Booking Patterns (2026): Available vs. Booked Days
Available Days Distribution
Booked Days Distribution
Booking Pattern Insights for Three Rivers
- The most common availability pattern in Three Rivers falls within the 181-270 days range, representing 38.3% of listings. This suggests many properties have significant open periods on their calendars.
- Approximately 54.0% of listings show high availability (181+ days open annually), indicating potential for increased bookings or specific owner usage patterns.
- For booked days, the 181-270 days range is most frequent in Three Rivers (38.3%), reflecting common guest stay durations or potential owner blocking patterns.
- A notable 47.9% of properties secure long booking periods (181+ days booked per year), highlighting successful long-term rental strategies or significant owner usage.
Three Rivers Airbnb Minimum Stay Requirements Analysis
Distribution of Listings by Minimum Night Requirement
1 Night
123 listings
30.2% of total
2 Nights
131 listings
32.2% of total
3 Nights
3 listings
0.7% of total
30+ Nights
150 listings
36.9% of total
Key Insights
- The most prevalent minimum stay requirement in Three Rivers is 30+ Nights, adopted by 36.9% of listings. This highlights the market's preference for longer commitments.
- A strong majority (62.4%) of the Three Rivers Airbnb data shows acceptance of very short stays (1-2 nights), indicating a dynamic, high-turnover market.
- A significant segment (36.9%) caters to monthly stays (30+ nights) in Three Rivers, pointing to opportunities in the extended-stay market.
Recommendations
- Align with the market by considering a 30+ Nights minimum stay, as 36.9% of Three Rivers hosts use this setting.
- Explore offering discounts for stays of 30+ nights to attract the 36.9% of the market seeking extended stays.
- Adjust minimum nights based on seasonality – potentially shorter during low season and longer during peak demand periods in Three Rivers.
Three Rivers Airbnb Cancellation Policy Trends Analysis (2026)
Limited
7 listings
1.7% of total
Super Strict 30 Days
1 listings
0.2% of total
Super Strict 60 Days
6 listings
1.5% of total
Flexible
46 listings
11.3% of total
Moderate
117 listings
28.7% of total
Firm
153 listings
37.6% of total
Strict
77 listings
18.9% of total
Cancellation Policy Insights for Three Rivers
- The prevailing Airbnb cancellation policy trend in Three Rivers is Firm, used by 37.6% of listings.
- A majority (56.5%) of hosts in Three Rivers utilize Firm or Strict policies, indicating a market where hosts prioritize booking security.
Recommendations for Hosts
- Consider adopting a Firm policy to align with the 37.6% market standard in Three Rivers.
- Regularly review your cancellation policy against competitors and market demand shifts in Three Rivers.
Three Rivers STR Booking Lead Time Analysis (2026)
Average Booking Lead Time by Month
Booking Lead Time Insights for Three Rivers
- The overall average booking lead time for vacation rentals in Three Rivers is 46 days.
- Guests book furthest in advance for stays during June (average 69 days), likely coinciding with peak travel demand or local events.
- The shortest booking windows occur for stays in February (average 26 days), indicating more last-minute travel plans during this time.
- Seasonally, Summer (60 days avg.) sees the longest lead times, while Winter (28 days avg.) has the shortest, reflecting typical travel planning cycles.
Recommendations for Hosts
- Use the overall average lead time (46 days) as a baseline for your pricing and availability strategy in Three Rivers.
- For June stays, consider implementing length-of-stay discounts or slightly higher rates for bookings made less than 69 days out to capitalize on advance planning.
- Target marketing efforts for the Summer season well in advance (at least 60 days) to capture early planners.
- Monitor your own booking lead times against these Three Rivers averages to identify opportunities for dynamic pricing adjustments.
Popular & Essential Airbnb Amenities in Three Rivers (2026)
Amenity Prevalence
Amenity Insights for Three Rivers
- Essential amenities in Three Rivers that guests expect include: Wifi, Free parking on premises, Smoke alarm, Air conditioning, Heating, Hot water, Coffee maker. Lacking these (any) could significantly impact bookings.
- Popular amenities like Dishes and silverware, Carbon monoxide alarm, Shampoo are common but not universal. Offering these can provide a competitive edge.
Recommendations for Hosts
- Ensure your listing includes all essential amenities for Three Rivers: Wifi, Free parking on premises, Smoke alarm, Air conditioning, Heating, Hot water, Coffee maker.
- Prioritize adding missing essentials: Wifi, Free parking on premises, Smoke alarm, Air conditioning, Heating, Hot water, Coffee maker.
- Consider adding popular differentiators like Dishes and silverware or Carbon monoxide alarm to increase appeal.
- Highlight unique or less common amenities you offer (e.g., hot tub, dedicated workspace, EV charger) in your listing description and photos.
- Regularly check competitor amenities in Three Rivers to stay competitive.
Three Rivers Airbnb Guest Demographics & Profile Analysis (2026)
Guest Profile Summary for Three Rivers
- The typical guest profile for Airbnb in Three Rivers consists of primarily domestic travelers (88%), often arriving from nearby Los Angeles, typically belonging to the Post-2000s (Gen Z/Alpha) group (50%), primarily speaking English or Spanish.
- Domestic travelers account for 88.0% of guests.
- Key international markets include United States (88%) and United Kingdom (2.7%).
- Top languages spoken are English (58.8%) followed by Spanish (15.2%).
- A significant demographic segment is the Post-2000s (Gen Z/Alpha) group, representing 50% of guests.
Recommendations for Hosts
- Target domestic marketing efforts towards travelers from Los Angeles and San Diego.
- Tailor amenities and listing descriptions to appeal to the dominant Post-2000s (Gen Z/Alpha) demographic (e.g., highlight fast WiFi, smart home features, local guides).
- Highlight unique local experiences or amenities relevant to the primary guest profile.
- Consider seasonal promotions aligned with peak travel times for key origin markets.
Nearby Short-Term Rental Market Comparison
How does the Three Rivers Airbnb market stack up against its neighbors? Compare key performance metrics like average monthly revenue, ADR, and occupancy rates in surrounding areas to understand the broader regional STR landscape.
| Market | Active Properties | Monthly Revenue | Daily Rate | Avg. Occupancy |
|---|---|---|---|---|
| Wawona | 66 | $7,186 | $548.44 | 45% |
| Yosemite National Park | 227 | $6,835 | $511.03 | 44% |
| Yosemite West | 29 | $5,597 | $423.79 | 49% |
| Lone Pine | 33 | $4,810 | $274.42 | 55% |
| June Lake | 90 | $4,648 | $346.20 | 49% |
| Fish Camp | 36 | $4,344 | $423.34 | 37% |
| Oakhurst | 671 | $4,321 | $347.81 | 44% |
| Bass Lake | 224 | $4,002 | $523.79 | 34% |
| Mammoth Lakes | 2,595 | $3,945 | $439.48 | 36% |
| Ahwahnee | 103 | $3,759 | $320.89 | 41% |