South San Francisco Airbnb Market Analysis 2026: Short Term Rental Data & Vacation Rental Statistics in California, United States
Is Airbnb profitable in South San Francisco in 2026? Explore comprehensive Airbnb analytics for South San Francisco, California, United States to uncover income potential. This 2026 STR market report for South San Francisco, based on AirROI data from February 2025 to January 2026, reveals key trends in the niche market of 175 active listings.
Whether you're considering an Airbnb investment in South San Francisco, optimizing your existing vacation rental, or exploring rental arbitrage opportunities, understanding the South San Francisco Airbnb data is crucial. Understanding the local regulations is key to maximizing your short term rental income potential. Let's dive into the specifics.
Key South San Francisco Airbnb Performance Metrics Overview
Monthly Airbnb Revenue Variations & Income Potential in South San Francisco (2026)
Understanding the monthly revenue variations for Airbnb listings in South San Francisco is key to maximizing your short term rental income potential. Seasonality significantly impacts earnings. Our analysis, based on data from the past 12 months, shows that the peak revenue month for STRs in South San Francisco is typically June, while January often presents the lowest earnings, highlighting opportunities for strategic pricing adjustments during shoulder and low seasons. Explore the typical Airbnb income in South San Francisco across different performance tiers:
- Best-in-class properties (Top 10%) achieve $8,537+ monthly, often utilizing dynamic pricing and superior guest experiences.
- Strong performing properties (Top 25%) earn $5,194 or more, indicating effective management and desirable locations/amenities.
- Typical properties (Median) generate around $1,999 per month, representing the average market performance.
- Entry-level properties (Bottom 25%) see earnings around $950, often with potential for optimization.
Average Monthly Airbnb Earnings Trend in South San Francisco
South San Francisco Airbnb Occupancy Rate Trends (2026)
Maximize your bookings by understanding the South San Francisco STR occupancy trends. Seasonal demand shifts significantly influence how often properties are booked. Typically, Junesees the highest demand (peak season occupancy), while January experiences the lowest (low season). Effective strategies, like adjusting minimum stays or offering promotions, can boost occupancy during slower periods. Here's how different property tiers perform in South San Francisco:
- Best-in-class properties (Top 10%) achieve 87%+ occupancy, indicating high desirability and potentially optimized availability.
- Strong performing properties (Top 25%) maintain 75% or higher occupancy, suggesting good market fit and guest satisfaction.
- Typical properties (Median) have an occupancy rate around 53%.
- Entry-level properties (Bottom 25%) average 27% occupancy, potentially facing higher vacancy.
Average Monthly Occupancy Rate Trend in South San Francisco
Average Daily Rate (ADR) Airbnb Trends in South San Francisco (2026)
Effective short term rental pricing strategy in South San Francisco involves understanding monthly ADR fluctuations. The Average Daily Rate (ADR) for Airbnb in South San Francisco typically peaks in June and dips lowest during February. Leveraging Airbnb dynamic pricing tools or strategies based on this seasonality can significantly boost revenue. Here's a look at the typical nightly rates achieved:
- Best-in-class properties (Top 10%) command rates of $393+ per night, often due to premium features or locations.
- Strong performing properties (Top 25%) achieve nightly rates of $263 or more.
- Typical properties (Median) charge around $124 per night.
- Entry-level properties (Bottom 25%) earn around $73 per night.
Average Daily Rate (ADR) Trend by Month in South San Francisco
Get Live South San Francisco Market Intelligence 👇

Explore Real-time Analytics
Airbnb Seasonality Analysis & Trends in South San Francisco (2026)
Peak Season (June, May, July)
- Revenue averages $4,197 per month
- Occupancy rates average 56.7%
- Daily rates average $187
Shoulder Season
- Revenue averages $3,401 per month
- Occupancy maintains around 51.3%
- Daily rates hold near $183
Low Season (January, February, September)
- Revenue drops to average $2,794 per month
- Occupancy decreases to average 46.6%
- Daily rates adjust to average $176
Seasonality Insights for South San Francisco
- The Airbnb seasonality in South San Francisco shows moderate seasonality with distinct peak and low periods. While the sections above show seasonal averages, it's also insightful to look at the extremes:
- During the high season, the absolute peak month showcases South San Francisco's highest earning potential, with monthly revenues capable of climbing to $4,471, occupancy reaching a high of 61.2%, and ADRs peaking at $188.
- Conversely, the slowest single month of the year, typically falling within the low season, marks the market's lowest point. In this month, revenue might dip to $2,655, occupancy could drop to 37.3%, and ADRs may adjust down to $157.
- Understanding both the seasonal averages and these monthly peaks and troughs in revenue, occupancy, and ADR is crucial for maximizing your Airbnb profit potential in South San Francisco.
Seasonal Strategies for Maximizing Profit
- Peak Season: Maximize revenue through premium pricing and potentially longer minimum stays. Ensure high availability.
- Low Season: Offer competitive pricing, special promotions (e.g., extended stay discounts), and flexible cancellation policies. Target off-season travelers like remote workers or budget-conscious guests.
- Shoulder Seasons: Implement dynamic pricing that balances peak and low rates. Target weekend travelers or specific events. Offer slightly more flexible terms than peak season.
- Regularly analyze your own performance against these South San Francisco seasonality benchmarks and adjust your pricing and availability strategy accordingly.
Best Areas for Airbnb Investment in South San Francisco (2026)
Exploring the top neighborhoods for short-term rentals in South San Francisco? This section highlights key areas, outlining why they are attractive for hosts and guests, along with notable local attractions. Consider these locations based on your target guest profile and investment strategy.
| Neighborhood / Area | Why Host Here? (Target Guests & Appeal) | Key Attractions & Landmarks |
|---|---|---|
| Downtown South San Francisco | The central business district with quick access to major transportation and corporate offices, ideal for business travelers and tourists alike. | South San Francisco Conference Center, Biotech companies, BART and Caltrain stations, Parks and recreational areas, Restaurants and cafes |
| Bayshore | A vibrant area along the bay with beautiful views and parks, appealing to nature lovers and those seeking outdoor activities. | Bayshore Park, San Francisco Bay Trail, Birdwatching, Picnic areas, Scenic views |
| Westborough | A residential neighborhood with family-friendly amenities and proximity to parks, suitable for longer stays and family trips. | Westborough Park, Shopping centers, Schools and community centers, Local dining options, Quiet streets |
| Serra Highlands | A peaceful hillside neighborhood with views of the bay, appealing for those looking for a serene stay away from the city bustle. | Hiking trails, Scenic overlooks, Quiet parks, Residential charm, Local markets |
| South San Francisco Downtown Station | A downtown area with high potential due to new developments and growing interest in urban living. | New urban developments, Dining and shopping options, Public transportation, Walkable streets, Community events |
| Grand Avenue | A charming street that is home to restaurants, shops, and easy access to various attractions, perfect for visitors wanting local experiences. | Local eateries, Shops and boutiques, Cafes, Community spaces, Cultural events |
| Tanforan Shopping Center | Near a mall and entertainment options; attracts visitors looking for shopping and dining experiences. | Tanforan Mall, Dining options, Entertainment venues, Cinemas, Family-friendly activities |
| Garden Grove | A suburb known for its parks and community events, offering a quiet retreat with family-oriented facilities. | Community parks, Playgrounds, Local community events, Family-friendly atmosphere, Walking paths |
Understanding Airbnb License Requirements & STR Laws in South San Francisco (2026)
With 13% of listings showing registration in 2026, understanding potential Airbnb license requirements is crucial in South San Francisco. Always verify the latest short term rental regulations and Airbnb license requirements directly with local government authorities for South San Francisco to ensure full compliance before hosting.
(Source: AirROI data, 2026, based on 13% licensed listings)
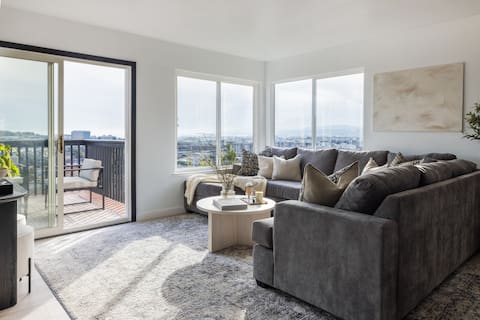
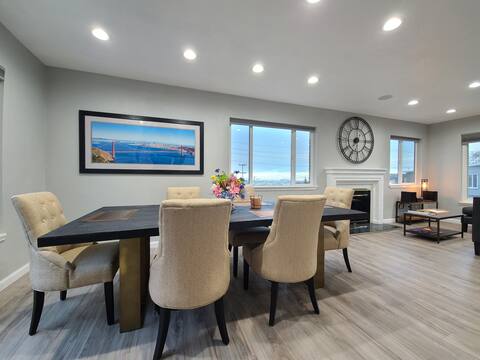
Top Performing Airbnb Properties in South San Francisco (2026)
Benchmark your potential! Explore examples of top-performing Airbnb properties in South San Franciscobased on Trailing Twelve Month (TTM) revenue. Analyze their characteristics, revenue, occupancy rate, and ADR to understand what drives success in this market.
Hilltop Luxury Panoramic Views
Entire Place • 4 bedrooms
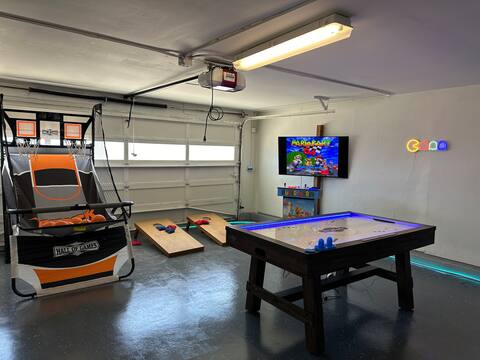
NEW Modern Home w/ FUN Game Room & Amazing views!
Entire Place • 5 bedrooms

Modern Central 4BD/2.5Bath Home Near SF, SFO!
Entire Place • 4 bedrooms

NEW SF Palm House Relaxing Stay 4br
Entire Place • 4 bedrooms
★EV+★Hillside SFO View★Home Theater★Pool Table
Entire Place • 3 bedrooms

Spacious 4BR Home w/ Stunning Views Near SF
Entire Place • 4 bedrooms
Note: Performance varies based on location, size, amenities, seasonality, and management quality. Data reflects the past 12 months.
Top Performing Airbnb Hosts in South San Francisco (2026)
Learn from the best! This table showcases top-performing Airbnb hosts in South San Francisco based on the number of properties managed and estimated total revenue over the past year. Analyze their scale and performance metrics.
| Host Name | Properties | Grossing Revenue | Stay Reviews | Avg Rating |
|---|---|---|---|---|
| George (Luxyom LLC) | 8 | $351,497 | 939 | 4.96/5.0 |
| Kristina | 3 | $350,551 | 327 | 4.95/5.0 |
| Shannon | 5 | $332,007 | 392 | 4.94/5.0 |
| Shuyan | 2 | $281,408 | 167 | 4.86/5.0 |
| Kimberly | 14 | $175,689 | 3395 | 4.54/5.0 |
| Victor 5 | 8 | $147,507 | 156 | 4.37/5.0 |
| Stacee | 2 | $137,228 | 216 | 4.93/5.0 |
| Ling | 5 | $129,761 | 65 | 4.55/5.0 |
| Jason | 1 | $124,815 | 322 | 4.95/5.0 |
| Gi'Angelo | 1 | $117,673 | 153 | 4.88/5.0 |
Analyzing the strategies of top hosts, such as their property selection, pricing, and guest communication, can offer valuable lessons for optimizing your own Airbnb operations in South San Francisco.
Dive Deeper: Advanced South San Francisco STR Market Data (2026)
Ready to unlock more insights? AirROI provides access to advanced metrics and comprehensive Airbnb data for South San Francisco. Explore detailed analytics beyond this report to refine your investment strategy, optimize pricing, and maximize your vacation rental profits.
Explore Advanced MetricsSouth San Francisco Short-Term Rental Market Composition (2026): Property & Room Types
Room Type Distribution
Property Type Distribution
Market Composition Insights for South San Francisco
- The South San Francisco Airbnb market composition is heavily skewed towards Entire Home/Apt listings, which make up 48.6% of the 175 active rentals. This indicates strong guest preference for privacy and space.
- However, a notable 44.6% share for Private Rooms suggests opportunities for budget-conscious travelers or hosts renting out spare rooms.
- Looking at the property type distribution in South San Francisco, House properties are the most common (66.9%), reflecting the local real estate landscape.
- Houses represent a significant 66.9% portion, catering likely to families or larger groups.
- Smaller segments like hotel/boutique, others (combined 7.4%) offer potential for unique stay experiences.
South San Francisco Airbnb Room Capacity Analysis (2026): Bedroom Distribution
Distribution of Listings by Number of Bedrooms
Room Capacity Insights for South San Francisco
- The dominant room capacity in South San Francisco is 1 bedroom listings, making up 23.4% of the market. This suggests a strong demand for properties suitable for couples or solo travelers.
- Together, 1 bedroom and 3 bedrooms properties represent 38.3% of the active Airbnb listings in South San Francisco, indicating a high concentration in these sizes.
- A significant 26.9% of listings offer 3+ bedrooms, catering to larger groups and families seeking more space in South San Francisco.
South San Francisco Vacation Rental Guest Capacity Trends (2026)
Distribution of Listings by Guest Capacity
Guest Capacity Insights for South San Francisco
- The most common guest capacity trend in South San Francisco vacation rentals is listings accommodating 8+ guests (17.7%). This suggests the primary traveler segment is likely larger groups.
- Properties designed for 8+ guests and 6 guests dominate the South San Francisco STR market, accounting for 29.1% of listings.
- 31.4% of properties accommodate 6+ guests, serving the market segment for larger families or group travel in South San Francisco.
- On average, properties in South San Francisco are equipped to host 3.0 guests.
South San Francisco Airbnb Booking Patterns (2026): Available vs. Booked Days
Available Days Distribution
Booked Days Distribution
Booking Pattern Insights for South San Francisco
- The most common availability pattern in South San Francisco falls within the 271-366 days range, representing 47.4% of listings. This suggests many properties have significant open periods on their calendars.
- Approximately 72.0% of listings show high availability (181+ days open annually), indicating potential for increased bookings or specific owner usage patterns.
- For booked days, the 31-90 days range is most frequent in South San Francisco (30.9%), reflecting common guest stay durations or potential owner blocking patterns.
- A notable 28.5% of properties secure long booking periods (181+ days booked per year), highlighting successful long-term rental strategies or significant owner usage.
South San Francisco Airbnb Minimum Stay Requirements Analysis
Distribution of Listings by Minimum Night Requirement
1 Night
75 listings
42.9% of total
2 Nights
34 listings
19.4% of total
3 Nights
11 listings
6.3% of total
4-6 Nights
3 listings
1.7% of total
7-29 Nights
6 listings
3.4% of total
30+ Nights
46 listings
26.3% of total
Key Insights
- The most prevalent minimum stay requirement in South San Francisco is 1 Night, adopted by 42.9% of listings. This highlights the market's preference for shorter, flexible bookings.
- A strong majority (62.3%) of the South San Francisco Airbnb data shows acceptance of very short stays (1-2 nights), indicating a dynamic, high-turnover market.
- A significant segment (26.3%) caters to monthly stays (30+ nights) in South San Francisco, pointing to opportunities in the extended-stay market.
Recommendations
- Align with the market by considering a 1 Night minimum stay, as 42.9% of South San Francisco hosts use this setting.
- Explore offering discounts for stays of 30+ nights to attract the 26.3% of the market seeking extended stays.
- Adjust minimum nights based on seasonality – potentially shorter during low season and longer during peak demand periods in South San Francisco.
South San Francisco Airbnb Cancellation Policy Trends Analysis (2026)
Flexible
48 listings
28.4% of total
Moderate
34 listings
20.1% of total
Firm
25 listings
14.8% of total
Strict
62 listings
36.7% of total
Cancellation Policy Insights for South San Francisco
- The prevailing Airbnb cancellation policy trend in South San Francisco is Strict, used by 36.7% of listings.
- A majority (51.5%) of hosts in South San Francisco utilize Firm or Strict policies, indicating a market where hosts prioritize booking security.
Recommendations for Hosts
- Consider adopting a Strict policy to align with the 36.7% market standard in South San Francisco.
- With 36.7% using Strict terms, this is a viable option in South San Francisco, particularly for high-value properties or during peak demand periods.
- Regularly review your cancellation policy against competitors and market demand shifts in South San Francisco.
South San Francisco STR Booking Lead Time Analysis (2026)
Average Booking Lead Time by Month
Booking Lead Time Insights for South San Francisco
- The overall average booking lead time for vacation rentals in South San Francisco is 28 days.
- Guests book furthest in advance for stays during July (average 36 days), likely coinciding with peak travel demand or local events.
- The shortest booking windows occur for stays in March (average 18 days), indicating more last-minute travel plans during this time.
- Seasonally, Summer (32 days avg.) sees the longest lead times, while Winter (23 days avg.) has the shortest, reflecting typical travel planning cycles.
Recommendations for Hosts
- Use the overall average lead time (28 days) as a baseline for your pricing and availability strategy in South San Francisco.
- Target marketing efforts for the Summer season well in advance (at least 32 days) to capture early planners.
- Monitor your own booking lead times against these South San Francisco averages to identify opportunities for dynamic pricing adjustments.
Popular & Essential Airbnb Amenities in South San Francisco (2026)
Amenity Prevalence
Amenity Insights for South San Francisco
- Essential amenities in South San Francisco that guests expect include: Wifi, Smoke alarm, Carbon monoxide alarm. Lacking these (any) could significantly impact bookings.
- Popular amenities like Heating, Bed linens, Hot water are common but not universal. Offering these can provide a competitive edge.
Recommendations for Hosts
- Ensure your listing includes all essential amenities for South San Francisco: Wifi, Smoke alarm, Carbon monoxide alarm.
- Prioritize adding missing essentials: Wifi, Smoke alarm, Carbon monoxide alarm.
- Consider adding popular differentiators like Heating or Bed linens to increase appeal.
- Highlight unique or less common amenities you offer (e.g., hot tub, dedicated workspace, EV charger) in your listing description and photos.
- Regularly check competitor amenities in South San Francisco to stay competitive.
South San Francisco Airbnb Guest Demographics & Profile Analysis (2026)
Guest Profile Summary for South San Francisco
- The typical guest profile for Airbnb in South San Francisco consists of primarily domestic travelers (83%), often arriving from nearby San Francisco, typically belonging to the Post-2000s (Gen Z/Alpha) group (50%), primarily speaking English or Spanish.
- Domestic travelers account for 82.9% of guests.
- Key international markets include United States (82.9%) and Germany (1.6%).
- Top languages spoken are English (56.6%) followed by Spanish (14.4%).
- A significant demographic segment is the Post-2000s (Gen Z/Alpha) group, representing 50% of guests.
Recommendations for Hosts
- Target domestic marketing efforts towards travelers from San Francisco and Los Angeles.
- Tailor amenities and listing descriptions to appeal to the dominant Post-2000s (Gen Z/Alpha) demographic (e.g., highlight fast WiFi, smart home features, local guides).
- Highlight unique local experiences or amenities relevant to the primary guest profile.
- Consider seasonal promotions aligned with peak travel times for key origin markets.
Nearby Short-Term Rental Market Comparison
How does the South San Francisco Airbnb market stack up against its neighbors? Compare key performance metrics like average monthly revenue, ADR, and occupancy rates in surrounding areas to understand the broader regional STR landscape.
| Market | Active Properties | Monthly Revenue | Daily Rate | Avg. Occupancy |
|---|---|---|---|---|
| Carmel Point | 15 | $14,483 | $1046.17 | 54% |
| Del Monte Forest | 105 | $10,280 | $964.89 | 47% |
| Moss Beach | 34 | $10,092 | $676.91 | 53% |
| Sonoma | 228 | $9,647 | $819.87 | 43% |
| Marshall | 18 | $8,897 | $607.75 | 50% |
| St. Helena | 50 | $8,684 | $924.70 | 38% |
| Carmel-by-the-Sea | 305 | $8,657 | $680.02 | 49% |
| Kenwood | 60 | $8,643 | $810.83 | 41% |
| Glen Ellen | 85 | $8,482 | $799.53 | 43% |
| Eldridge | 21 | $8,410 | $930.61 | 41% |