South Pasadena Airbnb Market Analysis 2026: Short Term Rental Data & Vacation Rental Statistics in California, United States
Is Airbnb profitable in South Pasadena in 2026? Explore comprehensive Airbnb analytics for South Pasadena, California, United States to uncover income potential. This 2026 STR market report for South Pasadena, based on AirROI data from February 2025 to January 2026, reveals key trends in the niche market of 72 active listings.
Whether you're considering an Airbnb investment in South Pasadena, optimizing your existing vacation rental, or exploring rental arbitrage opportunities, understanding the South Pasadena Airbnb data is crucial. Leveraging the low regulation environment is key to maximizing your short term rental income potential. Let's dive into the specifics.
Key South Pasadena Airbnb Performance Metrics Overview
Monthly Airbnb Revenue Variations & Income Potential in South Pasadena (2026)
Understanding the monthly revenue variations for Airbnb listings in South Pasadena is key to maximizing your short term rental income potential. Seasonality significantly impacts earnings. Our analysis, based on data from the past 12 months, shows that the peak revenue month for STRs in South Pasadena is typically March, while January often presents the lowest earnings, highlighting opportunities for strategic pricing adjustments during shoulder and low seasons. Explore the typical Airbnb income in South Pasadena across different performance tiers:
- Best-in-class properties (Top 10%) achieve $8,927+ monthly, often utilizing dynamic pricing and superior guest experiences.
- Strong performing properties (Top 25%) earn $5,236 or more, indicating effective management and desirable locations/amenities.
- Typical properties (Median) generate around $3,340 per month, representing the average market performance.
- Entry-level properties (Bottom 25%) see earnings around $1,935, often with potential for optimization.
Average Monthly Airbnb Earnings Trend in South Pasadena
South Pasadena Airbnb Occupancy Rate Trends (2026)
Maximize your bookings by understanding the South Pasadena STR occupancy trends. Seasonal demand shifts significantly influence how often properties are booked. Typically, Marchsees the highest demand (peak season occupancy), while January experiences the lowest (low season). Effective strategies, like adjusting minimum stays or offering promotions, can boost occupancy during slower periods. Here's how different property tiers perform in South Pasadena:
- Best-in-class properties (Top 10%) achieve 88%+ occupancy, indicating high desirability and potentially optimized availability.
- Strong performing properties (Top 25%) maintain 77% or higher occupancy, suggesting good market fit and guest satisfaction.
- Typical properties (Median) have an occupancy rate around 60%.
- Entry-level properties (Bottom 25%) average 32% occupancy, potentially facing higher vacancy.
Average Monthly Occupancy Rate Trend in South Pasadena
Average Daily Rate (ADR) Airbnb Trends in South Pasadena (2026)
Effective short term rental pricing strategy in South Pasadena involves understanding monthly ADR fluctuations. The Average Daily Rate (ADR) for Airbnb in South Pasadena typically peaks in June and dips lowest during February. Leveraging Airbnb dynamic pricing tools or strategies based on this seasonality can significantly boost revenue. Here's a look at the typical nightly rates achieved:
- Best-in-class properties (Top 10%) command rates of $443+ per night, often due to premium features or locations.
- Strong performing properties (Top 25%) achieve nightly rates of $289 or more.
- Typical properties (Median) charge around $197 per night.
- Entry-level properties (Bottom 25%) earn around $159 per night.
Average Daily Rate (ADR) Trend by Month in South Pasadena
Get Live South Pasadena Market Intelligence 👇

Explore Real-time Analytics
Airbnb Seasonality Analysis & Trends in South Pasadena (2026)
Peak Season (March, April, June)
- Revenue averages $5,022 per month
- Occupancy rates average 61.3%
- Daily rates average $245
Shoulder Season
- Revenue averages $4,287 per month
- Occupancy maintains around 57.0%
- Daily rates hold near $242
Low Season (January, September, December)
- Revenue drops to average $3,113 per month
- Occupancy decreases to average 42.7%
- Daily rates adjust to average $246
Seasonality Insights for South Pasadena
- The Airbnb seasonality in South Pasadena shows highly seasonal trends requiring careful strategy. While the sections above show seasonal averages, it's also insightful to look at the extremes:
- During the high season, the absolute peak month showcases South Pasadena's highest earning potential, with monthly revenues capable of climbing to $5,605, occupancy reaching a high of 66.7%, and ADRs peaking at $255.
- Conversely, the slowest single month of the year, typically falling within the low season, marks the market's lowest point. In this month, revenue might dip to $2,555, occupancy could drop to 36.9%, and ADRs may adjust down to $220.
- Understanding both the seasonal averages and these monthly peaks and troughs in revenue, occupancy, and ADR is crucial for maximizing your Airbnb profit potential in South Pasadena.
Seasonal Strategies for Maximizing Profit
- Peak Season: Maximize revenue through premium pricing and potentially longer minimum stays. Ensure high availability.
- Low Season: Offer competitive pricing, special promotions (e.g., extended stay discounts), and flexible cancellation policies. Target off-season travelers like remote workers or budget-conscious guests.
- Shoulder Seasons: Implement dynamic pricing that balances peak and low rates. Target weekend travelers or specific events. Offer slightly more flexible terms than peak season.
- Regularly analyze your own performance against these South Pasadena seasonality benchmarks and adjust your pricing and availability strategy accordingly.
Best Areas for Airbnb Investment in South Pasadena (2026)
Exploring the top neighborhoods for short-term rentals in South Pasadena? This section highlights key areas, outlining why they are attractive for hosts and guests, along with notable local attractions. Consider these locations based on your target guest profile and investment strategy.
| Neighborhood / Area | Why Host Here? (Target Guests & Appeal) | Key Attractions & Landmarks |
|---|---|---|
| Downtown South Pasadena | A lively area known for its charming shops and restaurants, making it popular among visitors looking for a quaint, local experience. | Pasadena Playhouse, South Pasadena Farmers Market, The Rialto Theatre, Barker Block, Transportation Museum |
| South Pasadena Historic District | Rich in history and beautiful architecture, the historic district attracts visitors interested in culture and heritage. | South Pasadena Library, Shields Park, Historic homes, South Pasadena City Hall, Orange Grove Park |
| Mission Street | A lively street lined with various dining and shopping options, ideal for tourists seeking convenience and local flavors. | Mission Street restaurants, Shopping boutiques, Nightlife spots, Coffee shops, Historic buildings |
| Arroyo Seco | An outdoor lover's paradise with parks and trails, appealing to those who appreciate nature and outdoor activities. | Arroyo Seco Park, Nature trails, Hiking paths, Historic bridges, Scenic views |
| South Pasadena High School | Surrounding the local high school, this neighborhood is vibrant and full of family-friendly activities, attracting visitors during school events. | Football games, Local events, Community gatherings, Nearby parks, Cultural events |
| South Pasadena Arts District | A creative hub with art galleries and studios, this area draws art enthusiasts and tourists interested in the local arts scene. | Art galleries, Workshops, Local exhibitions, Cultural events, Live music |
| Surrounding neighborhoods | The areas surrounding South Pasadena offer a wider variety of attractions and easy access to greater Los Angeles, appealing to a wider audience. | Nearby parks, Local eateries, Convenient access to metro, Cultural attractions in LA, Shopping areas |
| Civic Center | The Civic Center offers a hub for community events and activities, making it a great location for those looking to engage with locals. | City Hall, Community events, Public art installations, Civic Center Park, Cultural festivals |
Understanding Airbnb License Requirements & STR Laws in South Pasadena (2026)
While South Pasadena, California, United States currently shows low STR regulations, specific Airbnb license requirements might still exist or change. Always verify the latest short term rental regulations and Airbnb license requirements directly with local government authorities for South Pasadena to ensure full compliance before hosting.
(Source: AirROI data, 2026, based on 1% licensed listings)
Top Performing Airbnb Properties in South Pasadena (2026)
Benchmark your potential! Explore examples of top-performing Airbnb properties in South Pasadenabased on Trailing Twelve Month (TTM) revenue. Analyze their characteristics, revenue, occupancy rate, and ADR to understand what drives success in this market.

Retro Music Inspired Home - Sunset View & Piano
Entire Place • 3 bedrooms
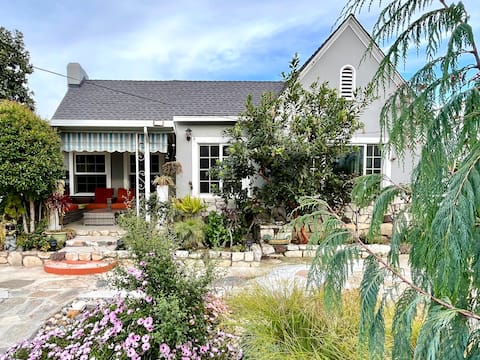
South Pasadena Craftsman House w/Serene Front Yard
Entire Place • 4 bedrooms
Sweet Retreat Craftsman Bungalow in South Pasadena
Entire Place • 2 bedrooms

Chic Mid Century Modern Retreat South Pasadena
Entire Place • 2 bedrooms
Charming Los Angeles Home Near DTLA w/ 2 Parking
Entire Place • 4 bedrooms
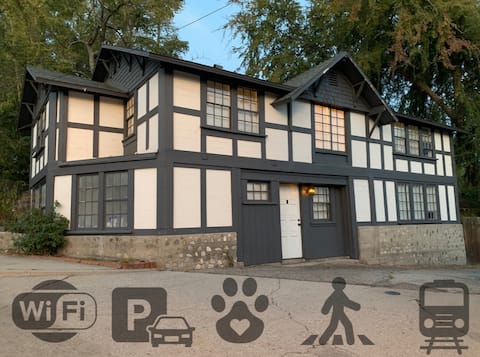
South Pasadena Cozy Carriage House 2bd/2ba
Entire Place • 2 bedrooms
Note: Performance varies based on location, size, amenities, seasonality, and management quality. Data reflects the past 12 months.
Top Performing Airbnb Hosts in South Pasadena (2026)
Learn from the best! This table showcases top-performing Airbnb hosts in South Pasadena based on the number of properties managed and estimated total revenue over the past year. Analyze their scale and performance metrics.
| Host Name | Properties | Grossing Revenue | Stay Reviews | Avg Rating |
|---|---|---|---|---|
| Wendy | 3 | $243,729 | 152 | 4.96/5.0 |
| Jin | 2 | $223,128 | 461 | 4.91/5.0 |
| Scott | 1 | $164,125 | 64 | 4.98/5.0 |
| Amber | 2 | $154,265 | 54 | 4.80/5.0 |
| Emilio | 2 | $132,663 | 200 | 4.89/5.0 |
| Jennifer | 1 | $120,605 | 245 | 4.98/5.0 |
| Roger | 4 | $116,046 | 439 | 4.92/5.0 |
| Gw | 4 | $105,395 | 236 | 4.59/5.0 |
| Janice | 8 | $102,015 | 481 | 4.72/5.0 |
| Kristin And Richard | 2 | $95,720 | 843 | 4.88/5.0 |
Analyzing the strategies of top hosts, such as their property selection, pricing, and guest communication, can offer valuable lessons for optimizing your own Airbnb operations in South Pasadena.
Dive Deeper: Advanced South Pasadena STR Market Data (2026)
Ready to unlock more insights? AirROI provides access to advanced metrics and comprehensive Airbnb data for South Pasadena. Explore detailed analytics beyond this report to refine your investment strategy, optimize pricing, and maximize your vacation rental profits.
Explore Advanced MetricsSouth Pasadena Short-Term Rental Market Composition (2026): Property & Room Types
Room Type Distribution
Property Type Distribution
Market Composition Insights for South Pasadena
- The South Pasadena Airbnb market composition is heavily skewed towards Entire Home/Apt listings, which make up 86.1% of the 72 active rentals. This indicates strong guest preference for privacy and space.
- Looking at the property type distribution in South Pasadena, House properties are the most common (38.9%), reflecting the local real estate landscape.
- Houses represent a significant 38.9% portion, catering likely to families or larger groups.
- The presence of 27.8% Hotel/Boutique listings indicates integration with traditional hospitality.
- Smaller segments like unique stays (combined 1.4%) offer potential for unique stay experiences.
South Pasadena Airbnb Room Capacity Analysis (2026): Bedroom Distribution
Distribution of Listings by Number of Bedrooms
Room Capacity Insights for South Pasadena
- The dominant room capacity in South Pasadena is 1 bedroom listings, making up 41.7% of the market. This suggests a strong demand for properties suitable for couples or solo travelers.
- Together, 1 bedroom and 2 bedrooms properties represent 68.1% of the active Airbnb listings in South Pasadena, indicating a high concentration in these sizes.
South Pasadena Vacation Rental Guest Capacity Trends (2026)
Distribution of Listings by Guest Capacity
Guest Capacity Insights for South Pasadena
- The most common guest capacity trend in South Pasadena vacation rentals is listings accommodating 4 guests (30.6%). This suggests the primary traveler segment is likely small families or groups.
- Properties designed for 4 guests and 2 guests dominate the South Pasadena STR market, accounting for 55.6% of listings.
- 19.4% of properties accommodate 6+ guests, serving the market segment for larger families or group travel in South Pasadena.
- On average, properties in South Pasadena are equipped to host 3.9 guests.
South Pasadena Airbnb Booking Patterns (2026): Available vs. Booked Days
Available Days Distribution
Booked Days Distribution
Booking Pattern Insights for South Pasadena
- The most common availability pattern in South Pasadena falls within the 271-366 days range, representing 31.9% of listings. This suggests many properties have significant open periods on their calendars.
- Approximately 59.7% of listings show high availability (181+ days open annually), indicating potential for increased bookings or specific owner usage patterns.
- For booked days, the 91-180 days range is most frequent in South Pasadena (26.4%), reflecting common guest stay durations or potential owner blocking patterns.
- A notable 41.7% of properties secure long booking periods (181+ days booked per year), highlighting successful long-term rental strategies or significant owner usage.
South Pasadena Airbnb Minimum Stay Requirements Analysis
Distribution of Listings by Minimum Night Requirement
1 Night
19 listings
26.4% of total
2 Nights
18 listings
25% of total
3 Nights
3 listings
4.2% of total
4-6 Nights
4 listings
5.6% of total
7-29 Nights
7 listings
9.7% of total
30+ Nights
21 listings
29.2% of total
Key Insights
- The most prevalent minimum stay requirement in South Pasadena is 30+ Nights, adopted by 29.2% of listings. This highlights the market's preference for longer commitments.
- A significant segment (29.2%) caters to monthly stays (30+ nights) in South Pasadena, pointing to opportunities in the extended-stay market.
Recommendations
- Align with the market by considering a 30+ Nights minimum stay, as 29.2% of South Pasadena hosts use this setting.
- If feasible, allowing 1-night stays, especially midweek or during low season, could capture last-minute bookings, as only 26.4% currently do.
- Explore offering discounts for stays of 30+ nights to attract the 29.2% of the market seeking extended stays.
- Adjust minimum nights based on seasonality – potentially shorter during low season and longer during peak demand periods in South Pasadena.
South Pasadena Airbnb Cancellation Policy Trends Analysis (2026)
Limited
2 listings
2.8% of total
Flexible
9 listings
12.5% of total
Moderate
34 listings
47.2% of total
Firm
15 listings
20.8% of total
Strict
12 listings
16.7% of total
Cancellation Policy Insights for South Pasadena
- The prevailing Airbnb cancellation policy trend in South Pasadena is Moderate, used by 47.2% of listings.
- There's a relatively balanced mix between guest-friendly (59.7%) and stricter (37.5%) policies, offering choices for different guest needs.
Recommendations for Hosts
- Consider adopting a Moderate policy to align with the 47.2% market standard in South Pasadena.
- Regularly review your cancellation policy against competitors and market demand shifts in South Pasadena.
South Pasadena STR Booking Lead Time Analysis (2026)
Average Booking Lead Time by Month
Booking Lead Time Insights for South Pasadena
- The overall average booking lead time for vacation rentals in South Pasadena is 42 days.
- Guests book furthest in advance for stays during December (average 69 days), likely coinciding with peak travel demand or local events.
- The shortest booking windows occur for stays in February (average 30 days), indicating more last-minute travel plans during this time.
- Seasonally, Fall (52 days avg.) sees the longest lead times, while Summer (36 days avg.) has the shortest, reflecting typical travel planning cycles.
Recommendations for Hosts
- Use the overall average lead time (42 days) as a baseline for your pricing and availability strategy in South Pasadena.
- For December stays, consider implementing length-of-stay discounts or slightly higher rates for bookings made less than 69 days out to capitalize on advance planning.
- Target marketing efforts for the Fall season well in advance (at least 52 days) to capture early planners.
- Monitor your own booking lead times against these South Pasadena averages to identify opportunities for dynamic pricing adjustments.
Popular & Essential Airbnb Amenities in South Pasadena (2026)
Amenity Prevalence
Amenity Insights for South Pasadena
- Essential amenities in South Pasadena that guests expect include: Air conditioning, Wifi, Smoke alarm, TV, Heating, Hot water. Lacking these (any) could significantly impact bookings.
- Popular amenities like Hair dryer, Carbon monoxide alarm, Shampoo are common but not universal. Offering these can provide a competitive edge.
Recommendations for Hosts
- Ensure your listing includes all essential amenities for South Pasadena: Air conditioning, Wifi, Smoke alarm, TV, Heating, Hot water.
- Prioritize adding missing essentials: Wifi, Smoke alarm, TV, Heating, Hot water.
- Consider adding popular differentiators like Hair dryer or Carbon monoxide alarm to increase appeal.
- Highlight unique or less common amenities you offer (e.g., hot tub, dedicated workspace, EV charger) in your listing description and photos.
- Regularly check competitor amenities in South Pasadena to stay competitive.
South Pasadena Airbnb Guest Demographics & Profile Analysis (2026)
Guest Profile Summary for South Pasadena
- The typical guest profile for Airbnb in South Pasadena consists of primarily domestic travelers (89%), often arriving from nearby Los Angeles, typically belonging to the Post-2000s (Gen Z/Alpha) group (50%), primarily speaking English or Spanish.
- Domestic travelers account for 89.2% of guests.
- Key international markets include United States (89.2%) and United Kingdom (1.9%).
- Top languages spoken are English (57.5%) followed by Spanish (15.5%).
- A significant demographic segment is the Post-2000s (Gen Z/Alpha) group, representing 50% of guests.
Recommendations for Hosts
- Target domestic marketing efforts towards travelers from Los Angeles and New York.
- Tailor amenities and listing descriptions to appeal to the dominant Post-2000s (Gen Z/Alpha) demographic (e.g., highlight fast WiFi, smart home features, local guides).
- Highlight unique local experiences or amenities relevant to the primary guest profile.
- Consider seasonal promotions aligned with peak travel times for key origin markets.
Nearby Short-Term Rental Market Comparison
How does the South Pasadena Airbnb market stack up against its neighbors? Compare key performance metrics like average monthly revenue, ADR, and occupancy rates in surrounding areas to understand the broader regional STR landscape.
| Market | Active Properties | Monthly Revenue | Daily Rate | Avg. Occupancy |
|---|---|---|---|---|
| Montecito | 127 | $10,744 | $950.35 | 51% |
| Newport Beach | 1,273 | $8,950 | $744.06 | 47% |
| Malibu | 251 | $8,293 | $1263.89 | 35% |
| Manhattan Beach | 267 | $7,875 | $585.30 | 53% |
| Toro Canyon | 33 | $6,935 | $717.58 | 42% |
| Avalon | 249 | $6,705 | $696.60 | 38% |
| Summerland | 88 | $6,323 | $494.72 | 49% |
| Rancho Santa Fe | 34 | $6,074 | $913.16 | 35% |
| Unincorporated Santa Monica Mountains | 119 | $6,008 | $699.60 | 38% |
| Encinitas | 559 | $5,940 | $543.93 | 49% |