Sonoma Airbnb Market Analysis 2026: Short Term Rental Data & Vacation Rental Statistics in California, United States
Is Airbnb profitable in Sonoma in 2026? Explore comprehensive Airbnb analytics for Sonoma, California, United States to uncover income potential. This 2026 STR market report for Sonoma, based on AirROI data from February 2025 to January 2026, reveals key trends in the market of 228 active listings.
Whether you're considering an Airbnb investment in Sonoma, optimizing your existing vacation rental, or exploring rental arbitrage opportunities, understanding the Sonoma Airbnb data is crucial. Understanding the local regulations is key to maximizing your short term rental income potential. Let's dive into the specifics.
Key Sonoma Airbnb Performance Metrics Overview
Monthly Airbnb Revenue Variations & Income Potential in Sonoma (2026)
Understanding the monthly revenue variations for Airbnb listings in Sonoma is key to maximizing your short term rental income potential. Seasonality significantly impacts earnings. Our analysis, based on data from the past 12 months, shows that the peak revenue month for STRs in Sonoma is typically August, while February often presents the lowest earnings, highlighting opportunities for strategic pricing adjustments during shoulder and low seasons. Explore the typical Airbnb income in Sonoma across different performance tiers:
- Best-in-class properties (Top 10%) achieve $28,122+ monthly, often utilizing dynamic pricing and superior guest experiences.
- Strong performing properties (Top 25%) earn $15,908 or more, indicating effective management and desirable locations/amenities.
- Typical properties (Median) generate around $7,927 per month, representing the average market performance.
- Entry-level properties (Bottom 25%) see earnings around $3,683, often with potential for optimization.
Average Monthly Airbnb Earnings Trend in Sonoma
Sonoma Airbnb Occupancy Rate Trends (2026)
Maximize your bookings by understanding the Sonoma STR occupancy trends. Seasonal demand shifts significantly influence how often properties are booked. Typically, Augustsees the highest demand (peak season occupancy), while January experiences the lowest (low season). Effective strategies, like adjusting minimum stays or offering promotions, can boost occupancy during slower periods. Here's how different property tiers perform in Sonoma:
- Best-in-class properties (Top 10%) achieve 76%+ occupancy, indicating high desirability and potentially optimized availability.
- Strong performing properties (Top 25%) maintain 61% or higher occupancy, suggesting good market fit and guest satisfaction.
- Typical properties (Median) have an occupancy rate around 42%.
- Entry-level properties (Bottom 25%) average 25% occupancy, potentially facing higher vacancy.
Average Monthly Occupancy Rate Trend in Sonoma
Average Daily Rate (ADR) Airbnb Trends in Sonoma (2026)
Effective short term rental pricing strategy in Sonoma involves understanding monthly ADR fluctuations. The Average Daily Rate (ADR) for Airbnb in Sonoma typically peaks in May and dips lowest during January. Leveraging Airbnb dynamic pricing tools or strategies based on this seasonality can significantly boost revenue. Here's a look at the typical nightly rates achieved:
- Best-in-class properties (Top 10%) command rates of $1,585+ per night, often due to premium features or locations.
- Strong performing properties (Top 25%) achieve nightly rates of $1,095 or more.
- Typical properties (Median) charge around $637 per night.
- Entry-level properties (Bottom 25%) earn around $304 per night.
Average Daily Rate (ADR) Trend by Month in Sonoma
Get Live Sonoma Market Intelligence 👇

Explore Real-time Analytics
Airbnb Seasonality Analysis & Trends in Sonoma (2026)
Peak Season (August, July, June)
- Revenue averages $14,768 per month
- Occupancy rates average 50.9%
- Daily rates average $843
Shoulder Season
- Revenue averages $12,183 per month
- Occupancy maintains around 44.3%
- Daily rates hold near $805
Low Season (January, February, March)
- Revenue drops to average $8,456 per month
- Occupancy decreases to average 34.8%
- Daily rates adjust to average $746
Seasonality Insights for Sonoma
- The Airbnb seasonality in Sonoma shows moderate seasonality with distinct peak and low periods. While the sections above show seasonal averages, it's also insightful to look at the extremes:
- During the high season, the absolute peak month showcases Sonoma's highest earning potential, with monthly revenues capable of climbing to $15,217, occupancy reaching a high of 54.0%, and ADRs peaking at $865.
- Conversely, the slowest single month of the year, typically falling within the low season, marks the market's lowest point. In this month, revenue might dip to $7,447, occupancy could drop to 30.8%, and ADRs may adjust down to $726.
- Understanding both the seasonal averages and these monthly peaks and troughs in revenue, occupancy, and ADR is crucial for maximizing your Airbnb profit potential in Sonoma.
Seasonal Strategies for Maximizing Profit
- Peak Season: Maximize revenue through premium pricing and potentially longer minimum stays. Ensure high availability.
- Low Season: Offer competitive pricing, special promotions (e.g., extended stay discounts), and flexible cancellation policies. Target off-season travelers like remote workers or budget-conscious guests.
- Shoulder Seasons: Implement dynamic pricing that balances peak and low rates. Target weekend travelers or specific events. Offer slightly more flexible terms than peak season.
- Regularly analyze your own performance against these Sonoma seasonality benchmarks and adjust your pricing and availability strategy accordingly.
Best Areas for Airbnb Investment in Sonoma (2026)
Exploring the top neighborhoods for short-term rentals in Sonoma? This section highlights key areas, outlining why they are attractive for hosts and guests, along with notable local attractions. Consider these locations based on your target guest profile and investment strategy.
| Neighborhood / Area | Why Host Here? (Target Guests & Appeal) | Key Attractions & Landmarks |
|---|---|---|
| Sonoma Plaza | The heart of Sonoma Wine Country, known for its historic charm and vibrant atmosphere. A great location for tourists wanting to explore wineries and local culture. | Sonoma Plaza, Sonoma Valley Museum of Art, Historic Sonoma Mission, Charming shops and restaurants, Sonoma State Historic Park |
| Glen Ellen | A picturesque village that offers a tranquil environment and is surrounded by vineyards and natural beauty. Popular for wine enthusiasts and nature lovers. | Jack London State Historic Park, Benziger Family Winery, Glen Ellen Village, Sonoma Creek, Vineyards |
| Sonoma Valley | Famous for its beautiful vineyards and rolling hills, Sonoma Valley offers a variety of wineries and outdoor activities, perfect for travelers looking for a wine country experience. | Vineyards and wineries, Sonoma Valley Regional Park, Hiking trails, Gourmet restaurants |
| Kenwood | A charming town with a rustic feel, Kenwood is known for its wineries and close proximity to hiking trails in the area, appealing to both relaxation and adventure. | Cafe Citti, Kunde Family Winery, Hiking in Sugarloaf Ridge State Park, Kenwood Plaza Park |
| Napa Valley | While technically not part of Sonoma, its close proximity makes it a popular destination for wine lovers, with easy access to some of California's best vineyards. | Wine tastings, Napa River, Gourmet food experiences, Hot air balloon rides |
| Healdsburg | Known for its vibrant town square and excellent wineries, Healdsburg attracts tourists looking for a sophisticated and laid-back getaway in wine country. | Healdsburg Plaza, Russian River, Dry Creek Valley wineries, Boutique shops and restaurants |
| Petaluma | A historic town with a vibrant arts scene, Petaluma has a charming downtown and is also near many outdoor activities, making it a diverse destination. | Petaluma Historic Downtown, Petaluma River, Local breweries, Outdoor activities |
| Santa Rosa | The largest city in Sonoma County, offering a mix of urban and suburban experiences, with a variety of attractions and amenities. | Charles M. Schulz Museum, Luther Burbank Home & Gardens, Santa Rosa Plaza, Wine tasting rooms |
Understanding Airbnb License Requirements & STR Laws in Sonoma (2026)
With 22% of listings showing registration in 2026, understanding potential Airbnb license requirements is crucial in Sonoma. Always verify the latest short term rental regulations and Airbnb license requirements directly with local government authorities for Sonoma to ensure full compliance before hosting.
(Source: AirROI data, 2026, based on 22% licensed listings)
Top Performing Airbnb Properties in Sonoma (2026)
Benchmark your potential! Explore examples of top-performing Airbnb properties in Sonomabased on Trailing Twelve Month (TTM) revenue. Analyze their characteristics, revenue, occupancy rate, and ADR to understand what drives success in this market.
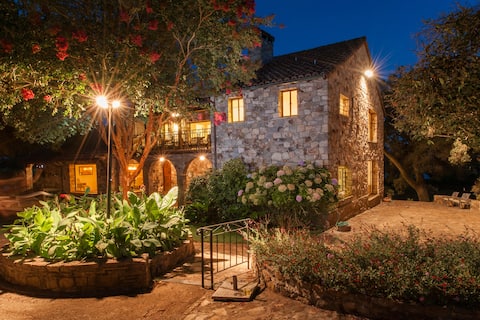
Sonoma 14Acres, 5BR 5BA 2Houses, Pool, Plaza 3 mi.
Entire Place • 5 bedrooms
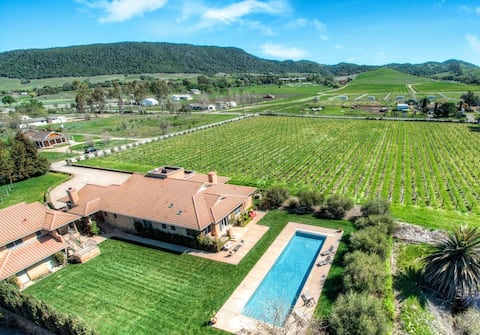
Fabulous Sonoma Farm House
Entire Place • 4 bedrooms
Serene estate, an entertainer's paradise
Entire Place • 5 bedrooms
Private Villa on 4.3 Acre Estate Pool + Hot Tub +
Entire Place • 5 bedrooms
Casa Sebastiani by BeautifulPlaces
Entire Place • 6 bedrooms
Explore 7-Acre Estate with Private Vineyard & Pool
Entire Place • 6 bedrooms
Note: Performance varies based on location, size, amenities, seasonality, and management quality. Data reflects the past 12 months.
Top Performing Airbnb Hosts in Sonoma (2026)
Learn from the best! This table showcases top-performing Airbnb hosts in Sonoma based on the number of properties managed and estimated total revenue over the past year. Analyze their scale and performance metrics.
| Host Name | Properties | Grossing Revenue | Stay Reviews | Avg Rating |
|---|---|---|---|---|
| Hunt | 13 | $1,526,711 | 339 | 4.97/5.0 |
| Wright Lux Stays | 3 | $1,355,621 | 157 | 4.96/5.0 |
| Mike | 3 | $1,295,383 | 322 | 4.98/5.0 |
| Woodfield Properties | 8 | $1,016,419 | 110 | 4.92/5.0 |
| Wine Country Estate Management | 9 | $864,643 | 540 | 4.87/5.0 |
| BeautifulPlaces | 4 | $689,879 | 79 | 4.94/5.0 |
| Hilary | 2 | $630,997 | 439 | 4.97/5.0 |
| Bora | 2 | $582,438 | 384 | 4.90/5.0 |
| Paul | 2 | $558,104 | 127 | 4.94/5.0 |
| Lisa | 1 | $552,997 | 128 | 5.00/5.0 |
Analyzing the strategies of top hosts, such as their property selection, pricing, and guest communication, can offer valuable lessons for optimizing your own Airbnb operations in Sonoma.
Dive Deeper: Advanced Sonoma STR Market Data (2026)
Ready to unlock more insights? AirROI provides access to advanced metrics and comprehensive Airbnb data for Sonoma. Explore detailed analytics beyond this report to refine your investment strategy, optimize pricing, and maximize your vacation rental profits.
Explore Advanced MetricsSonoma Short-Term Rental Market Composition (2026): Property & Room Types
Room Type Distribution
Property Type Distribution
Market Composition Insights for Sonoma
- The Sonoma Airbnb market composition is heavily skewed towards Entire Home/Apt listings, which make up 94.3% of the 228 active rentals. This indicates strong guest preference for privacy and space.
- Looking at the property type distribution in Sonoma, House properties are the most common (79.8%), reflecting the local real estate landscape.
- Houses represent a significant 79.8% portion, catering likely to families or larger groups.
- The presence of 10.1% Hotel/Boutique listings indicates integration with traditional hospitality.
- Smaller segments like others, outdoor/unique (combined 4.8%) offer potential for unique stay experiences.
Sonoma Airbnb Room Capacity Analysis (2026): Bedroom Distribution
Distribution of Listings by Number of Bedrooms
Room Capacity Insights for Sonoma
- The dominant room capacity in Sonoma is 3 bedrooms listings, making up 25.4% of the market. This suggests a strong demand for properties suitable for families or small groups.
- Together, 3 bedrooms and 2 bedrooms properties represent 47.8% of the active Airbnb listings in Sonoma, indicating a high concentration in these sizes.
- A significant 54.4% of listings offer 3+ bedrooms, catering to larger groups and families seeking more space in Sonoma.
Sonoma Vacation Rental Guest Capacity Trends (2026)
Distribution of Listings by Guest Capacity
Guest Capacity Insights for Sonoma
- The most common guest capacity trend in Sonoma vacation rentals is listings accommodating 8+ guests (35.5%). This suggests the primary traveler segment is likely larger groups.
- Properties designed for 8+ guests and 6 guests dominate the Sonoma STR market, accounting for 57.0% of listings.
- 57.9% of properties accommodate 6+ guests, serving the market segment for larger families or group travel in Sonoma.
- On average, properties in Sonoma are equipped to host 5.4 guests.
Sonoma Airbnb Booking Patterns (2026): Available vs. Booked Days
Available Days Distribution
Booked Days Distribution
Booking Pattern Insights for Sonoma
- The most common availability pattern in Sonoma falls within the 181-270 days range, representing 40.4% of listings. This suggests many properties have significant open periods on their calendars.
- Approximately 75.5% of listings show high availability (181+ days open annually), indicating potential for increased bookings or specific owner usage patterns.
- For booked days, the 91-180 days range is most frequent in Sonoma (39.5%), reflecting common guest stay durations or potential owner blocking patterns.
- A notable 26.7% of properties secure long booking periods (181+ days booked per year), highlighting successful long-term rental strategies or significant owner usage.
Sonoma Airbnb Minimum Stay Requirements Analysis
Distribution of Listings by Minimum Night Requirement
1 Night
11 listings
4.8% of total
2 Nights
80 listings
35.1% of total
3 Nights
17 listings
7.5% of total
4-6 Nights
1 listings
0.4% of total
7-29 Nights
10 listings
4.4% of total
30+ Nights
109 listings
47.8% of total
Key Insights
- The most prevalent minimum stay requirement in Sonoma is 30+ Nights, adopted by 47.8% of listings. This highlights the market's preference for longer commitments.
- A significant segment (47.8%) caters to monthly stays (30+ nights) in Sonoma, pointing to opportunities in the extended-stay market.
Recommendations
- Align with the market by considering a 30+ Nights minimum stay, as 47.8% of Sonoma hosts use this setting.
- If feasible, allowing 1-night stays, especially midweek or during low season, could capture last-minute bookings, as only 4.8% currently do.
- A 2-night minimum appears standard (35.1%). Consider this for weekends or peak periods.
- Explore offering discounts for stays of 30+ nights to attract the 47.8% of the market seeking extended stays.
- Adjust minimum nights based on seasonality – potentially shorter during low season and longer during peak demand periods in Sonoma.
Sonoma Airbnb Cancellation Policy Trends Analysis (2026)
Super Strict 30 Days
5 listings
2.2% of total
Super Strict 60 Days
13 listings
5.7% of total
Limited
3 listings
1.3% of total
Flexible
16 listings
7% of total
Moderate
37 listings
16.2% of total
Firm
120 listings
52.6% of total
Strict
34 listings
14.9% of total
Cancellation Policy Insights for Sonoma
- The prevailing Airbnb cancellation policy trend in Sonoma is Firm, used by 52.6% of listings.
- A majority (67.5%) of hosts in Sonoma utilize Firm or Strict policies, indicating a market where hosts prioritize booking security.
Recommendations for Hosts
- Consider adopting a Firm policy to align with the 52.6% market standard in Sonoma.
- Using a Strict policy might deter some guests, as only 14.9% of listings use it. Evaluate if potential revenue protection outweighs possible lower booking rates.
- Regularly review your cancellation policy against competitors and market demand shifts in Sonoma.
Sonoma STR Booking Lead Time Analysis (2026)
Average Booking Lead Time by Month
Booking Lead Time Insights for Sonoma
- The overall average booking lead time for vacation rentals in Sonoma is 70 days.
- Guests book furthest in advance for stays during May (average 93 days), likely coinciding with peak travel demand or local events.
- The shortest booking windows occur for stays in January (average 50 days), indicating more last-minute travel plans during this time.
- Seasonally, Summer (76 days avg.) sees the longest lead times, while Winter (56 days avg.) has the shortest, reflecting typical travel planning cycles.
Recommendations for Hosts
- Use the overall average lead time (70 days) as a baseline for your pricing and availability strategy in Sonoma.
- For May stays, consider implementing length-of-stay discounts or slightly higher rates for bookings made less than 93 days out to capitalize on advance planning.
- Target marketing efforts for the Summer season well in advance (at least 76 days) to capture early planners.
- Monitor your own booking lead times against these Sonoma averages to identify opportunities for dynamic pricing adjustments.
Popular & Essential Airbnb Amenities in Sonoma (2026)
Amenity Prevalence
Amenity Insights for Sonoma
- Essential amenities in Sonoma that guests expect include: Wifi, Smoke alarm, Heating, Free parking on premises, Carbon monoxide alarm. Lacking these (any) could significantly impact bookings.
- Popular amenities like Hair dryer, Refrigerator, Dishes and silverware are common but not universal. Offering these can provide a competitive edge.
Recommendations for Hosts
- Ensure your listing includes all essential amenities for Sonoma: Wifi, Smoke alarm, Heating, Free parking on premises, Carbon monoxide alarm.
- Prioritize adding missing essentials: Wifi, Smoke alarm, Heating, Free parking on premises, Carbon monoxide alarm.
- Consider adding popular differentiators like Hair dryer or Refrigerator to increase appeal.
- Highlight unique or less common amenities you offer (e.g., hot tub, dedicated workspace, EV charger) in your listing description and photos.
- Regularly check competitor amenities in Sonoma to stay competitive.
Sonoma Airbnb Guest Demographics & Profile Analysis (2026)
Guest Profile Summary for Sonoma
- The typical guest profile for Airbnb in Sonoma consists of primarily domestic travelers (95%), often arriving from nearby San Francisco, typically belonging to the Post-2000s (Gen Z/Alpha) group (50%), primarily speaking English or Spanish.
- Domestic travelers account for 95.0% of guests.
- Key international markets include United States (95%) and Canada (1%).
- Top languages spoken are English (66.2%) followed by Spanish (12.8%).
- A significant demographic segment is the Post-2000s (Gen Z/Alpha) group, representing 50% of guests.
Recommendations for Hosts
- Target domestic marketing efforts towards travelers from San Francisco and New York.
- Tailor amenities and listing descriptions to appeal to the dominant Post-2000s (Gen Z/Alpha) demographic (e.g., highlight fast WiFi, smart home features, local guides).
- Highlight unique local experiences or amenities relevant to the primary guest profile.
- Consider seasonal promotions aligned with peak travel times for key origin markets.
Nearby Short-Term Rental Market Comparison
How does the Sonoma Airbnb market stack up against its neighbors? Compare key performance metrics like average monthly revenue, ADR, and occupancy rates in surrounding areas to understand the broader regional STR landscape.
| Market | Active Properties | Monthly Revenue | Daily Rate | Avg. Occupancy |
|---|---|---|---|---|
| Moss Beach | 34 | $10,092 | $676.91 | 53% |
| Marshall | 18 | $8,897 | $607.75 | 50% |
| St. Helena | 50 | $8,684 | $924.70 | 38% |
| Kenwood | 60 | $8,643 | $810.83 | 41% |
| Glen Ellen | 85 | $8,482 | $799.53 | 43% |
| Eldridge | 21 | $8,410 | $930.61 | 41% |
| Dillon Beach | 82 | $8,062 | $703.26 | 41% |
| Stinson Beach | 106 | $7,814 | $812.15 | 43% |
| Healdsburg | 195 | $7,538 | $744.46 | 41% |
| Calistoga | 101 | $7,312 | $795.93 | 31% |