Santa Rosa Airbnb Market Analysis 2026: Short Term Rental Data & Vacation Rental Statistics in California, United States
Is Airbnb profitable in Santa Rosa in 2026? Explore comprehensive Airbnb analytics for Santa Rosa, California, United States to uncover income potential. This 2026 STR market report for Santa Rosa, based on AirROI data from February 2025 to January 2026, reveals key trends in the market of 393 active listings.
Whether you're considering an Airbnb investment in Santa Rosa, optimizing your existing vacation rental, or exploring rental arbitrage opportunities, understanding the Santa Rosa Airbnb data is crucial. Leveraging the low regulation environment is key to maximizing your short term rental income potential. Let's dive into the specifics.
Key Santa Rosa Airbnb Performance Metrics Overview
Monthly Airbnb Revenue Variations & Income Potential in Santa Rosa (2026)
Understanding the monthly revenue variations for Airbnb listings in Santa Rosa is key to maximizing your short term rental income potential. Seasonality significantly impacts earnings. Our analysis, based on data from the past 12 months, shows that the peak revenue month for STRs in Santa Rosa is typically July, while February often presents the lowest earnings, highlighting opportunities for strategic pricing adjustments during shoulder and low seasons. Explore the typical Airbnb income in Santa Rosa across different performance tiers:
- Best-in-class properties (Top 10%) achieve $14,347+ monthly, often utilizing dynamic pricing and superior guest experiences.
- Strong performing properties (Top 25%) earn $8,190 or more, indicating effective management and desirable locations/amenities.
- Typical properties (Median) generate around $4,161 per month, representing the average market performance.
- Entry-level properties (Bottom 25%) see earnings around $1,943, often with potential for optimization.
Average Monthly Airbnb Earnings Trend in Santa Rosa
Santa Rosa Airbnb Occupancy Rate Trends (2026)
Maximize your bookings by understanding the Santa Rosa STR occupancy trends. Seasonal demand shifts significantly influence how often properties are booked. Typically, Julysees the highest demand (peak season occupancy), while January experiences the lowest (low season). Effective strategies, like adjusting minimum stays or offering promotions, can boost occupancy during slower periods. Here's how different property tiers perform in Santa Rosa:
- Best-in-class properties (Top 10%) achieve 80%+ occupancy, indicating high desirability and potentially optimized availability.
- Strong performing properties (Top 25%) maintain 66% or higher occupancy, suggesting good market fit and guest satisfaction.
- Typical properties (Median) have an occupancy rate around 47%.
- Entry-level properties (Bottom 25%) average 27% occupancy, potentially facing higher vacancy.
Average Monthly Occupancy Rate Trend in Santa Rosa
Average Daily Rate (ADR) Airbnb Trends in Santa Rosa (2026)
Effective short term rental pricing strategy in Santa Rosa involves understanding monthly ADR fluctuations. The Average Daily Rate (ADR) for Airbnb in Santa Rosa typically peaks in June and dips lowest during February. Leveraging Airbnb dynamic pricing tools or strategies based on this seasonality can significantly boost revenue. Here's a look at the typical nightly rates achieved:
- Best-in-class properties (Top 10%) command rates of $980+ per night, often due to premium features or locations.
- Strong performing properties (Top 25%) achieve nightly rates of $508 or more.
- Typical properties (Median) charge around $257 per night.
- Entry-level properties (Bottom 25%) earn around $125 per night.
Average Daily Rate (ADR) Trend by Month in Santa Rosa
Get Live Santa Rosa Market Intelligence 👇

Explore Real-time Analytics
Airbnb Seasonality Analysis & Trends in Santa Rosa (2026)
Peak Season (July, August, June)
- Revenue averages $7,930 per month
- Occupancy rates average 51.8%
- Daily rates average $430
Shoulder Season
- Revenue averages $6,506 per month
- Occupancy maintains around 46.4%
- Daily rates hold near $417
Low Season (January, February, March)
- Revenue drops to average $4,473 per month
- Occupancy decreases to average 40.6%
- Daily rates adjust to average $375
Seasonality Insights for Santa Rosa
- The Airbnb seasonality in Santa Rosa shows highly seasonal trends requiring careful strategy. While the sections above show seasonal averages, it's also insightful to look at the extremes:
- During the high season, the absolute peak month showcases Santa Rosa's highest earning potential, with monthly revenues capable of climbing to $8,526, occupancy reaching a high of 53.4%, and ADRs peaking at $438.
- Conversely, the slowest single month of the year, typically falling within the low season, marks the market's lowest point. In this month, revenue might dip to $3,835, occupancy could drop to 34.7%, and ADRs may adjust down to $351.
- Understanding both the seasonal averages and these monthly peaks and troughs in revenue, occupancy, and ADR is crucial for maximizing your Airbnb profit potential in Santa Rosa.
Seasonal Strategies for Maximizing Profit
- Peak Season: Maximize revenue through premium pricing and potentially longer minimum stays. Ensure high availability.
- Low Season: Offer competitive pricing, special promotions (e.g., extended stay discounts), and flexible cancellation policies. Target off-season travelers like remote workers or budget-conscious guests.
- Shoulder Seasons: Implement dynamic pricing that balances peak and low rates. Target weekend travelers or specific events. Offer slightly more flexible terms than peak season.
- Regularly analyze your own performance against these Santa Rosa seasonality benchmarks and adjust your pricing and availability strategy accordingly.
Best Areas for Airbnb Investment in Santa Rosa (2026)
Exploring the top neighborhoods for short-term rentals in Santa Rosa? This section highlights key areas, outlining why they are attractive for hosts and guests, along with notable local attractions. Consider these locations based on your target guest profile and investment strategy.
| Neighborhood / Area | Why Host Here? (Target Guests & Appeal) | Key Attractions & Landmarks |
|---|---|---|
| Downtown Santa Rosa | The heart of the city with a vibrant atmosphere, offering access to shops, restaurants, and cultural events. A great location for both business and leisure travelers. | Santa Rosa Plaza, Luther Burbank Home and Gardens, Podcasts at the Park, Santa Rosa Farmer's Market, Birding at Santa Rosa Creek |
| Franciscan Estates | A cozy neighborhood known for its access to parks and family-friendly environment. Ideal for travelers seeking a quiet retreat while being close to city attractions. | Franciscan Estates Park, Spring Lake Park, Annadel State Park, Santa Rosa Golf and Country Club |
| Cotati | Charming small town atmosphere with a rich history and vibrant community events. Appeals to those looking for a quaint getaway with local charm. | Cotati Historic Downtown, Phoenix Theater, Laguna de Santa Rosa, Wunderlich Park |
| Roseland | A culturally rich area with diverse dining and shopping options. Excellent for guests interested in experiencing the local culture and cuisine. | Roseland Village Shopping Center, local taco trucks, Luis A. Torres Park |
| Fountaingrove | An upscale neighborhood known for its scenic views and luxury homes, appealing to travelers looking for a more exclusive and serene environment. | Fountaingrove Golf and Athletic Club, Fountaingrove Lake, Robert Louis Stevenson Park |
| Sebastopol | A nearby town known for its natural beauty and artsy vibe. Attracts travelers looking for organic farms and wineries in a pastoral setting. | Bodega Bay, Sebastopol Farmers Market, Gravenstein Apple Fair, Laguna de Santa Rosa |
| Santa Rosa East | A neighborhood that provides easy access to both the city and wine country, making it a popular choice for wine lovers and tourists exploring local vineyards. | Sonoma County Museum, Wine Country Trails, Duncan's Mills |
| Sonoma Plaza | The historic center of Sonoma with wine tasting rooms, restaurants, and charming shops. Perfect for guests wanting to explore the heart of wine country. | Sonoma Plaza, Jacuzzi Family Vineyards, Sonoma State Historic Park |
Understanding Airbnb License Requirements & STR Laws in Santa Rosa (2026)
While Santa Rosa, California, United States currently shows low STR regulations, specific Airbnb license requirements might still exist or change. Always verify the latest short term rental regulations and Airbnb license requirements directly with local government authorities for Santa Rosa to ensure full compliance before hosting.
(Source: AirROI data, 2026, based on 8% licensed listings)
Top Performing Airbnb Properties in Santa Rosa (2026)
Benchmark your potential! Explore examples of top-performing Airbnb properties in Santa Rosabased on Trailing Twelve Month (TTM) revenue. Analyze their characteristics, revenue, occupancy rate, and ADR to understand what drives success in this market.
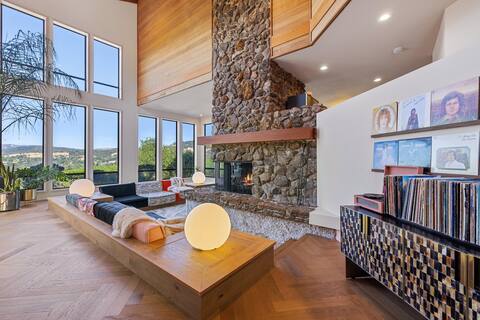
Spectacular & Secluded Wine Country Estate
Entire Place • 3 bedrooms
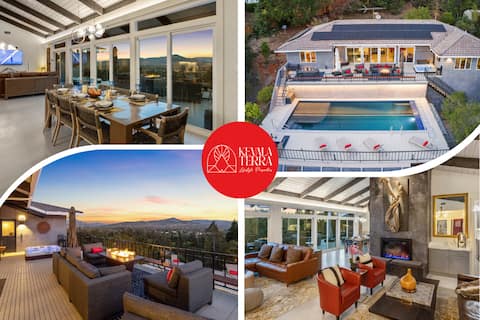
Superb View Wine Country Oasis: Pool-Hottub-Sauna
Entire Place • 4 bedrooms

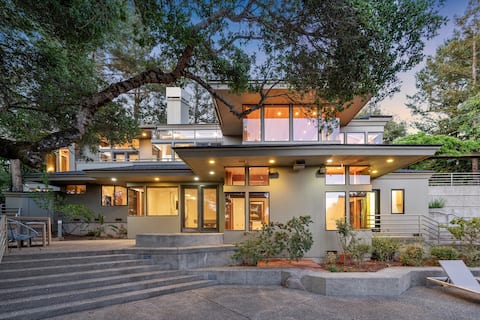
Sonoma Sky: luxury pool & views, newly remodeled
Entire Place • 5 bedrooms
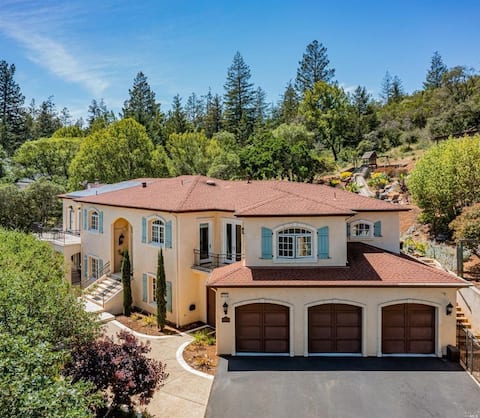
Wine Country Opulent Villa-Brush Creek
Entire Place • 5 bedrooms
Titan: Theater, Heated Pool, Gym, Billiards
Entire Place • 5 bedrooms

Best View Wine Country Oasis: Pool-Hot tub-Sauna
Entire Place • 3 bedrooms
Note: Performance varies based on location, size, amenities, seasonality, and management quality. Data reflects the past 12 months.
Top Performing Airbnb Hosts in Santa Rosa (2026)
Learn from the best! This table showcases top-performing Airbnb hosts in Santa Rosa based on the number of properties managed and estimated total revenue over the past year. Analyze their scale and performance metrics.
| Host Name | Properties | Grossing Revenue | Stay Reviews | Avg Rating |
|---|---|---|---|---|
| Kohmsa Stays | 7 | $1,469,694 | 374 | 4.97/5.0 |
| Ted | 6 | $674,885 | 1131 | 4.93/5.0 |
| AvantStay Sonoma | 6 | $667,859 | 222 | 4.67/5.0 |
| Jefferson | 2 | $636,716 | 169 | 4.96/5.0 |
| Sarah | 2 | $557,001 | 180 | 4.99/5.0 |
| Patrick James | 7 | $509,160 | 1229 | 4.82/5.0 |
| Wine Country Estate Management | 6 | $481,045 | 552 | 4.85/5.0 |
| Cynthia | 12 | $480,766 | 1184 | 4.88/5.0 |
| Plushy | 15 | $479,588 | 118 | 4.61/5.0 |
| Amanda | 4 | $460,142 | 330 | 4.94/5.0 |
Analyzing the strategies of top hosts, such as their property selection, pricing, and guest communication, can offer valuable lessons for optimizing your own Airbnb operations in Santa Rosa.
Dive Deeper: Advanced Santa Rosa STR Market Data (2026)
Ready to unlock more insights? AirROI provides access to advanced metrics and comprehensive Airbnb data for Santa Rosa. Explore detailed analytics beyond this report to refine your investment strategy, optimize pricing, and maximize your vacation rental profits.
Explore Advanced MetricsSanta Rosa Short-Term Rental Market Composition (2026): Property & Room Types
Room Type Distribution
Property Type Distribution
Market Composition Insights for Santa Rosa
- The Santa Rosa Airbnb market composition is heavily skewed towards Entire Home/Apt listings, which make up 83.2% of the 393 active rentals. This indicates strong guest preference for privacy and space.
- Looking at the property type distribution in Santa Rosa, House properties are the most common (72.5%), reflecting the local real estate landscape.
- Houses represent a significant 72.5% portion, catering likely to families or larger groups.
- The presence of 11.2% Hotel/Boutique listings indicates integration with traditional hospitality.
- Smaller segments like others, outdoor/unique, unique stays (combined 5.6%) offer potential for unique stay experiences.
Santa Rosa Airbnb Room Capacity Analysis (2026): Bedroom Distribution
Distribution of Listings by Number of Bedrooms
Room Capacity Insights for Santa Rosa
- The dominant room capacity in Santa Rosa is 3 bedrooms listings, making up 22.4% of the market. This suggests a strong demand for properties suitable for families or small groups.
- Together, 3 bedrooms and 1 bedroom properties represent 43.8% of the active Airbnb listings in Santa Rosa, indicating a high concentration in these sizes.
- A significant 46.1% of listings offer 3+ bedrooms, catering to larger groups and families seeking more space in Santa Rosa.
Santa Rosa Vacation Rental Guest Capacity Trends (2026)
Distribution of Listings by Guest Capacity
Guest Capacity Insights for Santa Rosa
- The most common guest capacity trend in Santa Rosa vacation rentals is listings accommodating 8+ guests (27%). This suggests the primary traveler segment is likely larger groups.
- Properties designed for 8+ guests and 2 guests dominate the Santa Rosa STR market, accounting for 51.9% of listings.
- 44.8% of properties accommodate 6+ guests, serving the market segment for larger families or group travel in Santa Rosa.
- On average, properties in Santa Rosa are equipped to host 4.4 guests.
Santa Rosa Airbnb Booking Patterns (2026): Available vs. Booked Days
Available Days Distribution
Booked Days Distribution
Booking Pattern Insights for Santa Rosa
- The most common availability pattern in Santa Rosa falls within the 271-366 days range, representing 37.2% of listings. This suggests many properties have significant open periods on their calendars.
- Approximately 73.8% of listings show high availability (181+ days open annually), indicating potential for increased bookings or specific owner usage patterns.
- For booked days, the 91-180 days range is most frequent in Santa Rosa (34.1%), reflecting common guest stay durations or potential owner blocking patterns.
- A notable 29.5% of properties secure long booking periods (181+ days booked per year), highlighting successful long-term rental strategies or significant owner usage.
Santa Rosa Airbnb Minimum Stay Requirements Analysis
Distribution of Listings by Minimum Night Requirement
1 Night
64 listings
16.3% of total
2 Nights
117 listings
29.8% of total
3 Nights
20 listings
5.1% of total
4-6 Nights
7 listings
1.8% of total
7-29 Nights
27 listings
6.9% of total
30+ Nights
157 listings
40.1% of total
Key Insights
- The most prevalent minimum stay requirement in Santa Rosa is 30+ Nights, adopted by 40.1% of listings. This highlights the market's preference for longer commitments.
- A significant segment (40.1%) caters to monthly stays (30+ nights) in Santa Rosa, pointing to opportunities in the extended-stay market.
Recommendations
- Align with the market by considering a 30+ Nights minimum stay, as 40.1% of Santa Rosa hosts use this setting.
- If feasible, allowing 1-night stays, especially midweek or during low season, could capture last-minute bookings, as only 16.3% currently do.
- Explore offering discounts for stays of 30+ nights to attract the 40.1% of the market seeking extended stays.
- Adjust minimum nights based on seasonality – potentially shorter during low season and longer during peak demand periods in Santa Rosa.
Santa Rosa Airbnb Cancellation Policy Trends Analysis (2026)
Limited
11 listings
2.8% of total
Super Strict 60 Days
1 listings
0.3% of total
Super Strict 30 Days
10 listings
2.6% of total
Flexible
44 listings
11.3% of total
Moderate
99 listings
25.4% of total
Firm
170 listings
43.6% of total
Strict
55 listings
14.1% of total
Cancellation Policy Insights for Santa Rosa
- The prevailing Airbnb cancellation policy trend in Santa Rosa is Firm, used by 43.6% of listings.
- A majority (57.7%) of hosts in Santa Rosa utilize Firm or Strict policies, indicating a market where hosts prioritize booking security.
Recommendations for Hosts
- Consider adopting a Firm policy to align with the 43.6% market standard in Santa Rosa.
- Using a Strict policy might deter some guests, as only 14.1% of listings use it. Evaluate if potential revenue protection outweighs possible lower booking rates.
- Regularly review your cancellation policy against competitors and market demand shifts in Santa Rosa.
Santa Rosa STR Booking Lead Time Analysis (2026)
Average Booking Lead Time by Month
Booking Lead Time Insights for Santa Rosa
- The overall average booking lead time for vacation rentals in Santa Rosa is 52 days.
- Guests book furthest in advance for stays during November (average 65 days), likely coinciding with peak travel demand or local events.
- The shortest booking windows occur for stays in January (average 36 days), indicating more last-minute travel plans during this time.
- Seasonally, Fall (62 days avg.) sees the longest lead times, while Winter (40 days avg.) has the shortest, reflecting typical travel planning cycles.
Recommendations for Hosts
- Use the overall average lead time (52 days) as a baseline for your pricing and availability strategy in Santa Rosa.
- For November stays, consider implementing length-of-stay discounts or slightly higher rates for bookings made less than 65 days out to capitalize on advance planning.
- Target marketing efforts for the Fall season well in advance (at least 62 days) to capture early planners.
- Monitor your own booking lead times against these Santa Rosa averages to identify opportunities for dynamic pricing adjustments.
Popular & Essential Airbnb Amenities in Santa Rosa (2026)
Amenity Prevalence
Amenity Insights for Santa Rosa
- Essential amenities in Santa Rosa that guests expect include: Wifi, Smoke alarm, Heating. Lacking these (any) could significantly impact bookings.
- Popular amenities like Hot water, Coffee maker, Free parking on premises are common but not universal. Offering these can provide a competitive edge.
Recommendations for Hosts
- Ensure your listing includes all essential amenities for Santa Rosa: Wifi, Smoke alarm, Heating.
- Prioritize adding missing essentials: Wifi, Smoke alarm, Heating.
- Consider adding popular differentiators like Hot water or Coffee maker to increase appeal.
- Highlight unique or less common amenities you offer (e.g., hot tub, dedicated workspace, EV charger) in your listing description and photos.
- Regularly check competitor amenities in Santa Rosa to stay competitive.
Santa Rosa Airbnb Guest Demographics & Profile Analysis (2026)
Guest Profile Summary for Santa Rosa
- The typical guest profile for Airbnb in Santa Rosa consists of primarily domestic travelers (95%), often arriving from nearby San Francisco, typically belonging to the Post-2000s (Gen Z/Alpha) group (50%), primarily speaking English or Spanish.
- Domestic travelers account for 94.8% of guests.
- Key international markets include United States (94.8%) and United Kingdom (0.8%).
- Top languages spoken are English (65%) followed by Spanish (14.1%).
- A significant demographic segment is the Post-2000s (Gen Z/Alpha) group, representing 50% of guests.
Recommendations for Hosts
- Target domestic marketing efforts towards travelers from San Francisco and Los Angeles.
- Tailor amenities and listing descriptions to appeal to the dominant Post-2000s (Gen Z/Alpha) demographic (e.g., highlight fast WiFi, smart home features, local guides).
- Highlight unique local experiences or amenities relevant to the primary guest profile.
- Consider seasonal promotions aligned with peak travel times for key origin markets.
Nearby Short-Term Rental Market Comparison
How does the Santa Rosa Airbnb market stack up against its neighbors? Compare key performance metrics like average monthly revenue, ADR, and occupancy rates in surrounding areas to understand the broader regional STR landscape.
| Market | Active Properties | Monthly Revenue | Daily Rate | Avg. Occupancy |
|---|---|---|---|---|
| Moss Beach | 34 | $10,092 | $676.91 | 53% |
| Sonoma | 228 | $9,647 | $819.87 | 43% |
| Marshall | 18 | $8,897 | $607.75 | 50% |
| St. Helena | 50 | $8,684 | $924.70 | 38% |
| Kenwood | 60 | $8,643 | $810.83 | 41% |
| Glen Ellen | 85 | $8,482 | $799.53 | 43% |
| Eldridge | 21 | $8,410 | $930.61 | 41% |
| Dillon Beach | 82 | $8,062 | $703.26 | 41% |
| Stinson Beach | 106 | $7,814 | $812.15 | 43% |
| Healdsburg | 195 | $7,538 | $744.46 | 41% |