Santa Monica Airbnb Market Analysis 2026: Short Term Rental Data & Vacation Rental Statistics in California, United States
Is Airbnb profitable in Santa Monica in 2026? Explore comprehensive Airbnb analytics for Santa Monica, California, United States to uncover income potential. This 2026 STR market report for Santa Monica, based on AirROI data from February 2025 to January 2026, reveals key trends in the market of 766 active listings.
Whether you're considering an Airbnb investment in Santa Monica, optimizing your existing vacation rental, or exploring rental arbitrage opportunities, understanding the Santa Monica Airbnb data is crucial. Navigating the high regulation landscape is key to maximizing your short term rental income potential. Let's dive into the specifics.
Key Santa Monica Airbnb Performance Metrics Overview
Monthly Airbnb Revenue Variations & Income Potential in Santa Monica (2026)
Understanding the monthly revenue variations for Airbnb listings in Santa Monica is key to maximizing your short term rental income potential. Seasonality significantly impacts earnings. Our analysis, based on data from the past 12 months, shows that the peak revenue month for STRs in Santa Monica is typically August, while January often presents the lowest earnings, highlighting opportunities for strategic pricing adjustments during shoulder and low seasons. Explore the typical Airbnb income in Santa Monica across different performance tiers:
- Best-in-class properties (Top 10%) achieve $9,081+ monthly, often utilizing dynamic pricing and superior guest experiences.
- Strong performing properties (Top 25%) earn $6,353 or more, indicating effective management and desirable locations/amenities.
- Typical properties (Median) generate around $3,937 per month, representing the average market performance.
- Entry-level properties (Bottom 25%) see earnings around $2,039, often with potential for optimization.
Average Monthly Airbnb Earnings Trend in Santa Monica
Santa Monica Airbnb Occupancy Rate Trends (2026)
Maximize your bookings by understanding the Santa Monica STR occupancy trends. Seasonal demand shifts significantly influence how often properties are booked. Typically, Augustsees the highest demand (peak season occupancy), while January experiences the lowest (low season). Effective strategies, like adjusting minimum stays or offering promotions, can boost occupancy during slower periods. Here's how different property tiers perform in Santa Monica:
- Best-in-class properties (Top 10%) achieve 89%+ occupancy, indicating high desirability and potentially optimized availability.
- Strong performing properties (Top 25%) maintain 79% or higher occupancy, suggesting good market fit and guest satisfaction.
- Typical properties (Median) have an occupancy rate around 58%.
- Entry-level properties (Bottom 25%) average 29% occupancy, potentially facing higher vacancy.
Average Monthly Occupancy Rate Trend in Santa Monica
Average Daily Rate (ADR) Airbnb Trends in Santa Monica (2026)
Effective short term rental pricing strategy in Santa Monica involves understanding monthly ADR fluctuations. The Average Daily Rate (ADR) for Airbnb in Santa Monica typically peaks in June and dips lowest during February. Leveraging Airbnb dynamic pricing tools or strategies based on this seasonality can significantly boost revenue. Here's a look at the typical nightly rates achieved:
- Best-in-class properties (Top 10%) command rates of $473+ per night, often due to premium features or locations.
- Strong performing properties (Top 25%) achieve nightly rates of $330 or more.
- Typical properties (Median) charge around $224 per night.
- Entry-level properties (Bottom 25%) earn around $159 per night.
Average Daily Rate (ADR) Trend by Month in Santa Monica
Get Live Santa Monica Market Intelligence 👇

Explore Real-time Analytics
Airbnb Seasonality Analysis & Trends in Santa Monica (2026)
Peak Season (August, July, June)
- Revenue averages $5,324 per month
- Occupancy rates average 57.8%
- Daily rates average $286
Shoulder Season
- Revenue averages $4,740 per month
- Occupancy maintains around 54.8%
- Daily rates hold near $276
Low Season (January, November, December)
- Revenue drops to average $3,977 per month
- Occupancy decreases to average 48.2%
- Daily rates adjust to average $276
Seasonality Insights for Santa Monica
- The Airbnb seasonality in Santa Monica shows moderate seasonality with distinct peak and low periods. While the sections above show seasonal averages, it's also insightful to look at the extremes:
- During the high season, the absolute peak month showcases Santa Monica's highest earning potential, with monthly revenues capable of climbing to $5,362, occupancy reaching a high of 59.3%, and ADRs peaking at $289.
- Conversely, the slowest single month of the year, typically falling within the low season, marks the market's lowest point. In this month, revenue might dip to $3,556, occupancy could drop to 43.2%, and ADRs may adjust down to $258.
- Understanding both the seasonal averages and these monthly peaks and troughs in revenue, occupancy, and ADR is crucial for maximizing your Airbnb profit potential in Santa Monica.
Seasonal Strategies for Maximizing Profit
- Peak Season: Maximize revenue through premium pricing and potentially longer minimum stays. Ensure high availability.
- Low Season: Offer competitive pricing, special promotions (e.g., extended stay discounts), and flexible cancellation policies. Target off-season travelers like remote workers or budget-conscious guests.
- Shoulder Seasons: Implement dynamic pricing that balances peak and low rates. Target weekend travelers or specific events. Offer slightly more flexible terms than peak season.
- Regularly analyze your own performance against these Santa Monica seasonality benchmarks and adjust your pricing and availability strategy accordingly.
Best Areas for Airbnb Investment in Santa Monica (2026)
Exploring the top neighborhoods for short-term rentals in Santa Monica? This section highlights key areas, outlining why they are attractive for hosts and guests, along with notable local attractions. Consider these locations based on your target guest profile and investment strategy.
| Neighborhood / Area | Why Host Here? (Target Guests & Appeal) | Key Attractions & Landmarks |
|---|---|---|
| Ocean Park | A laid-back beachside neighborhood known for its relaxed vibe, Ocean Park attracts visitors looking for a more local experience while still being close to the beach. | Santa Monica Pier, Third Street Promenade, Palisades Park, Ocean Park Beach, Santa Monica Farmers Market |
| Downtown Santa Monica | The bustling heart of Santa Monica with shopping, dining, and entertainment options. Perfect for tourists wanting easy access to the beach and iconic attractions. | Santa Monica Place, Santa Monica Pier, Third Street Promenade, Pacific Park, Bergamot Station |
| North of Montana | An upscale residential area featuring luxurious homes and proximity to the ocean, ideal for guests looking for a quiet and affluent stay. | Montana Avenue shops, Gordon House, Laguna Beach, Santa Monica Mountains, Palisades Park |
| Sunset Park | A charming neighborhood that offers a mix of residential and commercial areas, known for its artistic vibe. Great for those seeking a unique Airbnb experience. | Refrigerator Art Gallery, Truxton's, Pico Boulevard, Sunset Park |
| Breeze Avenue | This street runs close to the beach and offers a delightful blend of beach access and local Santa Monica living. Popular with families and beachgoers. | Venice Beach, Boardwalk, Santa Monica Beach, Marina Del Rey |
| Wilshire Boulevard | A major thoroughfare that enjoys high visibility and convenient access to various Santa Monica attractions, making it appealing for tourists. | Santa Monica Place, Civic Center, Tongva Park, Santa Monica Civic Auditorium |
| Pacific Palisades | Located just north of Santa Monica, it's a scenic area with beautiful views, upscale homes, and access to nearby beaches, perfect for high-end guests. | Will Rogers State Historic Park, Pacific Palisades Village, Temescal Canyon, Palisades Park |
| State Beach | Perfect for beach lovers, this area provides direct access to the shoreline and is ideal for those looking to spend their days soaking up the sun and a vibrant beach culture. | The Annenberg Community Beach House, State Beach, Santa Monica Pier, Beach Volleyball Courts, Bike Path |
Understanding Airbnb License Requirements & STR Laws in Santa Monica (2026)
Yes, Santa Monica, California, United States enforces high STR regulations. Obtaining a license and ensuring compliance is almost certainly required according to current 2026 STR laws. Always verify the latest short term rental regulations and Airbnb license requirements directly with local government authorities for Santa Monica to ensure full compliance before hosting.
(Source: AirROI data, 2026, based on 74% licensed listings)
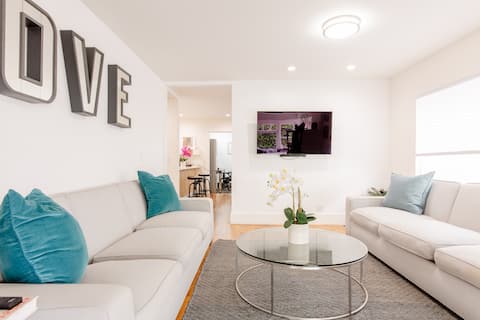
Top Performing Airbnb Properties in Santa Monica (2026)
Benchmark your potential! Explore examples of top-performing Airbnb properties in Santa Monicabased on Trailing Twelve Month (TTM) revenue. Analyze their characteristics, revenue, occupancy rate, and ADR to understand what drives success in this market.

Bright & Charming Beach House Steps from Ocean
Entire Place • 4 bedrooms

1 min to Sand & Sea - Santa Monica Dream Home
Entire Place • 3 bedrooms

Santa Monica DREAM Modern Home
Entire Place • 3 bedrooms

Santa Monica Beach Front 8 Million $ Estate
Entire Place • 4 bedrooms
Ocean Vista at an Incredible Santa Monica Beachhouse
Entire Place • 5 bedrooms

Block to the Beach - Amazing SantaMonica Craftsman
Entire Place • 3 bedrooms
Note: Performance varies based on location, size, amenities, seasonality, and management quality. Data reflects the past 12 months.
Top Performing Airbnb Hosts in Santa Monica (2026)
Learn from the best! This table showcases top-performing Airbnb hosts in Santa Monica based on the number of properties managed and estimated total revenue over the past year. Analyze their scale and performance metrics.
| Host Name | Properties | Grossing Revenue | Stay Reviews | Avg Rating |
|---|---|---|---|---|
| Sam | 24 | $1,258,470 | 943 | 4.87/5.0 |
| Jack | 18 | $1,015,580 | 390 | 4.65/5.0 |
| John | 12 | $783,756 | 978 | 4.96/5.0 |
| Jennifer | 17 | $598,606 | 273 | 4.96/5.0 |
| Joe | 17 | $510,836 | 515 | 4.73/5.0 |
| Mystique | 4 | $446,546 | 115 | 4.50/5.0 |
| Shawn | 7 | $391,029 | 439 | 4.86/5.0 |
| Peter | 4 | $370,837 | 294 | 4.76/5.0 |
| Walther | 4 | $368,325 | 197 | 4.92/5.0 |
| Gabriel | 4 | $345,410 | 372 | 4.81/5.0 |
Analyzing the strategies of top hosts, such as their property selection, pricing, and guest communication, can offer valuable lessons for optimizing your own Airbnb operations in Santa Monica.
Dive Deeper: Advanced Santa Monica STR Market Data (2026)
Ready to unlock more insights? AirROI provides access to advanced metrics and comprehensive Airbnb data for Santa Monica. Explore detailed analytics beyond this report to refine your investment strategy, optimize pricing, and maximize your vacation rental profits.
Explore Advanced MetricsSanta Monica Short-Term Rental Market Composition (2026): Property & Room Types
Room Type Distribution
Property Type Distribution
Market Composition Insights for Santa Monica
- The Santa Monica Airbnb market composition is heavily skewed towards Entire Home/Apt listings, which make up 81.5% of the 766 active rentals. This indicates strong guest preference for privacy and space.
- Looking at the property type distribution in Santa Monica, Apartment/Condo properties are the most common (69.5%), reflecting the local real estate landscape.
- Houses represent a significant 16.4% portion, catering likely to families or larger groups.
- The presence of 10.4% Hotel/Boutique listings indicates integration with traditional hospitality.
- Smaller segments like others (combined 3.7%) offer potential for unique stay experiences.
Santa Monica Airbnb Room Capacity Analysis (2026): Bedroom Distribution
Distribution of Listings by Number of Bedrooms
Room Capacity Insights for Santa Monica
- The dominant room capacity in Santa Monica is 1 bedroom listings, making up 39.9% of the market. This suggests a strong demand for properties suitable for couples or solo travelers.
- Together, 1 bedroom and 2 bedrooms properties represent 66.4% of the active Airbnb listings in Santa Monica, indicating a high concentration in these sizes.
- Listings with 3+ bedrooms (5.9%) represent a smaller niche, potentially indicating an underserved market for larger group accommodations in Santa Monica.
Santa Monica Vacation Rental Guest Capacity Trends (2026)
Distribution of Listings by Guest Capacity
Guest Capacity Insights for Santa Monica
- The most common guest capacity trend in Santa Monica vacation rentals is listings accommodating 2 guests (36.2%). This suggests the primary traveler segment is likely couples or solo travelers.
- Properties designed for 2 guests and 4 guests dominate the Santa Monica STR market, accounting for 59.8% of listings.
- 11.4% of properties accommodate 6+ guests, serving the market segment for larger families or group travel in Santa Monica.
- On average, properties in Santa Monica are equipped to host 2.9 guests.
Santa Monica Airbnb Booking Patterns (2026): Available vs. Booked Days
Available Days Distribution
Booked Days Distribution
Booking Pattern Insights for Santa Monica
- The most common availability pattern in Santa Monica falls within the 271-366 days range, representing 36.7% of listings. This suggests many properties have significant open periods on their calendars.
- Approximately 64.4% of listings show high availability (181+ days open annually), indicating potential for increased bookings or specific owner usage patterns.
- For booked days, the 91-180 days range is most frequent in Santa Monica (27.7%), reflecting common guest stay durations or potential owner blocking patterns.
- A notable 36.8% of properties secure long booking periods (181+ days booked per year), highlighting successful long-term rental strategies or significant owner usage.
Santa Monica Airbnb Minimum Stay Requirements Analysis
Distribution of Listings by Minimum Night Requirement
1 Night
158 listings
20.6% of total
2 Nights
94 listings
12.3% of total
3 Nights
31 listings
4% of total
4-6 Nights
43 listings
5.6% of total
7-29 Nights
80 listings
10.4% of total
30+ Nights
360 listings
47% of total
Key Insights
- The most prevalent minimum stay requirement in Santa Monica is 30+ Nights, adopted by 47% of listings. This highlights the market's preference for longer commitments.
- A significant segment (47%) caters to monthly stays (30+ nights) in Santa Monica, pointing to opportunities in the extended-stay market.
Recommendations
- Align with the market by considering a 30+ Nights minimum stay, as 47% of Santa Monica hosts use this setting.
- If feasible, allowing 1-night stays, especially midweek or during low season, could capture last-minute bookings, as only 20.6% currently do.
- Explore offering discounts for stays of 30+ nights to attract the 47% of the market seeking extended stays.
- Adjust minimum nights based on seasonality – potentially shorter during low season and longer during peak demand periods in Santa Monica.
Santa Monica Airbnb Cancellation Policy Trends Analysis (2026)
Refundable
4 listings
0.5% of total
Limited
4 listings
0.5% of total
Non-refundable
5 listings
0.7% of total
Super Strict 60 Days
9 listings
1.2% of total
Super Strict 30 Days
14 listings
1.8% of total
Flexible
121 listings
15.9% of total
Moderate
147 listings
19.3% of total
Firm
223 listings
29.2% of total
Strict
236 listings
30.9% of total
Cancellation Policy Insights for Santa Monica
- The prevailing Airbnb cancellation policy trend in Santa Monica is Strict, used by 30.9% of listings.
- A majority (60.1%) of hosts in Santa Monica utilize Firm or Strict policies, indicating a market where hosts prioritize booking security.
Recommendations for Hosts
- Consider adopting a Strict policy to align with the 30.9% market standard in Santa Monica.
- With 30.9% using Strict terms, this is a viable option in Santa Monica, particularly for high-value properties or during peak demand periods.
- Regularly review your cancellation policy against competitors and market demand shifts in Santa Monica.
Santa Monica STR Booking Lead Time Analysis (2026)
Average Booking Lead Time by Month
Booking Lead Time Insights for Santa Monica
- The overall average booking lead time for vacation rentals in Santa Monica is 36 days.
- Guests book furthest in advance for stays during August (average 46 days), likely coinciding with peak travel demand or local events.
- The shortest booking windows occur for stays in February (average 30 days), indicating more last-minute travel plans during this time.
- Seasonally, Summer (45 days avg.) sees the longest lead times, while Winter (33 days avg.) has the shortest, reflecting typical travel planning cycles.
Recommendations for Hosts
- Use the overall average lead time (36 days) as a baseline for your pricing and availability strategy in Santa Monica.
- Target marketing efforts for the Summer season well in advance (at least 45 days) to capture early planners.
- Monitor your own booking lead times against these Santa Monica averages to identify opportunities for dynamic pricing adjustments.
Popular & Essential Airbnb Amenities in Santa Monica (2026)
Amenity Prevalence
Amenity Insights for Santa Monica
- Essential amenities in Santa Monica that guests expect include: Wifi, Smoke alarm. Lacking these (any) could significantly impact bookings.
- Popular amenities like TV, Heating, Hot water are common but not universal. Offering these can provide a competitive edge.
Recommendations for Hosts
- Ensure your listing includes all essential amenities for Santa Monica: Wifi, Smoke alarm.
- Prioritize adding missing essentials: Wifi, Smoke alarm.
- Consider adding popular differentiators like TV or Heating to increase appeal.
- Highlight unique or less common amenities you offer (e.g., hot tub, dedicated workspace, EV charger) in your listing description and photos.
- Regularly check competitor amenities in Santa Monica to stay competitive.
Santa Monica Airbnb Guest Demographics & Profile Analysis (2026)
Guest Profile Summary for Santa Monica
- The typical guest profile for Airbnb in Santa Monica consists of primarily domestic travelers (74%), often arriving from nearby New York, typically belonging to the Post-2000s (Gen Z/Alpha) group (50%), primarily speaking English or Spanish.
- Domestic travelers account for 73.7% of guests.
- Key international markets include United States (73.7%) and United Kingdom (4.5%).
- Top languages spoken are English (53.9%) followed by Spanish (14.1%).
- A significant demographic segment is the Post-2000s (Gen Z/Alpha) group, representing 50% of guests.
Recommendations for Hosts
- Target domestic marketing efforts towards travelers from New York and Los Angeles.
- Tailor amenities and listing descriptions to appeal to the dominant Post-2000s (Gen Z/Alpha) demographic (e.g., highlight fast WiFi, smart home features, local guides).
- Highlight unique local experiences or amenities relevant to the primary guest profile.
- Consider seasonal promotions aligned with peak travel times for key origin markets.
Nearby Short-Term Rental Market Comparison
How does the Santa Monica Airbnb market stack up against its neighbors? Compare key performance metrics like average monthly revenue, ADR, and occupancy rates in surrounding areas to understand the broader regional STR landscape.
| Market | Active Properties | Monthly Revenue | Daily Rate | Avg. Occupancy |
|---|---|---|---|---|
| Montecito | 127 | $10,744 | $950.35 | 51% |
| Newport Beach | 1,273 | $8,950 | $744.06 | 47% |
| Malibu | 251 | $8,293 | $1263.89 | 35% |
| Manhattan Beach | 267 | $7,875 | $585.30 | 53% |
| Toro Canyon | 33 | $6,935 | $717.58 | 42% |
| Avalon | 249 | $6,705 | $696.60 | 38% |
| Summerland | 88 | $6,323 | $494.72 | 49% |
| Rancho Santa Fe | 34 | $6,074 | $913.16 | 35% |
| Unincorporated Santa Monica Mountains | 119 | $6,008 | $699.60 | 38% |
| Encinitas | 559 | $5,940 | $543.93 | 49% |