Santa Barbara Airbnb Market Analysis 2026: Short Term Rental Data & Vacation Rental Statistics in California, United States
Is Airbnb profitable in Santa Barbara in 2026? Explore comprehensive Airbnb analytics for Santa Barbara, California, United States to uncover income potential. This 2026 STR market report for Santa Barbara, based on AirROI data from February 2025 to January 2026, reveals key trends in the bustling market of 1,001 active listings.
Whether you're considering an Airbnb investment in Santa Barbara, optimizing your existing vacation rental, or exploring rental arbitrage opportunities, understanding the Santa Barbara Airbnb data is crucial. Leveraging the low regulation environment is key to maximizing your short term rental income potential. Let's dive into the specifics.
Key Santa Barbara Airbnb Performance Metrics Overview
Monthly Airbnb Revenue Variations & Income Potential in Santa Barbara (2026)
Understanding the monthly revenue variations for Airbnb listings in Santa Barbara is key to maximizing your short term rental income potential. Seasonality significantly impacts earnings. Our analysis, based on data from the past 12 months, shows that the peak revenue month for STRs in Santa Barbara is typically July, while January often presents the lowest earnings, highlighting opportunities for strategic pricing adjustments during shoulder and low seasons. Explore the typical Airbnb income in Santa Barbara across different performance tiers:
- Best-in-class properties (Top 10%) achieve $16,161+ monthly, often utilizing dynamic pricing and superior guest experiences.
- Strong performing properties (Top 25%) earn $9,783 or more, indicating effective management and desirable locations/amenities.
- Typical properties (Median) generate around $5,490 per month, representing the average market performance.
- Entry-level properties (Bottom 25%) see earnings around $2,843, often with potential for optimization.
Average Monthly Airbnb Earnings Trend in Santa Barbara
Santa Barbara Airbnb Occupancy Rate Trends (2026)
Maximize your bookings by understanding the Santa Barbara STR occupancy trends. Seasonal demand shifts significantly influence how often properties are booked. Typically, Julysees the highest demand (peak season occupancy), while January experiences the lowest (low season). Effective strategies, like adjusting minimum stays or offering promotions, can boost occupancy during slower periods. Here's how different property tiers perform in Santa Barbara:
- Best-in-class properties (Top 10%) achieve 87%+ occupancy, indicating high desirability and potentially optimized availability.
- Strong performing properties (Top 25%) maintain 74% or higher occupancy, suggesting good market fit and guest satisfaction.
- Typical properties (Median) have an occupancy rate around 55%.
- Entry-level properties (Bottom 25%) average 31% occupancy, potentially facing higher vacancy.
Average Monthly Occupancy Rate Trend in Santa Barbara
Average Daily Rate (ADR) Airbnb Trends in Santa Barbara (2026)
Effective short term rental pricing strategy in Santa Barbara involves understanding monthly ADR fluctuations. The Average Daily Rate (ADR) for Airbnb in Santa Barbara typically peaks in June and dips lowest during February. Leveraging Airbnb dynamic pricing tools or strategies based on this seasonality can significantly boost revenue. Here's a look at the typical nightly rates achieved:
- Best-in-class properties (Top 10%) command rates of $864+ per night, often due to premium features or locations.
- Strong performing properties (Top 25%) achieve nightly rates of $525 or more.
- Typical properties (Median) charge around $323 per night.
- Entry-level properties (Bottom 25%) earn around $206 per night.
Average Daily Rate (ADR) Trend by Month in Santa Barbara
Get Live Santa Barbara Market Intelligence 👇

Explore Real-time Analytics
Airbnb Seasonality Analysis & Trends in Santa Barbara (2026)
Peak Season (July, August, June)
- Revenue averages $9,345 per month
- Occupancy rates average 59.0%
- Daily rates average $456
Shoulder Season
- Revenue averages $7,599 per month
- Occupancy maintains around 51.2%
- Daily rates hold near $436
Low Season (January, February, September)
- Revenue drops to average $6,149 per month
- Occupancy decreases to average 47.0%
- Daily rates adjust to average $416
Seasonality Insights for Santa Barbara
- The Airbnb seasonality in Santa Barbara shows moderate seasonality with distinct peak and low periods. While the sections above show seasonal averages, it's also insightful to look at the extremes:
- During the high season, the absolute peak month showcases Santa Barbara's highest earning potential, with monthly revenues capable of climbing to $9,962, occupancy reaching a high of 62.2%, and ADRs peaking at $462.
- Conversely, the slowest single month of the year, typically falling within the low season, marks the market's lowest point. In this month, revenue might dip to $5,045, occupancy could drop to 38.1%, and ADRs may adjust down to $407.
- Understanding both the seasonal averages and these monthly peaks and troughs in revenue, occupancy, and ADR is crucial for maximizing your Airbnb profit potential in Santa Barbara.
Seasonal Strategies for Maximizing Profit
- Peak Season: Maximize revenue through premium pricing and potentially longer minimum stays. Ensure high availability.
- Low Season: Offer competitive pricing, special promotions (e.g., extended stay discounts), and flexible cancellation policies. Target off-season travelers like remote workers or budget-conscious guests.
- Shoulder Seasons: Implement dynamic pricing that balances peak and low rates. Target weekend travelers or specific events. Offer slightly more flexible terms than peak season.
- Regularly analyze your own performance against these Santa Barbara seasonality benchmarks and adjust your pricing and availability strategy accordingly.
Best Areas for Airbnb Investment in Santa Barbara (2026)
Exploring the top neighborhoods for short-term rentals in Santa Barbara? This section highlights key areas, outlining why they are attractive for hosts and guests, along with notable local attractions. Consider these locations based on your target guest profile and investment strategy.
| Neighborhood / Area | Why Host Here? (Target Guests & Appeal) | Key Attractions & Landmarks |
|---|---|---|
| West Beach | A picturesque area known for its stunning Santa Barbara waterfront and proximity to shops and restaurants. Ideal for tourists who want easy access to the beach and vibrant downtown. | Stearns Wharf, Santa Barbara Harbor, East Beach, West Beach, Funk Zone |
| East Beach | Family-friendly beach destination with recreational opportunities such as volleyball and picnic areas. Attracts families and beachgoers looking for a relaxed atmosphere. | East Beach, Santa Barbara Zoo, Montecito, Sandyland Road, Santa Barbara Museum of Natural History |
| Lower Village | Charming community area in Montecito with upscale shopping and dining. Perfect for travelers seeking a luxurious and tranquil getaway. | Montecito's upscale boutiques, Historic sites, Fine dining restaurants, Spas |
| Santa Barbara Downtown | Vibrant cultural and commercial hub with restaurants, shops, and historic sites. A must-visit for anyone looking to experience the local culture and lifestyle. | State Street, Old Mission Santa Barbara, Santa Barbara County Courthouse, The Granada Theatre, El Presidio de Santa Barbara |
| Hope Ranch | Exclusive residential area known for its scenic views and luxury homes. Attracts visitors looking for a prestigious and private experience. | Hope Ranch Beach, Horse trails, Golf club, Scenic estates |
| Mission Canyon | Beautiful canyon area with natural attractions, ideal for outdoor enthusiasts. Great for visitors seeking hikes and nature experiences. | Botanical Garden, Hiking trails, Natural beauty spots |
| Mesa | A laid-back coastal community offering scenic views and easy access to beaches. Appeals to those looking for a relaxed beach lifestyle and community vibe. | Shoreline Park, Mesa Lane Beach, Local shops and restaurants, Hiking paths |
| San Ysidro Ranch | Luxurious resort area known for its beauty and historical significance. Ideal for high-end travelers looking for romance and relaxation. | San Ysidro Ranch, Private estate, Gorgeous landscaping, Spa services |
Understanding Airbnb License Requirements & STR Laws in Santa Barbara (2026)
While Santa Barbara, California, United States currently shows low STR regulations, specific Airbnb license requirements might still exist or change. Always verify the latest short term rental regulations and Airbnb license requirements directly with local government authorities for Santa Barbara to ensure full compliance before hosting.
(Source: AirROI data, 2026, finding no licensed listings among those analyzed)
Top Performing Airbnb Properties in Santa Barbara (2026)
Benchmark your potential! Explore examples of top-performing Airbnb properties in Santa Barbarabased on Trailing Twelve Month (TTM) revenue. Analyze their characteristics, revenue, occupancy rate, and ADR to understand what drives success in this market.
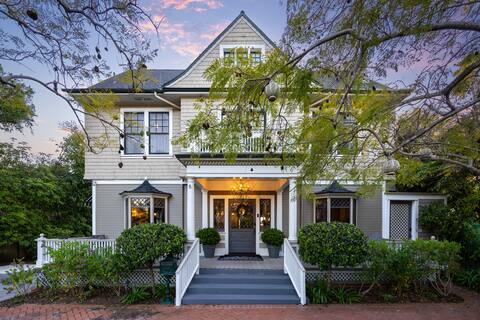
Beautiful 8 Bed/8 Bath Victorian Home Downtown SB
Entire Place • 8 bedrooms
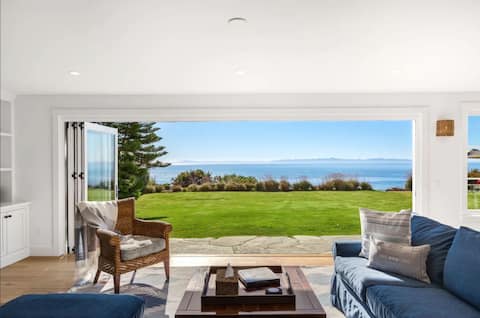
Shoreline Bliss: Oceanfront - Walk to Beach - Dogs
Entire Place • 4 bedrooms

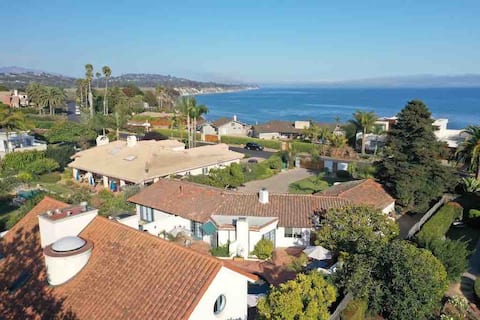
Santa Barbara Oceanfront Villa
Entire Place • 5 bedrooms
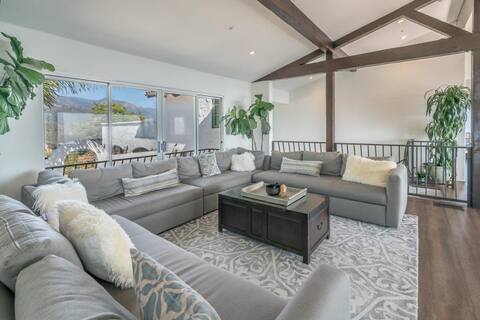
Expansive Ocean and Mtn views in paradise!
Entire Place • 8 bedrooms

Beautifully Renovated Downtown Home w/ 6 Bathrooms
Entire Place • 5 bedrooms
Luxury Beach Villas - Private Beach, Baja Pool/Spa
Entire Place • 6 bedrooms
Note: Performance varies based on location, size, amenities, seasonality, and management quality. Data reflects the past 12 months.
Top Performing Airbnb Hosts in Santa Barbara (2026)
Learn from the best! This table showcases top-performing Airbnb hosts in Santa Barbara based on the number of properties managed and estimated total revenue over the past year. Analyze their scale and performance metrics.
| Host Name | Properties | Grossing Revenue | Stay Reviews | Avg Rating |
|---|---|---|---|---|
| Paradise Retreats | 49 | $5,324,765 | 668 | 4.83/5.0 |
| Zenstay | 65 | $4,896,185 | 2556 | 4.96/5.0 |
| Haller Coastal | 22 | $2,439,370 | 481 | 4.92/5.0 |
| Vacation Rentals | 25 | $1,684,561 | 481 | 4.85/5.0 |
| Santa Barbara Vacation Rentals | 10 | $1,679,409 | 197 | 4.84/5.0 |
| Brent | 6 | $1,654,054 | 367 | 4.98/5.0 |
| Cody | 17 | $1,523,701 | 1977 | 4.98/5.0 |
| Wanderlust Luxury Rentals | 9 | $1,236,454 | 183 | 4.85/5.0 |
| Lucas | 4 | $1,136,643 | 429 | 4.98/5.0 |
| Santa Barbara Luxury Beach Get | 12 | $915,838 | 2123 | 4.88/5.0 |
Analyzing the strategies of top hosts, such as their property selection, pricing, and guest communication, can offer valuable lessons for optimizing your own Airbnb operations in Santa Barbara.
Dive Deeper: Advanced Santa Barbara STR Market Data (2026)
Ready to unlock more insights? AirROI provides access to advanced metrics and comprehensive Airbnb data for Santa Barbara. Explore detailed analytics beyond this report to refine your investment strategy, optimize pricing, and maximize your vacation rental profits.
Explore Advanced MetricsSanta Barbara Short-Term Rental Market Composition (2026): Property & Room Types
Room Type Distribution
Property Type Distribution
Market Composition Insights for Santa Barbara
- The Santa Barbara Airbnb market composition is heavily skewed towards Entire Home/Apt listings, which make up 82.9% of the 1,001 active rentals. This indicates strong guest preference for privacy and space.
- Looking at the property type distribution in Santa Barbara, House properties are the most common (53.4%), reflecting the local real estate landscape.
- Houses represent a significant 53.4% portion, catering likely to families or larger groups.
- The presence of 15.8% Hotel/Boutique listings indicates integration with traditional hospitality.
- Smaller segments like outdoor/unique, unique stays (combined 0.8%) offer potential for unique stay experiences.
Santa Barbara Airbnb Room Capacity Analysis (2026): Bedroom Distribution
Distribution of Listings by Number of Bedrooms
Room Capacity Insights for Santa Barbara
- The dominant room capacity in Santa Barbara is 1 bedroom listings, making up 40.4% of the market. This suggests a strong demand for properties suitable for couples or solo travelers.
- Together, 1 bedroom and 2 bedrooms properties represent 62.9% of the active Airbnb listings in Santa Barbara, indicating a high concentration in these sizes.
- A significant 26.1% of listings offer 3+ bedrooms, catering to larger groups and families seeking more space in Santa Barbara.
Santa Barbara Vacation Rental Guest Capacity Trends (2026)
Distribution of Listings by Guest Capacity
Guest Capacity Insights for Santa Barbara
- The most common guest capacity trend in Santa Barbara vacation rentals is listings accommodating 2 guests (31.7%). This suggests the primary traveler segment is likely couples or solo travelers.
- Properties designed for 2 guests and 4 guests dominate the Santa Barbara STR market, accounting for 53.2% of listings.
- 28.9% of properties accommodate 6+ guests, serving the market segment for larger families or group travel in Santa Barbara.
- On average, properties in Santa Barbara are equipped to host 3.8 guests.
Santa Barbara Airbnb Booking Patterns (2026): Available vs. Booked Days
Available Days Distribution
Booked Days Distribution
Booking Pattern Insights for Santa Barbara
- The most common availability pattern in Santa Barbara falls within the 271-366 days range, representing 32.8% of listings. This suggests many properties have significant open periods on their calendars.
- Approximately 65.1% of listings show high availability (181+ days open annually), indicating potential for increased bookings or specific owner usage patterns.
- For booked days, the 91-180 days range is most frequent in Santa Barbara (31.8%), reflecting common guest stay durations or potential owner blocking patterns.
- A notable 36.9% of properties secure long booking periods (181+ days booked per year), highlighting successful long-term rental strategies or significant owner usage.
Santa Barbara Airbnb Minimum Stay Requirements Analysis
Distribution of Listings by Minimum Night Requirement
1 Night
283 listings
28.3% of total
2 Nights
101 listings
10.1% of total
3 Nights
40 listings
4% of total
4-6 Nights
25 listings
2.5% of total
7-29 Nights
100 listings
10% of total
30+ Nights
452 listings
45.2% of total
Key Insights
- The most prevalent minimum stay requirement in Santa Barbara is 30+ Nights, adopted by 45.2% of listings. This highlights the market's preference for longer commitments.
- A significant segment (45.2%) caters to monthly stays (30+ nights) in Santa Barbara, pointing to opportunities in the extended-stay market.
Recommendations
- Align with the market by considering a 30+ Nights minimum stay, as 45.2% of Santa Barbara hosts use this setting.
- If feasible, allowing 1-night stays, especially midweek or during low season, could capture last-minute bookings, as only 28.3% currently do.
- Explore offering discounts for stays of 30+ nights to attract the 45.2% of the market seeking extended stays.
- Adjust minimum nights based on seasonality – potentially shorter during low season and longer during peak demand periods in Santa Barbara.
Santa Barbara Airbnb Cancellation Policy Trends Analysis (2026)
Refundable
2 listings
0.2% of total
Non-refundable
1 listings
0.1% of total
Super Strict 60 Days
76 listings
7.6% of total
Super Strict 30 Days
39 listings
3.9% of total
Limited
22 listings
2.2% of total
Flexible
136 listings
13.6% of total
Moderate
187 listings
18.7% of total
Firm
362 listings
36.2% of total
Strict
174 listings
17.4% of total
Cancellation Policy Insights for Santa Barbara
- The prevailing Airbnb cancellation policy trend in Santa Barbara is Firm, used by 36.2% of listings.
- A majority (53.6%) of hosts in Santa Barbara utilize Firm or Strict policies, indicating a market where hosts prioritize booking security.
Recommendations for Hosts
- Consider adopting a Firm policy to align with the 36.2% market standard in Santa Barbara.
- Regularly review your cancellation policy against competitors and market demand shifts in Santa Barbara.
Santa Barbara STR Booking Lead Time Analysis (2026)
Average Booking Lead Time by Month
Booking Lead Time Insights for Santa Barbara
- The overall average booking lead time for vacation rentals in Santa Barbara is 55 days.
- Guests book furthest in advance for stays during June (average 74 days), likely coinciding with peak travel demand or local events.
- The shortest booking windows occur for stays in March (average 43 days), indicating more last-minute travel plans during this time.
- Seasonally, Summer (65 days avg.) sees the longest lead times, while Winter (45 days avg.) has the shortest, reflecting typical travel planning cycles.
Recommendations for Hosts
- Use the overall average lead time (55 days) as a baseline for your pricing and availability strategy in Santa Barbara.
- For June stays, consider implementing length-of-stay discounts or slightly higher rates for bookings made less than 74 days out to capitalize on advance planning.
- Target marketing efforts for the Summer season well in advance (at least 65 days) to capture early planners.
- Monitor your own booking lead times against these Santa Barbara averages to identify opportunities for dynamic pricing adjustments.
Popular & Essential Airbnb Amenities in Santa Barbara (2026)
Amenity Prevalence
Amenity Insights for Santa Barbara
- Essential amenities in Santa Barbara that guests expect include: Wifi, Smoke alarm. Lacking these (any) could significantly impact bookings.
- Popular amenities like Carbon monoxide alarm, Heating, TV are common but not universal. Offering these can provide a competitive edge.
Recommendations for Hosts
- Ensure your listing includes all essential amenities for Santa Barbara: Wifi, Smoke alarm.
- Prioritize adding missing essentials: Wifi, Smoke alarm.
- Consider adding popular differentiators like Carbon monoxide alarm or Heating to increase appeal.
- Highlight unique or less common amenities you offer (e.g., hot tub, dedicated workspace, EV charger) in your listing description and photos.
- Regularly check competitor amenities in Santa Barbara to stay competitive.
Santa Barbara Airbnb Guest Demographics & Profile Analysis (2026)
Guest Profile Summary for Santa Barbara
- The typical guest profile for Airbnb in Santa Barbara consists of primarily domestic travelers (92%), often arriving from nearby Los Angeles, typically belonging to the Post-2000s (Gen Z/Alpha) group (50%), primarily speaking English or Spanish.
- Domestic travelers account for 91.8% of guests.
- Key international markets include United States (91.8%) and United Kingdom (2%).
- Top languages spoken are English (62.3%) followed by Spanish (15.3%).
- A significant demographic segment is the Post-2000s (Gen Z/Alpha) group, representing 50% of guests.
Recommendations for Hosts
- Target domestic marketing efforts towards travelers from Los Angeles and San Francisco.
- Tailor amenities and listing descriptions to appeal to the dominant Post-2000s (Gen Z/Alpha) demographic (e.g., highlight fast WiFi, smart home features, local guides).
- Highlight unique local experiences or amenities relevant to the primary guest profile.
- Consider seasonal promotions aligned with peak travel times for key origin markets.
Nearby Short-Term Rental Market Comparison
How does the Santa Barbara Airbnb market stack up against its neighbors? Compare key performance metrics like average monthly revenue, ADR, and occupancy rates in surrounding areas to understand the broader regional STR landscape.
| Market | Active Properties | Monthly Revenue | Daily Rate | Avg. Occupancy |
|---|---|---|---|---|
| Montecito | 127 | $10,744 | $950.35 | 51% |
| Malibu | 251 | $8,293 | $1263.89 | 35% |
| Manhattan Beach | 267 | $7,875 | $585.30 | 53% |
| Los Olivos | 30 | $7,240 | $705.20 | 43% |
| Santa Ynez | 119 | $6,967 | $589.34 | 42% |
| Toro Canyon | 33 | $6,935 | $717.58 | 42% |
| Avila Beach | 94 | $6,770 | $582.34 | 41% |
| Avalon | 249 | $6,705 | $696.60 | 38% |
| Summerland | 88 | $6,323 | $494.72 | 49% |
| Unincorporated Santa Monica Mountains | 119 | $6,008 | $699.60 | 38% |