San Jose Airbnb Market Analysis 2026: Short Term Rental Data & Vacation Rental Statistics in California, United States
Is Airbnb profitable in San Jose in 2026? Explore comprehensive Airbnb analytics for San Jose, California, United States to uncover income potential. This 2026 STR market report for San Jose, based on AirROI data from February 2025 to January 2026, reveals key trends in the bustling market of 2,165 active listings.
Whether you're considering an Airbnb investment in San Jose, optimizing your existing vacation rental, or exploring rental arbitrage opportunities, understanding the San Jose Airbnb data is crucial. Leveraging the low regulation environment is key to maximizing your short term rental income potential. Let's dive into the specifics.
Key San Jose Airbnb Performance Metrics Overview
Monthly Airbnb Revenue Variations & Income Potential in San Jose (2026)
Understanding the monthly revenue variations for Airbnb listings in San Jose is key to maximizing your short term rental income potential. Seasonality significantly impacts earnings. Our analysis, based on data from the past 12 months, shows that the peak revenue month for STRs in San Jose is typically July, while January often presents the lowest earnings, highlighting opportunities for strategic pricing adjustments during shoulder and low seasons. Explore the typical Airbnb income in San Jose across different performance tiers:
- Best-in-class properties (Top 10%) achieve $6,767+ monthly, often utilizing dynamic pricing and superior guest experiences.
- Strong performing properties (Top 25%) earn $4,116 or more, indicating effective management and desirable locations/amenities.
- Typical properties (Median) generate around $2,048 per month, representing the average market performance.
- Entry-level properties (Bottom 25%) see earnings around $939, often with potential for optimization.
Average Monthly Airbnb Earnings Trend in San Jose
San Jose Airbnb Occupancy Rate Trends (2026)
Maximize your bookings by understanding the San Jose STR occupancy trends. Seasonal demand shifts significantly influence how often properties are booked. Typically, Julysees the highest demand (peak season occupancy), while January experiences the lowest (low season). Effective strategies, like adjusting minimum stays or offering promotions, can boost occupancy during slower periods. Here's how different property tiers perform in San Jose:
- Best-in-class properties (Top 10%) achieve 87%+ occupancy, indicating high desirability and potentially optimized availability.
- Strong performing properties (Top 25%) maintain 73% or higher occupancy, suggesting good market fit and guest satisfaction.
- Typical properties (Median) have an occupancy rate around 51%.
- Entry-level properties (Bottom 25%) average 26% occupancy, potentially facing higher vacancy.
Average Monthly Occupancy Rate Trend in San Jose
Average Daily Rate (ADR) Airbnb Trends in San Jose (2026)
Effective short term rental pricing strategy in San Jose involves understanding monthly ADR fluctuations. The Average Daily Rate (ADR) for Airbnb in San Jose typically peaks in June and dips lowest during February. Leveraging Airbnb dynamic pricing tools or strategies based on this seasonality can significantly boost revenue. Here's a look at the typical nightly rates achieved:
- Best-in-class properties (Top 10%) command rates of $359+ per night, often due to premium features or locations.
- Strong performing properties (Top 25%) achieve nightly rates of $215 or more.
- Typical properties (Median) charge around $123 per night.
- Entry-level properties (Bottom 25%) earn around $75 per night.
Average Daily Rate (ADR) Trend by Month in San Jose
Get Live San Jose Market Intelligence 👇

Explore Real-time Analytics
Airbnb Seasonality Analysis & Trends in San Jose (2026)
Peak Season (July, June, May)
- Revenue averages $3,659 per month
- Occupancy rates average 55.5%
- Daily rates average $183
Shoulder Season
- Revenue averages $2,968 per month
- Occupancy maintains around 49.4%
- Daily rates hold near $177
Low Season (January, February, November)
- Revenue drops to average $2,466 per month
- Occupancy decreases to average 44.7%
- Daily rates adjust to average $175
Seasonality Insights for San Jose
- The Airbnb seasonality in San Jose shows moderate seasonality with distinct peak and low periods. While the sections above show seasonal averages, it's also insightful to look at the extremes:
- During the high season, the absolute peak month showcases San Jose's highest earning potential, with monthly revenues capable of climbing to $3,833, occupancy reaching a high of 59.0%, and ADRs peaking at $185.
- Conversely, the slowest single month of the year, typically falling within the low season, marks the market's lowest point. In this month, revenue might dip to $2,188, occupancy could drop to 36.9%, and ADRs may adjust down to $157.
- Understanding both the seasonal averages and these monthly peaks and troughs in revenue, occupancy, and ADR is crucial for maximizing your Airbnb profit potential in San Jose.
Seasonal Strategies for Maximizing Profit
- Peak Season: Maximize revenue through premium pricing and potentially longer minimum stays. Ensure high availability.
- Low Season: Offer competitive pricing, special promotions (e.g., extended stay discounts), and flexible cancellation policies. Target off-season travelers like remote workers or budget-conscious guests.
- Shoulder Seasons: Implement dynamic pricing that balances peak and low rates. Target weekend travelers or specific events. Offer slightly more flexible terms than peak season.
- Regularly analyze your own performance against these San Jose seasonality benchmarks and adjust your pricing and availability strategy accordingly.
Best Areas for Airbnb Investment in San Jose (2026)
Exploring the top neighborhoods for short-term rentals in San Jose? This section highlights key areas, outlining why they are attractive for hosts and guests, along with notable local attractions. Consider these locations based on your target guest profile and investment strategy.
| Neighborhood / Area | Why Host Here? (Target Guests & Appeal) | Key Attractions & Landmarks |
|---|---|---|
| Downtown San Jose | The vibrant heart of San Jose, packed with cultural venues, restaurants, and nightlife. Ideal for business travelers and tourists with easy access to attractions like the SAP Center and the San Jose Museum of Art. | SAP Center, San Jose Museum of Art, The Tech Interactive, San Jose McEnery Convention Center, Children's Discovery Museum |
| Willow Glen | A charming, upscale neighborhood with tree-lined streets, boutique shops, and a strong sense of community. Popular for long-term stays and ideal for families visiting the area. | Willow Glen Downtown, Guadalupe River Park, Willow Glen Parks, Local cafes and boutiques |
| Santana Row | A premier shopping, dining, and entertainment destination in San Jose. Culturally rich and luxurious, perfect for attracting visitors looking for a high-end experience. | Santana Row Shopping Center, Ramona Flowers, Bistro Vida, The Mint Cafe, Cinemark Theater |
| Mountain View | Located just north of San Jose, this area is home to many tech companies and has a thriving downtown. Attracts business travelers and tech industry professionals. | Shoreline Park, Computer History Museum, Downtown Mountain View, Castro Street restaurants, Googleplex |
| Almaden Valley | A quieter, family-oriented area with beautiful homes and parks. Ideal for families or longer-term travelers looking for a peaceful stay. | Almaden Quicksilver County Park, Oakridge Shopping Center, local wineries, light hiking trails |
| Los Gatos | Picturesque town nearby with charming shops and a strong community vibe. Great for visitors looking for a quaint and scenic getaway, with easy access to the Silicon Valley. | Vasona Lake County Park, Los Gatos Creek Trail, Downtown Los Gatos, Local vineyards and wineries |
| Japantown | A historic neighborhood known for its rich cultural heritage, restaurants, and unique shops. Attracts visitors interested in culture and food experiences. | Japanese American Museum of San Jose, Shinto Shrine, Local sushi and ramen spots, Cultural festivals |
| Campbell | A vibrant area with a unique downtown that has a mix of dining and shopping options, often hosting events and farmers markets, making it appealing for tourists and locals alike. | Downtown Campbell, Campbell Farmers' Market, San Tomas Aquino Creek Trail, Local theaters and music venues |
Understanding Airbnb License Requirements & STR Laws in San Jose (2026)
While San Jose, California, United States currently shows low STR regulations, specific Airbnb license requirements might still exist or change. Always verify the latest short term rental regulations and Airbnb license requirements directly with local government authorities for San Jose to ensure full compliance before hosting.
(Source: AirROI data, 2026, based on 1% licensed listings)
Top Performing Airbnb Properties in San Jose (2026)
Benchmark your potential! Explore examples of top-performing Airbnb properties in San Josebased on Trailing Twelve Month (TTM) revenue. Analyze their characteristics, revenue, occupancy rate, and ADR to understand what drives success in this market.
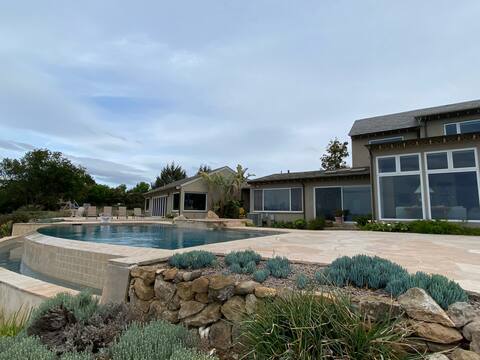
Amazing views, resort like - 6 bedrooms, 7.5 baths
Entire Place • 6 bedrooms
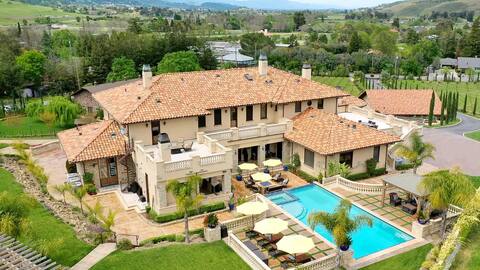
The Villa at The Ranch Almaden
Entire Place • 6 bedrooms
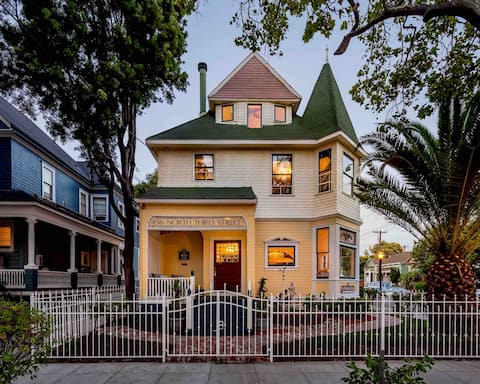
SJ Downtown Historical with Victorian Experience
Entire Place • 6 bedrooms

Luxurious & Grand 8 BR at the heart of San Jose
Entire Place • 8 bedrooms

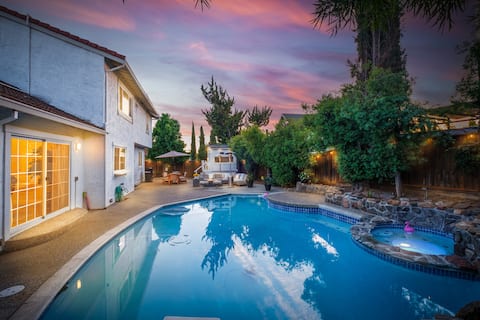
Timeless Tudor w/ Game Room, Pool Table & Hot Tub
Entire Place • 5 bedrooms
Casa Feliz | Pool | Sauna | Family Fun
Entire Place • 5 bedrooms
Note: Performance varies based on location, size, amenities, seasonality, and management quality. Data reflects the past 12 months.
Top Performing Airbnb Hosts in San Jose (2026)
Learn from the best! This table showcases top-performing Airbnb hosts in San Jose based on the number of properties managed and estimated total revenue over the past year. Analyze their scale and performance metrics.
| Host Name | Properties | Grossing Revenue | Stay Reviews | Avg Rating |
|---|---|---|---|---|
| Emily | 65 | $1,960,051 | 885 | 4.76/5.0 |
| Lucy | 33 | $1,206,224 | 3851 | 4.88/5.0 |
| Christina | 40 | $864,168 | 1012 | 4.81/5.0 |
| Deborah | 13 | $697,127 | 621 | 4.64/5.0 |
| Jurgen & Susie | 9 | $619,997 | 1142 | 4.90/5.0 |
| Carlos Jr | 12 | $564,165 | 716 | 4.82/5.0 |
| Daniel & Grace | 24 | $560,697 | 4952 | 4.76/5.0 |
| James | 11 | $532,631 | 750 | 4.79/5.0 |
| Van | 7 | $478,609 | 288 | 4.97/5.0 |
| Allison Rental | 6 | $443,451 | 322 | 4.94/5.0 |
Analyzing the strategies of top hosts, such as their property selection, pricing, and guest communication, can offer valuable lessons for optimizing your own Airbnb operations in San Jose.
Dive Deeper: Advanced San Jose STR Market Data (2026)
Ready to unlock more insights? AirROI provides access to advanced metrics and comprehensive Airbnb data for San Jose. Explore detailed analytics beyond this report to refine your investment strategy, optimize pricing, and maximize your vacation rental profits.
Explore Advanced MetricsSan Jose Short-Term Rental Market Composition (2026): Property & Room Types
Room Type Distribution
Property Type Distribution
Market Composition Insights for San Jose
- The San Jose Airbnb market composition is heavily skewed towards Entire Home/Apt listings, which make up 54.4% of the 2,165 active rentals. This indicates strong guest preference for privacy and space.
- However, a notable 44.6% share for Private Rooms suggests opportunities for budget-conscious travelers or hosts renting out spare rooms.
- Looking at the property type distribution in San Jose, House properties are the most common (64.8%), reflecting the local real estate landscape.
- Houses represent a significant 64.8% portion, catering likely to families or larger groups.
- The presence of 13.1% Hotel/Boutique listings indicates integration with traditional hospitality.
- Smaller segments like outdoor/unique, unique stays (combined 1.0%) offer potential for unique stay experiences.
San Jose Airbnb Room Capacity Analysis (2026): Bedroom Distribution
Distribution of Listings by Number of Bedrooms
Room Capacity Insights for San Jose
- The dominant room capacity in San Jose is 1 bedroom listings, making up 30.7% of the market. This suggests a strong demand for properties suitable for couples or solo travelers.
- Together, 1 bedroom and 2 bedrooms properties represent 44.1% of the active Airbnb listings in San Jose, indicating a high concentration in these sizes.
San Jose Vacation Rental Guest Capacity Trends (2026)
Distribution of Listings by Guest Capacity
Guest Capacity Insights for San Jose
- The most common guest capacity trend in San Jose vacation rentals is listings accommodating 2 guests (17.4%). This suggests the primary traveler segment is likely couples or solo travelers.
- Properties designed for 2 guests and 4 guests dominate the San Jose STR market, accounting for 30.7% of listings.
- 19.9% of properties accommodate 6+ guests, serving the market segment for larger families or group travel in San Jose.
- On average, properties in San Jose are equipped to host 2.7 guests.
San Jose Airbnb Booking Patterns (2026): Available vs. Booked Days
Available Days Distribution
Booked Days Distribution
Booking Pattern Insights for San Jose
- The most common availability pattern in San Jose falls within the 271-366 days range, representing 43.1% of listings. This suggests many properties have significant open periods on their calendars.
- Approximately 73.3% of listings show high availability (181+ days open annually), indicating potential for increased bookings or specific owner usage patterns.
- For booked days, the 91-180 days range is most frequent in San Jose (30.3%), reflecting common guest stay durations or potential owner blocking patterns.
- A notable 27.8% of properties secure long booking periods (181+ days booked per year), highlighting successful long-term rental strategies or significant owner usage.
San Jose Airbnb Minimum Stay Requirements Analysis
Distribution of Listings by Minimum Night Requirement
1 Night
666 listings
30.8% of total
2 Nights
394 listings
18.2% of total
3 Nights
149 listings
6.9% of total
4-6 Nights
133 listings
6.1% of total
7-29 Nights
311 listings
14.4% of total
30+ Nights
512 listings
23.6% of total
Key Insights
- The most prevalent minimum stay requirement in San Jose is 1 Night, adopted by 30.8% of listings. This highlights the market's preference for shorter, flexible bookings.
- A significant segment (23.6%) caters to monthly stays (30+ nights) in San Jose, pointing to opportunities in the extended-stay market.
Recommendations
- Align with the market by considering a 1 Night minimum stay, as 30.8% of San Jose hosts use this setting.
- Explore offering discounts for stays of 30+ nights to attract the 23.6% of the market seeking extended stays.
- Adjust minimum nights based on seasonality – potentially shorter during low season and longer during peak demand periods in San Jose.
San Jose Airbnb Cancellation Policy Trends Analysis (2026)
Super Strict 60 Days
12 listings
0.6% of total
Super Strict 30 Days
7 listings
0.3% of total
Limited
43 listings
2% of total
Flexible
408 listings
18.9% of total
Moderate
817 listings
37.9% of total
Firm
531 listings
24.7% of total
Strict
336 listings
15.6% of total
Cancellation Policy Insights for San Jose
- The prevailing Airbnb cancellation policy trend in San Jose is Moderate, used by 37.9% of listings.
- There's a relatively balanced mix between guest-friendly (56.8%) and stricter (40.3%) policies, offering choices for different guest needs.
Recommendations for Hosts
- Consider adopting a Moderate policy to align with the 37.9% market standard in San Jose.
- Regularly review your cancellation policy against competitors and market demand shifts in San Jose.
San Jose STR Booking Lead Time Analysis (2026)
Average Booking Lead Time by Month
Booking Lead Time Insights for San Jose
- The overall average booking lead time for vacation rentals in San Jose is 28 days.
- Guests book furthest in advance for stays during July (average 43 days), likely coinciding with peak travel demand or local events.
- The shortest booking windows occur for stays in March (average 20 days), indicating more last-minute travel plans during this time.
- Seasonally, Summer (40 days avg.) sees the longest lead times, while Winter (25 days avg.) has the shortest, reflecting typical travel planning cycles.
Recommendations for Hosts
- Use the overall average lead time (28 days) as a baseline for your pricing and availability strategy in San Jose.
- For July stays, consider implementing length-of-stay discounts or slightly higher rates for bookings made less than 43 days out to capitalize on advance planning.
- Target marketing efforts for the Summer season well in advance (at least 40 days) to capture early planners.
- Monitor your own booking lead times against these San Jose averages to identify opportunities for dynamic pricing adjustments.
Popular & Essential Airbnb Amenities in San Jose (2026)
Amenity Prevalence
Amenity Insights for San Jose
- Essential amenities in San Jose that guests expect include: Wifi, Smoke alarm. Lacking these (any) could significantly impact bookings.
- Popular amenities like Heating, Hot water, Carbon monoxide alarm are common but not universal. Offering these can provide a competitive edge.
Recommendations for Hosts
- Ensure your listing includes all essential amenities for San Jose: Wifi, Smoke alarm.
- Prioritize adding missing essentials: Wifi, Smoke alarm.
- Consider adding popular differentiators like Heating or Hot water to increase appeal.
- Highlight unique or less common amenities you offer (e.g., hot tub, dedicated workspace, EV charger) in your listing description and photos.
- Regularly check competitor amenities in San Jose to stay competitive.
San Jose Airbnb Guest Demographics & Profile Analysis (2026)
Guest Profile Summary for San Jose
- The typical guest profile for Airbnb in San Jose consists of primarily domestic travelers (88%), often arriving from nearby San Jose, typically belonging to the Post-2000s (Gen Z/Alpha) group (50%), primarily speaking English or Spanish.
- Domestic travelers account for 88.2% of guests.
- Key international markets include United States (88.2%) and Canada (2%).
- Top languages spoken are English (57.6%) followed by Spanish (15%).
- A significant demographic segment is the Post-2000s (Gen Z/Alpha) group, representing 50% of guests.
Recommendations for Hosts
- Target domestic marketing efforts towards travelers from San Jose and Los Angeles.
- Tailor amenities and listing descriptions to appeal to the dominant Post-2000s (Gen Z/Alpha) demographic (e.g., highlight fast WiFi, smart home features, local guides).
- Highlight unique local experiences or amenities relevant to the primary guest profile.
- Consider seasonal promotions aligned with peak travel times for key origin markets.
Nearby Short-Term Rental Market Comparison
How does the San Jose Airbnb market stack up against its neighbors? Compare key performance metrics like average monthly revenue, ADR, and occupancy rates in surrounding areas to understand the broader regional STR landscape.
| Market | Active Properties | Monthly Revenue | Daily Rate | Avg. Occupancy |
|---|---|---|---|---|
| Carmel Point | 15 | $14,483 | $1046.17 | 54% |
| Del Monte Forest | 105 | $10,280 | $964.89 | 47% |
| Moss Beach | 34 | $10,092 | $676.91 | 53% |
| Sonoma | 228 | $9,647 | $819.87 | 43% |
| Marshall | 18 | $8,897 | $607.75 | 50% |
| St. Helena | 50 | $8,684 | $924.70 | 38% |
| Carmel-by-the-Sea | 305 | $8,657 | $680.02 | 49% |
| Kenwood | 60 | $8,643 | $810.83 | 41% |
| Glen Ellen | 85 | $8,482 | $799.53 | 43% |
| Eldridge | 21 | $8,410 | $930.61 | 41% |