San Diego Airbnb Market Analysis 2026: Short Term Rental Data & Vacation Rental Statistics in California, United States
Is Airbnb profitable in San Diego in 2026? Explore comprehensive Airbnb analytics for San Diego, California, United States to uncover income potential. This 2026 STR market report for San Diego, based on AirROI data from February 2025 to January 2026, reveals key trends in the bustling market of 9,276 active listings.
Whether you're considering an Airbnb investment in San Diego, optimizing your existing vacation rental, or exploring rental arbitrage opportunities, understanding the San Diego Airbnb data is crucial. Navigating the high regulation landscape is key to maximizing your short term rental income potential. Let's dive into the specifics.
Key San Diego Airbnb Performance Metrics Overview
Monthly Airbnb Revenue Variations & Income Potential in San Diego (2026)
Understanding the monthly revenue variations for Airbnb listings in San Diego is key to maximizing your short term rental income potential. Seasonality significantly impacts earnings. Our analysis, based on data from the past 12 months, shows that the peak revenue month for STRs in San Diego is typically July, while January often presents the lowest earnings, highlighting opportunities for strategic pricing adjustments during shoulder and low seasons. Explore the typical Airbnb income in San Diego across different performance tiers:
- Best-in-class properties (Top 10%) achieve $12,791+ monthly, often utilizing dynamic pricing and superior guest experiences.
- Strong performing properties (Top 25%) earn $7,824 or more, indicating effective management and desirable locations/amenities.
- Typical properties (Median) generate around $4,505 per month, representing the average market performance.
- Entry-level properties (Bottom 25%) see earnings around $2,340, often with potential for optimization.
Average Monthly Airbnb Earnings Trend in San Diego
San Diego Airbnb Occupancy Rate Trends (2026)
Maximize your bookings by understanding the San Diego STR occupancy trends. Seasonal demand shifts significantly influence how often properties are booked. Typically, Julysees the highest demand (peak season occupancy), while January experiences the lowest (low season). Effective strategies, like adjusting minimum stays or offering promotions, can boost occupancy during slower periods. Here's how different property tiers perform in San Diego:
- Best-in-class properties (Top 10%) achieve 86%+ occupancy, indicating high desirability and potentially optimized availability.
- Strong performing properties (Top 25%) maintain 74% or higher occupancy, suggesting good market fit and guest satisfaction.
- Typical properties (Median) have an occupancy rate around 55%.
- Entry-level properties (Bottom 25%) average 33% occupancy, potentially facing higher vacancy.
Average Monthly Occupancy Rate Trend in San Diego
Average Daily Rate (ADR) Airbnb Trends in San Diego (2026)
Effective short term rental pricing strategy in San Diego involves understanding monthly ADR fluctuations. The Average Daily Rate (ADR) for Airbnb in San Diego typically peaks in July and dips lowest during February. Leveraging Airbnb dynamic pricing tools or strategies based on this seasonality can significantly boost revenue. Here's a look at the typical nightly rates achieved:
- Best-in-class properties (Top 10%) command rates of $718+ per night, often due to premium features or locations.
- Strong performing properties (Top 25%) achieve nightly rates of $438 or more.
- Typical properties (Median) charge around $255 per night.
- Entry-level properties (Bottom 25%) earn around $154 per night.
Average Daily Rate (ADR) Trend by Month in San Diego
Get Live San Diego Market Intelligence 👇

Explore Real-time Analytics
Airbnb Seasonality Analysis & Trends in San Diego (2026)
Peak Season (July, June, August)
- Revenue averages $8,466 per month
- Occupancy rates average 61.5%
- Daily rates average $395
Shoulder Season
- Revenue averages $5,847 per month
- Occupancy maintains around 51.8%
- Daily rates hold near $356
Low Season (January, February, November)
- Revenue drops to average $4,616 per month
- Occupancy decreases to average 47.1%
- Daily rates adjust to average $334
Seasonality Insights for San Diego
- The Airbnb seasonality in San Diego shows highly seasonal trends requiring careful strategy. While the sections above show seasonal averages, it's also insightful to look at the extremes:
- During the high season, the absolute peak month showcases San Diego's highest earning potential, with monthly revenues capable of climbing to $9,691, occupancy reaching a high of 65.7%, and ADRs peaking at $412.
- Conversely, the slowest single month of the year, typically falling within the low season, marks the market's lowest point. In this month, revenue might dip to $4,135, occupancy could drop to 39.6%, and ADRs may adjust down to $321.
- Understanding both the seasonal averages and these monthly peaks and troughs in revenue, occupancy, and ADR is crucial for maximizing your Airbnb profit potential in San Diego.
Seasonal Strategies for Maximizing Profit
- Peak Season: Maximize revenue through premium pricing and potentially longer minimum stays. Ensure high availability.
- Low Season: Offer competitive pricing, special promotions (e.g., extended stay discounts), and flexible cancellation policies. Target off-season travelers like remote workers or budget-conscious guests.
- Shoulder Seasons: Implement dynamic pricing that balances peak and low rates. Target weekend travelers or specific events. Offer slightly more flexible terms than peak season.
- Regularly analyze your own performance against these San Diego seasonality benchmarks and adjust your pricing and availability strategy accordingly.
Best Areas for Airbnb Investment in San Diego (2026)
Exploring the top neighborhoods for short-term rentals in San Diego? This section highlights key areas, outlining why they are attractive for hosts and guests, along with notable local attractions. Consider these locations based on your target guest profile and investment strategy.
| Neighborhood / Area | Why Host Here? (Target Guests & Appeal) | Key Attractions & Landmarks |
|---|---|---|
| Gaslamp Quarter | Historic district in Downtown San Diego, famous for its nightlife, dining, and Victorian architecture. Popular with tourists wanting to experience the vibrant city life and cultural attractions. | San Diego Convention Center, Petco Park, The Shout! House, Restaurants and bars, Gaslamp Museum |
| La Jolla | Coastal neighborhood known for its stunning beaches, upscale shopping, and fine dining. Attracts tourists looking for both relaxation and adventure on the Pacific coast. | La Jolla Cove, Torrey Pines State Beach, Scripps Institution of Oceanography, La Jolla Shores, Birch Aquarium |
| Mission Beach | Iconic beach community with a laid-back vibe, popular for its boardwalk, beach activities, and amusement parks. Great for families and beachgoers seeking fun in the sun. | Mission Beach Boardwalk, Belmont Park, Mission Bay, Surfing and beach volleyball, Pacific Beach |
| Pacific Beach | Trendy beach area known for its youthful energy, lively bars, and surf culture. A hotspot for young travelers and those looking for beach parties and nightlife. | Crystal Pier, Pacific Beach Boardwalk, Beachfront bars and restaurants, Mission Bay Park, Surfing schools |
| North Park | Hip neighborhood known for its craft breweries, art galleries, and diverse dining options. Attracts young adults and creatives looking for a unique urban experience. | North Park Observatory, Local craft breweries, Historic theater, Street art murals, Farmers' markets |
| Coronado | Beautiful island community across the bay from downtown, famous for its resort-style living and beaches. Ideal for those seeking a peaceful beach getaway close to the city. | Coronado Central Beach, Hotel del Coronado, Coronado Ferry Landing, Biking paths, Crown Cove State Park |
| Old Town | Historic heart of San Diego with rich cultural heritage and traditional Mexican vibe. Popular with visitors interested in the history and culture of the region. | Old Town San Diego State Historic Park, Restaurants and shops, Whaley House Museum, Old Town Market, Cultural festivals |
| Point Loma | Scenic coastal neighborhood known for its stunning views, maritime history, and outdoor activities. Perfect for those wanting to explore maritime attractions and natural beauty. | Cabrillo National Monument, Point Loma Lighthouse, Sunset Cliffs Natural Park, Harbor excursions, Maritime museums |
Understanding Airbnb License Requirements & STR Laws in San Diego (2026)
Yes, San Diego, California, United States enforces high STR regulations. Obtaining a license and ensuring compliance is almost certainly required according to current 2026 STR laws. Always verify the latest short term rental regulations and Airbnb license requirements directly with local government authorities for San Diego to ensure full compliance before hosting.
(Source: AirROI data, 2026, based on 84% licensed listings)
Top Performing Airbnb Properties in San Diego (2026)
Benchmark your potential! Explore examples of top-performing Airbnb properties in San Diegobased on Trailing Twelve Month (TTM) revenue. Analyze their characteristics, revenue, occupancy rate, and ADR to understand what drives success in this market.

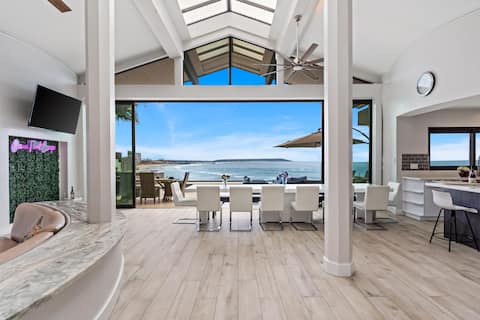
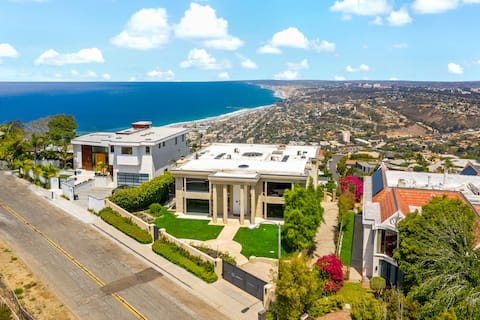
9,000 sq ft Celebrity Oceanfront Estate, La Jolla
Entire Place • 8 bedrooms
Pool/Endless Views/Spend Easter @the Beach/
Entire Place • 10 bedrooms

Ocean View ☆ Steps to Beach & Dining ☆ AC ☆ DogsOK
Entire Place • 2 bedrooms

Blue Sea Villa, Centered in La Jolla Shores!
Entire Place • 5 bedrooms

Family Focused- Pool- Ocean Views-15 person dining
Entire Place • 5 bedrooms
La Jolla Top Of The World Mansion
Entire Place • 6 bedrooms
Note: Performance varies based on location, size, amenities, seasonality, and management quality. Data reflects the past 12 months.
Top Performing Airbnb Hosts in San Diego (2026)
Learn from the best! This table showcases top-performing Airbnb hosts in San Diego based on the number of properties managed and estimated total revenue over the past year. Analyze their scale and performance metrics.
| Host Name | Properties | Grossing Revenue | Stay Reviews | Avg Rating |
|---|---|---|---|---|
| Bluewater Vacation Homes | 90 | $16,216,686 | 3756 | 4.84/5.0 |
| Coast Vacation Homes | 101 | $13,624,312 | 3378 | 4.94/5.0 |
| Drift Vacation Homes | 70 | $12,553,248 | 1747 | 4.94/5.0 |
| NXT Vacation | 95 | $12,458,277 | 1551 | 4.92/5.0 |
| Surf Style Vacation Homes | 152 | $10,526,887 | 2022 | 4.74/5.0 |
| AvantStay San Diego | 53 | $7,933,082 | 2997 | 4.71/5.0 |
| La Jolla Vacation Rentals | 82 | $6,692,834 | 4333 | 4.72/5.0 |
| Evan | 86 | $6,063,163 | 15061 | 4.83/5.0 |
| Cindy | 31 | $5,321,082 | 2787 | 4.90/5.0 |
| Aaron | 54 | $4,791,624 | 4134 | 4.82/5.0 |
Analyzing the strategies of top hosts, such as their property selection, pricing, and guest communication, can offer valuable lessons for optimizing your own Airbnb operations in San Diego.
Dive Deeper: Advanced San Diego STR Market Data (2026)
Ready to unlock more insights? AirROI provides access to advanced metrics and comprehensive Airbnb data for San Diego. Explore detailed analytics beyond this report to refine your investment strategy, optimize pricing, and maximize your vacation rental profits.
Explore Advanced MetricsSan Diego Short-Term Rental Market Composition (2026): Property & Room Types
Room Type Distribution
Property Type Distribution
Market Composition Insights for San Diego
- The San Diego Airbnb market composition is heavily skewed towards Entire Home/Apt listings, which make up 89.2% of the 9,276 active rentals. This indicates strong guest preference for privacy and space.
- Looking at the property type distribution in San Diego, House properties are the most common (53.2%), reflecting the local real estate landscape.
- Houses represent a significant 53.2% portion, catering likely to families or larger groups.
- The presence of 7.3% Hotel/Boutique listings indicates integration with traditional hospitality.
- Smaller segments like others, outdoor/unique (combined 3.8%) offer potential for unique stay experiences.
San Diego Airbnb Room Capacity Analysis (2026): Bedroom Distribution
Distribution of Listings by Number of Bedrooms
Room Capacity Insights for San Diego
- The dominant room capacity in San Diego is 1 bedroom listings, making up 29.2% of the market. This suggests a strong demand for properties suitable for couples or solo travelers.
- Together, 1 bedroom and 2 bedrooms properties represent 54.2% of the active Airbnb listings in San Diego, indicating a high concentration in these sizes.
- A significant 30.7% of listings offer 3+ bedrooms, catering to larger groups and families seeking more space in San Diego.
San Diego Vacation Rental Guest Capacity Trends (2026)
Distribution of Listings by Guest Capacity
Guest Capacity Insights for San Diego
- The most common guest capacity trend in San Diego vacation rentals is listings accommodating 8+ guests (23.8%). This suggests the primary traveler segment is likely larger groups.
- Properties designed for 8+ guests and 4 guests dominate the San Diego STR market, accounting for 43.8% of listings.
- 42.2% of properties accommodate 6+ guests, serving the market segment for larger families or group travel in San Diego.
- On average, properties in San Diego are equipped to host 4.7 guests.
San Diego Airbnb Booking Patterns (2026): Available vs. Booked Days
Available Days Distribution
Booked Days Distribution
Booking Pattern Insights for San Diego
- The most common availability pattern in San Diego falls within the 91-180 days range, representing 31% of listings. This suggests many properties have significant open periods on their calendars.
- Approximately 60.3% of listings show high availability (181+ days open annually), indicating potential for increased bookings or specific owner usage patterns.
- For booked days, the 181-270 days range is most frequent in San Diego (31.5%), reflecting common guest stay durations or potential owner blocking patterns.
- A notable 41.1% of properties secure long booking periods (181+ days booked per year), highlighting successful long-term rental strategies or significant owner usage.
San Diego Airbnb Minimum Stay Requirements Analysis
Distribution of Listings by Minimum Night Requirement
1 Night
772 listings
8.3% of total
2 Nights
2189 listings
23.6% of total
3 Nights
792 listings
8.5% of total
4-6 Nights
494 listings
5.3% of total
7-29 Nights
686 listings
7.4% of total
30+ Nights
4342 listings
46.8% of total
Key Insights
- The most prevalent minimum stay requirement in San Diego is 30+ Nights, adopted by 46.8% of listings. This highlights the market's preference for longer commitments.
- A significant segment (46.8%) caters to monthly stays (30+ nights) in San Diego, pointing to opportunities in the extended-stay market.
Recommendations
- Align with the market by considering a 30+ Nights minimum stay, as 46.8% of San Diego hosts use this setting.
- If feasible, allowing 1-night stays, especially midweek or during low season, could capture last-minute bookings, as only 8.3% currently do.
- Explore offering discounts for stays of 30+ nights to attract the 46.8% of the market seeking extended stays.
- Adjust minimum nights based on seasonality – potentially shorter during low season and longer during peak demand periods in San Diego.
San Diego Airbnb Cancellation Policy Trends Analysis (2026)
Limited
232 listings
2.5% of total
Non-refundable
2 listings
0% of total
Refundable
7 listings
0.1% of total
Super Strict 30 Days
279 listings
3% of total
Super Strict 60 Days
217 listings
2.3% of total
Flexible
1089 listings
11.8% of total
Moderate
1838 listings
19.9% of total
Firm
3742 listings
40.5% of total
Strict
1838 listings
19.9% of total
Cancellation Policy Insights for San Diego
- The prevailing Airbnb cancellation policy trend in San Diego is Firm, used by 40.5% of listings.
- A majority (60.4%) of hosts in San Diego utilize Firm or Strict policies, indicating a market where hosts prioritize booking security.
Recommendations for Hosts
- Consider adopting a Firm policy to align with the 40.5% market standard in San Diego.
- Regularly review your cancellation policy against competitors and market demand shifts in San Diego.
San Diego STR Booking Lead Time Analysis (2026)
Average Booking Lead Time by Month
Booking Lead Time Insights for San Diego
- The overall average booking lead time for vacation rentals in San Diego is 45 days.
- Guests book furthest in advance for stays during July (average 64 days), likely coinciding with peak travel demand or local events.
- The shortest booking windows occur for stays in February (average 36 days), indicating more last-minute travel plans during this time.
- Seasonally, Summer (55 days avg.) sees the longest lead times, while Winter (39 days avg.) has the shortest, reflecting typical travel planning cycles.
Recommendations for Hosts
- Use the overall average lead time (45 days) as a baseline for your pricing and availability strategy in San Diego.
- For July stays, consider implementing length-of-stay discounts or slightly higher rates for bookings made less than 64 days out to capitalize on advance planning.
- Target marketing efforts for the Summer season well in advance (at least 55 days) to capture early planners.
- Monitor your own booking lead times against these San Diego averages to identify opportunities for dynamic pricing adjustments.
Popular & Essential Airbnb Amenities in San Diego (2026)
Amenity Prevalence
Amenity Insights for San Diego
- Essential amenities in San Diego that guests expect include: Wifi, Smoke alarm, TV. Lacking these (any) could significantly impact bookings.
- Popular amenities like Carbon monoxide alarm, Heating, Hot water are common but not universal. Offering these can provide a competitive edge.
Recommendations for Hosts
- Ensure your listing includes all essential amenities for San Diego: Wifi, Smoke alarm, TV.
- Prioritize adding missing essentials: Wifi, Smoke alarm, TV.
- Consider adding popular differentiators like Carbon monoxide alarm or Heating to increase appeal.
- Highlight unique or less common amenities you offer (e.g., hot tub, dedicated workspace, EV charger) in your listing description and photos.
- Regularly check competitor amenities in San Diego to stay competitive.
San Diego Airbnb Guest Demographics & Profile Analysis (2026)
Guest Profile Summary for San Diego
- The typical guest profile for Airbnb in San Diego consists of primarily domestic travelers (91%), often arriving from nearby San Diego, typically belonging to the Post-2000s (Gen Z/Alpha) group (50%), primarily speaking English or Spanish.
- Domestic travelers account for 91.2% of guests.
- Key international markets include United States (91.2%) and Canada (1.5%).
- Top languages spoken are English (63.8%) followed by Spanish (17%).
- A significant demographic segment is the Post-2000s (Gen Z/Alpha) group, representing 50% of guests.
Recommendations for Hosts
- Target domestic marketing efforts towards travelers from San Diego and Los Angeles.
- Tailor amenities and listing descriptions to appeal to the dominant Post-2000s (Gen Z/Alpha) demographic (e.g., highlight fast WiFi, smart home features, local guides).
- Highlight unique local experiences or amenities relevant to the primary guest profile.
- Consider seasonal promotions aligned with peak travel times for key origin markets.
Nearby Short-Term Rental Market Comparison
How does the San Diego Airbnb market stack up against its neighbors? Compare key performance metrics like average monthly revenue, ADR, and occupancy rates in surrounding areas to understand the broader regional STR landscape.
| Market | Active Properties | Monthly Revenue | Daily Rate | Avg. Occupancy |
|---|---|---|---|---|
| Newport Beach | 1,273 | $8,950 | $744.06 | 47% |
| Rancho San Diego | 25 | $8,649 | $568.72 | 48% |
| Thousand Palms | 33 | $8,119 | $725.48 | 36% |
| Manhattan Beach | 267 | $7,875 | $585.30 | 53% |
| Lakeside | 33 | $7,537 | $604.33 | 44% |
| GlenOak Hills | 41 | $7,394 | $648.65 | 41% |
| Bermuda Dunes | 143 | $7,324 | $664.90 | 39% |
| Mount Helix | 33 | $7,163 | $594.94 | 50% |
| Del Mar | 128 | $7,011 | $671.56 | 45% |
| Avalon | 249 | $6,705 | $696.60 | 38% |