San Buenaventura (Ventura) Airbnb Market Analysis 2026: Short Term Rental Data & Vacation Rental Statistics in California, United States
Is Airbnb profitable in San Buenaventura (Ventura) in 2026? Explore comprehensive Airbnb analytics for San Buenaventura (Ventura), California, United States to uncover income potential. This 2026 STR market report for San Buenaventura (Ventura), based on AirROI data from February 2025 to January 2026, reveals key trends in the niche market of 41 active listings.
Whether you're considering an Airbnb investment in San Buenaventura (Ventura), optimizing your existing vacation rental, or exploring rental arbitrage opportunities, understanding the San Buenaventura (Ventura) Airbnb data is crucial. Leveraging the low regulation environment is key to maximizing your short term rental income potential. Let's dive into the specifics.
Key San Buenaventura (Ventura) Airbnb Performance Metrics Overview
Monthly Airbnb Revenue Variations & Income Potential in San Buenaventura (Ventura) (2026)
Understanding the monthly revenue variations for Airbnb listings in San Buenaventura (Ventura) is key to maximizing your short term rental income potential. Seasonality significantly impacts earnings. Our analysis, based on data from the past 12 months, shows that the peak revenue month for STRs in San Buenaventura (Ventura) is typically August, while January often presents the lowest earnings, highlighting opportunities for strategic pricing adjustments during shoulder and low seasons. Explore the typical Airbnb income in San Buenaventura (Ventura) across different performance tiers:
- Best-in-class properties (Top 10%) achieve $12,327+ monthly, often utilizing dynamic pricing and superior guest experiences.
- Strong performing properties (Top 25%) earn $8,371 or more, indicating effective management and desirable locations/amenities.
- Typical properties (Median) generate around $5,077 per month, representing the average market performance.
- Entry-level properties (Bottom 25%) see earnings around $3,239, often with potential for optimization.
Average Monthly Airbnb Earnings Trend in San Buenaventura (Ventura)
San Buenaventura (Ventura) Airbnb Occupancy Rate Trends (2026)
Maximize your bookings by understanding the San Buenaventura (Ventura) STR occupancy trends. Seasonal demand shifts significantly influence how often properties are booked. Typically, Augustsees the highest demand (peak season occupancy), while January experiences the lowest (low season). Effective strategies, like adjusting minimum stays or offering promotions, can boost occupancy during slower periods. Here's how different property tiers perform in San Buenaventura (Ventura):
- Best-in-class properties (Top 10%) achieve 83%+ occupancy, indicating high desirability and potentially optimized availability.
- Strong performing properties (Top 25%) maintain 72% or higher occupancy, suggesting good market fit and guest satisfaction.
- Typical properties (Median) have an occupancy rate around 56%.
- Entry-level properties (Bottom 25%) average 36% occupancy, potentially facing higher vacancy.
Average Monthly Occupancy Rate Trend in San Buenaventura (Ventura)
Average Daily Rate (ADR) Airbnb Trends in San Buenaventura (Ventura) (2026)
Effective short term rental pricing strategy in San Buenaventura (Ventura) involves understanding monthly ADR fluctuations. The Average Daily Rate (ADR) for Airbnb in San Buenaventura (Ventura) typically peaks in June and dips lowest during February. Leveraging Airbnb dynamic pricing tools or strategies based on this seasonality can significantly boost revenue. Here's a look at the typical nightly rates achieved:
- Best-in-class properties (Top 10%) command rates of $746+ per night, often due to premium features or locations.
- Strong performing properties (Top 25%) achieve nightly rates of $457 or more.
- Typical properties (Median) charge around $299 per night.
- Entry-level properties (Bottom 25%) earn around $197 per night.
Average Daily Rate (ADR) Trend by Month in San Buenaventura (Ventura)
Get Live San Buenaventura (Ventura) Market Intelligence 👇
.png)
Explore Real-time Analytics
Airbnb Seasonality Analysis & Trends in San Buenaventura (Ventura) (2026)
Peak Season (August, July, June)
- Revenue averages $8,001 per month
- Occupancy rates average 61.8%
- Daily rates average $384
Shoulder Season
- Revenue averages $6,290 per month
- Occupancy maintains around 52.6%
- Daily rates hold near $356
Low Season (January, February, October)
- Revenue drops to average $5,035 per month
- Occupancy decreases to average 46.1%
- Daily rates adjust to average $334
Seasonality Insights for San Buenaventura (Ventura)
- The Airbnb seasonality in San Buenaventura (Ventura) shows moderate seasonality with distinct peak and low periods. While the sections above show seasonal averages, it's also insightful to look at the extremes:
- During the high season, the absolute peak month showcases San Buenaventura (Ventura)'s highest earning potential, with monthly revenues capable of climbing to $8,818, occupancy reaching a high of 65.4%, and ADRs peaking at $390.
- Conversely, the slowest single month of the year, typically falling within the low season, marks the market's lowest point. In this month, revenue might dip to $4,434, occupancy could drop to 40.1%, and ADRs may adjust down to $322.
- Understanding both the seasonal averages and these monthly peaks and troughs in revenue, occupancy, and ADR is crucial for maximizing your Airbnb profit potential in San Buenaventura (Ventura).
Seasonal Strategies for Maximizing Profit
- Peak Season: Maximize revenue through premium pricing and potentially longer minimum stays. Ensure high availability.
- Low Season: Offer competitive pricing, special promotions (e.g., extended stay discounts), and flexible cancellation policies. Target off-season travelers like remote workers or budget-conscious guests.
- Shoulder Seasons: Implement dynamic pricing that balances peak and low rates. Target weekend travelers or specific events. Offer slightly more flexible terms than peak season.
- Regularly analyze your own performance against these San Buenaventura (Ventura) seasonality benchmarks and adjust your pricing and availability strategy accordingly.
Best Areas for Airbnb Investment in San Buenaventura (Ventura) (2026)
Exploring the top neighborhoods for short-term rentals in San Buenaventura (Ventura)? This section highlights key areas, outlining why they are attractive for hosts and guests, along with notable local attractions. Consider these locations based on your target guest profile and investment strategy.
| Neighborhood / Area | Why Host Here? (Target Guests & Appeal) | Key Attractions & Landmarks |
|---|---|---|
| Downtown Ventura | Vibrant area with a mix of historic charm and modern amenities. Close to shops, restaurants, and the Ventura Pier, making it attractive for tourists and business travelers. | Ventura Pier, Mission San Buenaventura, Downtown Farmers' Market, Pacific View Mall, Ventura Harbor Village |
| Ventura Beach | Popular coastal destination with beautiful beaches and a laid-back vibe. Ideal for sun-seekers and water sports enthusiasts. | San Buenaventura State Beach, Surfer’s Point, Promenade at Ventura, Ventura Surf Shop, Beachfront Park |
| Westside Ventura | A diverse and artistic neighborhood known for its community spirit and access to local events. Great for travelers looking to experience local culture. | Ventura Botanical Gardens, Westside Community Park, Canvas and Key Art Studio, Local breweries and eateries |
| East Ventura | Family-friendly area with parks and schools. Appeals to visitors seeking a quieter, suburban experience with access to amenities. | Arroyo Verde Park, Saticoy Regional Park, local shopping centers, family-friendly dining options |
| Camarillo | Nearby area with outlet shopping and attractive golf courses, making it suitable for shoppers and golfers. Close proximity to Ventura. | Camarillo Premium Outlets, Camarillo Ranch House, Los Posas Golf Course, local wineries |
| Oxnard | Just a short drive from Ventura, offers additional beach access and a rich cultural scene. Attracts guests wanting variety in their beach experience. | Oxnard State Beach, The Channel Islands, Oxnard Historic District, local seafood restaurants |
| Silver Strand Beach | A unique beach community between Channel Islands Harbor and the ocean. Perfect for those wanting a quaint beach getaway. | Silver Strand Beach, Channel Islands Harbor, water activities, beach volleyball courts |
| Ventura Harbor | A scenic harbor area featuring shops, restaurants, and boat rentals. Great for travelers interested in maritime activities and fresh seafood. | Ventura Harbor Village, Channel Islands National Park tours, Harbor View Park, fresh seafood restaurants |
Understanding Airbnb License Requirements & STR Laws in San Buenaventura (Ventura) (2026)
While San Buenaventura (Ventura), California, United States currently shows low STR regulations, specific Airbnb license requirements might still exist or change. Always verify the latest short term rental regulations and Airbnb license requirements directly with local government authorities for San Buenaventura (Ventura) to ensure full compliance before hosting.
(Source: AirROI data, 2026, based on 5% licensed listings)
Top Performing Airbnb Properties in San Buenaventura (Ventura) (2026)
Benchmark your potential! Explore examples of top-performing Airbnb properties in San Buenaventura (Ventura)based on Trailing Twelve Month (TTM) revenue. Analyze their characteristics, revenue, occupancy rate, and ADR to understand what drives success in this market.

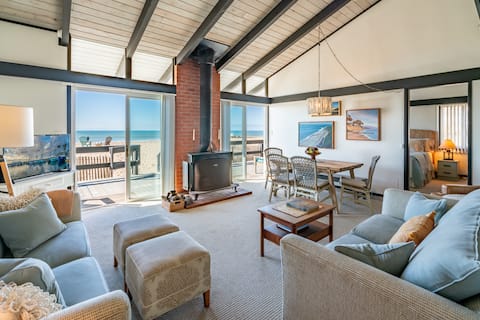
Beachmont Luxurious Beach Escape-Stylish 5BR Haven
Entire Place • 5 bedrooms
Family Tides
Entire Place • 2 bedrooms

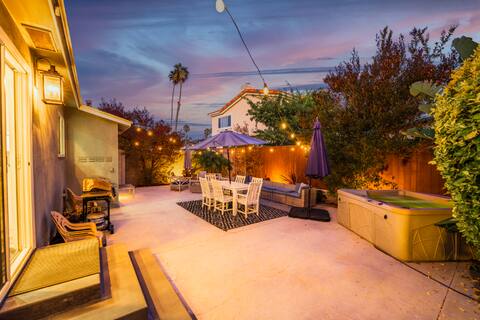
Game Room | Soaking Tub | Cowboy Pool | Sauna
Entire Place • 3 bedrooms

Pacific Combo W/Ocean View Private Patio
Entire Place • 5 bedrooms

Great Reviews/Ocean Views, Hot Tub, 5 Min To Beach
Entire Place • 3 bedrooms
20% Off Feb! Great Reviews, Walk To Beach, Hot Tub
Entire Place • 3 bedrooms
Note: Performance varies based on location, size, amenities, seasonality, and management quality. Data reflects the past 12 months.
Top Performing Airbnb Hosts in San Buenaventura (Ventura) (2026)
Learn from the best! This table showcases top-performing Airbnb hosts in San Buenaventura (Ventura) based on the number of properties managed and estimated total revenue over the past year. Analyze their scale and performance metrics.
| Host Name | Properties | Grossing Revenue | Stay Reviews | Avg Rating |
|---|---|---|---|---|
| SunnyDays | 11 | $884,026 | 215 | 4.77/5.0 |
| Allie | 1 | $241,456 | 122 | 4.98/5.0 |
| Kevin | 2 | $217,215 | 102 | 4.97/5.0 |
| Beach View | 1 | $157,246 | 14 | 4.86/5.0 |
| Oscar | 2 | $149,712 | 90 | 4.96/5.0 |
| Nelly | 1 | $102,184 | 44 | 4.86/5.0 |
| Danny | 1 | $94,566 | 18 | 4.83/5.0 |
| Jeffrey | 1 | $83,470 | 16 | 5.00/5.0 |
| Michael | 1 | $73,577 | 20 | 5.00/5.0 |
| Gordon | 2 | $62,690 | 31 | 4.96/5.0 |
Analyzing the strategies of top hosts, such as their property selection, pricing, and guest communication, can offer valuable lessons for optimizing your own Airbnb operations in San Buenaventura (Ventura).
Dive Deeper: Advanced San Buenaventura (Ventura) STR Market Data (2026)
Ready to unlock more insights? AirROI provides access to advanced metrics and comprehensive Airbnb data for San Buenaventura (Ventura). Explore detailed analytics beyond this report to refine your investment strategy, optimize pricing, and maximize your vacation rental profits.
Explore Advanced MetricsSan Buenaventura (Ventura) Short-Term Rental Market Composition (2026): Property & Room Types
Room Type Distribution
Property Type Distribution
Market Composition Insights for San Buenaventura (Ventura)
- The San Buenaventura (Ventura) Airbnb market composition is heavily skewed towards Entire Home/Apt listings, which make up 95.1% of the 41 active rentals. This indicates strong guest preference for privacy and space.
- Looking at the property type distribution in San Buenaventura (Ventura), House properties are the most common (80.5%), reflecting the local real estate landscape.
- Houses represent a significant 80.5% portion, catering likely to families or larger groups.
- The presence of 12.2% Hotel/Boutique listings indicates integration with traditional hospitality.
San Buenaventura (Ventura) Airbnb Room Capacity Analysis (2026): Bedroom Distribution
Distribution of Listings by Number of Bedrooms
Room Capacity Insights for San Buenaventura (Ventura)
- The dominant room capacity in San Buenaventura (Ventura) is 2 bedrooms listings, making up 26.8% of the market. This suggests a strong demand for properties suitable for couples or solo travelers.
- Together, 2 bedrooms and 1 bedroom properties represent 48.8% of the active Airbnb listings in San Buenaventura (Ventura), indicating a high concentration in these sizes.
- A significant 39.0% of listings offer 3+ bedrooms, catering to larger groups and families seeking more space in San Buenaventura (Ventura).
San Buenaventura (Ventura) Vacation Rental Guest Capacity Trends (2026)
Distribution of Listings by Guest Capacity
Guest Capacity Insights for San Buenaventura (Ventura)
- The most common guest capacity trend in San Buenaventura (Ventura) vacation rentals is listings accommodating 8+ guests (24.4%). This suggests the primary traveler segment is likely larger groups.
- Properties designed for 8+ guests and 4 guests dominate the San Buenaventura (Ventura) STR market, accounting for 43.9% of listings.
- 41.5% of properties accommodate 6+ guests, serving the market segment for larger families or group travel in San Buenaventura (Ventura).
- On average, properties in San Buenaventura (Ventura) are equipped to host 4.9 guests.
San Buenaventura (Ventura) Airbnb Booking Patterns (2026): Available vs. Booked Days
Available Days Distribution
Booked Days Distribution
Booking Pattern Insights for San Buenaventura (Ventura)
- The most common availability pattern in San Buenaventura (Ventura) falls within the 91-180 days range, representing 46.3% of listings. This suggests many properties have significant open periods on their calendars.
- Approximately 53.7% of listings show high availability (181+ days open annually), indicating potential for increased bookings or specific owner usage patterns.
- For booked days, the 181-270 days range is most frequent in San Buenaventura (Ventura) (48.8%), reflecting common guest stay durations or potential owner blocking patterns.
- A notable 48.8% of properties secure long booking periods (181+ days booked per year), highlighting successful long-term rental strategies or significant owner usage.
San Buenaventura (Ventura) Airbnb Minimum Stay Requirements Analysis
Distribution of Listings by Minimum Night Requirement
1 Night
2 listings
4.9% of total
2 Nights
11 listings
26.8% of total
3 Nights
2 listings
4.9% of total
4-6 Nights
1 listings
2.4% of total
7-29 Nights
5 listings
12.2% of total
30+ Nights
20 listings
48.8% of total
Key Insights
- The most prevalent minimum stay requirement in San Buenaventura (Ventura) is 30+ Nights, adopted by 48.8% of listings. This highlights the market's preference for longer commitments.
- A significant segment (48.8%) caters to monthly stays (30+ nights) in San Buenaventura (Ventura), pointing to opportunities in the extended-stay market.
Recommendations
- Align with the market by considering a 30+ Nights minimum stay, as 48.8% of San Buenaventura (Ventura) hosts use this setting.
- If feasible, allowing 1-night stays, especially midweek or during low season, could capture last-minute bookings, as only 4.9% currently do.
- Explore offering discounts for stays of 30+ nights to attract the 48.8% of the market seeking extended stays.
- Adjust minimum nights based on seasonality – potentially shorter during low season and longer during peak demand periods in San Buenaventura (Ventura).
San Buenaventura (Ventura) Airbnb Cancellation Policy Trends Analysis (2026)
Super Strict 30 Days
11 listings
26.8% of total
Flexible
12 listings
29.3% of total
Moderate
6 listings
14.6% of total
Firm
10 listings
24.4% of total
Strict
2 listings
4.9% of total
Cancellation Policy Insights for San Buenaventura (Ventura)
- The prevailing Airbnb cancellation policy trend in San Buenaventura (Ventura) is Flexible, used by 29.3% of listings.
- There's a relatively balanced mix between guest-friendly (43.9%) and stricter (29.3%) policies, offering choices for different guest needs.
- Strict cancellation policies are quite rare (4.9%), potentially making listings with this policy less competitive unless justified by high demand or property type.
Recommendations for Hosts
- Consider adopting a Flexible policy to align with the 29.3% market standard in San Buenaventura (Ventura).
- Using a Strict policy might deter some guests, as only 4.9% of listings use it. Evaluate if potential revenue protection outweighs possible lower booking rates.
- Regularly review your cancellation policy against competitors and market demand shifts in San Buenaventura (Ventura).
San Buenaventura (Ventura) STR Booking Lead Time Analysis (2026)
Average Booking Lead Time by Month
Booking Lead Time Insights for San Buenaventura (Ventura)
- The overall average booking lead time for vacation rentals in San Buenaventura (Ventura) is 43 days.
- Guests book furthest in advance for stays during September (average 63 days), likely coinciding with peak travel demand or local events.
- The shortest booking windows occur for stays in February (average 20 days), indicating more last-minute travel plans during this time.
- Seasonally, Fall (55 days avg.) sees the longest lead times, while Winter (33 days avg.) has the shortest, reflecting typical travel planning cycles.
Recommendations for Hosts
- Use the overall average lead time (43 days) as a baseline for your pricing and availability strategy in San Buenaventura (Ventura).
- For September stays, consider implementing length-of-stay discounts or slightly higher rates for bookings made less than 63 days out to capitalize on advance planning.
- Target marketing efforts for the Fall season well in advance (at least 55 days) to capture early planners.
- Monitor your own booking lead times against these San Buenaventura (Ventura) averages to identify opportunities for dynamic pricing adjustments.
Popular & Essential Airbnb Amenities in San Buenaventura (Ventura) (2026)
Amenity Prevalence
Amenity Insights for San Buenaventura (Ventura)
- Essential amenities in San Buenaventura (Ventura) that guests expect include: Carbon monoxide alarm, Smoke alarm, Wifi, Kitchen. Lacking these (any) could significantly impact bookings.
- Popular amenities like TV, Heating, Shampoo are common but not universal. Offering these can provide a competitive edge.
Recommendations for Hosts
- Ensure your listing includes all essential amenities for San Buenaventura (Ventura): Carbon monoxide alarm, Smoke alarm, Wifi, Kitchen.
- Prioritize adding missing essentials: Kitchen.
- Consider adding popular differentiators like TV or Heating to increase appeal.
- Highlight unique or less common amenities you offer (e.g., hot tub, dedicated workspace, EV charger) in your listing description and photos.
- Regularly check competitor amenities in San Buenaventura (Ventura) to stay competitive.
San Buenaventura (Ventura) Airbnb Guest Demographics & Profile Analysis (2026)
Guest Profile Summary for San Buenaventura (Ventura)
- The typical guest profile for Airbnb in San Buenaventura (Ventura) consists of primarily domestic travelers (96%), often arriving from nearby Los Angeles, typically belonging to the Post-2000s (Gen Z/Alpha) group (50%), primarily speaking English or Spanish.
- Domestic travelers account for 95.5% of guests.
- Key international markets include United States (95.5%) and Switzerland (1%).
- Top languages spoken are English (63.5%) followed by Spanish (18.8%).
- A significant demographic segment is the Post-2000s (Gen Z/Alpha) group, representing 50% of guests.
Recommendations for Hosts
- Target domestic marketing efforts towards travelers from Los Angeles and San Francisco.
- Tailor amenities and listing descriptions to appeal to the dominant Post-2000s (Gen Z/Alpha) demographic (e.g., highlight fast WiFi, smart home features, local guides).
- Highlight unique local experiences or amenities relevant to the primary guest profile.
- Consider seasonal promotions aligned with peak travel times for key origin markets.
Nearby Short-Term Rental Market Comparison
How does the San Buenaventura (Ventura) Airbnb market stack up against its neighbors? Compare key performance metrics like average monthly revenue, ADR, and occupancy rates in surrounding areas to understand the broader regional STR landscape.
| Market | Active Properties | Monthly Revenue | Daily Rate | Avg. Occupancy |
|---|---|---|---|---|
| Montecito | 127 | $10,744 | $950.35 | 51% |
| Malibu | 251 | $8,293 | $1263.89 | 35% |
| Manhattan Beach | 267 | $7,875 | $585.30 | 53% |
| Los Olivos | 30 | $7,240 | $705.20 | 43% |
| Santa Ynez | 119 | $6,967 | $589.34 | 42% |
| Toro Canyon | 33 | $6,935 | $717.58 | 42% |
| Avila Beach | 94 | $6,770 | $582.34 | 41% |
| Avalon | 249 | $6,705 | $696.60 | 38% |
| Summerland | 88 | $6,323 | $494.72 | 49% |
| Unincorporated Santa Monica Mountains | 119 | $6,008 | $699.60 | 38% |