Riverside Airbnb Market Analysis 2026: Short Term Rental Data & Vacation Rental Statistics in California, United States
Is Airbnb profitable in Riverside in 2026? Explore comprehensive Airbnb analytics for Riverside, California, United States to uncover income potential. This 2026 STR market report for Riverside, based on AirROI data from February 2025 to January 2026, reveals key trends in the market of 433 active listings.
Whether you're considering an Airbnb investment in Riverside, optimizing your existing vacation rental, or exploring rental arbitrage opportunities, understanding the Riverside Airbnb data is crucial. Leveraging the low regulation environment is key to maximizing your short term rental income potential. Let's dive into the specifics.
Key Riverside Airbnb Performance Metrics Overview
Monthly Airbnb Revenue Variations & Income Potential in Riverside (2026)
Understanding the monthly revenue variations for Airbnb listings in Riverside is key to maximizing your short term rental income potential. Seasonality significantly impacts earnings. Our analysis, based on data from the past 12 months, shows that the peak revenue month for STRs in Riverside is typically July, while January often presents the lowest earnings, highlighting opportunities for strategic pricing adjustments during shoulder and low seasons. Explore the typical Airbnb income in Riverside across different performance tiers:
- Best-in-class properties (Top 10%) achieve $6,845+ monthly, often utilizing dynamic pricing and superior guest experiences.
- Strong performing properties (Top 25%) earn $4,036 or more, indicating effective management and desirable locations/amenities.
- Typical properties (Median) generate around $2,048 per month, representing the average market performance.
- Entry-level properties (Bottom 25%) see earnings around $816, often with potential for optimization.
Average Monthly Airbnb Earnings Trend in Riverside
Riverside Airbnb Occupancy Rate Trends (2026)
Maximize your bookings by understanding the Riverside STR occupancy trends. Seasonal demand shifts significantly influence how often properties are booked. Typically, Junesees the highest demand (peak season occupancy), while January experiences the lowest (low season). Effective strategies, like adjusting minimum stays or offering promotions, can boost occupancy during slower periods. Here's how different property tiers perform in Riverside:
- Best-in-class properties (Top 10%) achieve 83%+ occupancy, indicating high desirability and potentially optimized availability.
- Strong performing properties (Top 25%) maintain 66% or higher occupancy, suggesting good market fit and guest satisfaction.
- Typical properties (Median) have an occupancy rate around 41%.
- Entry-level properties (Bottom 25%) average 20% occupancy, potentially facing higher vacancy.
Average Monthly Occupancy Rate Trend in Riverside
Average Daily Rate (ADR) Airbnb Trends in Riverside (2026)
Effective short term rental pricing strategy in Riverside involves understanding monthly ADR fluctuations. The Average Daily Rate (ADR) for Airbnb in Riverside typically peaks in June and dips lowest during February. Leveraging Airbnb dynamic pricing tools or strategies based on this seasonality can significantly boost revenue. Here's a look at the typical nightly rates achieved:
- Best-in-class properties (Top 10%) command rates of $423+ per night, often due to premium features or locations.
- Strong performing properties (Top 25%) achieve nightly rates of $285 or more.
- Typical properties (Median) charge around $139 per night.
- Entry-level properties (Bottom 25%) earn around $68 per night.
Average Daily Rate (ADR) Trend by Month in Riverside
Get Live Riverside Market Intelligence 👇

Explore Real-time Analytics
Airbnb Seasonality Analysis & Trends in Riverside (2026)
Peak Season (July, June, April)
- Revenue averages $3,491 per month
- Occupancy rates average 48.1%
- Daily rates average $206
Shoulder Season
- Revenue averages $2,935 per month
- Occupancy maintains around 43.3%
- Daily rates hold near $197
Low Season (January, February, November)
- Revenue drops to average $2,370 per month
- Occupancy decreases to average 40.1%
- Daily rates adjust to average $186
Seasonality Insights for Riverside
- The Airbnb seasonality in Riverside shows moderate seasonality with distinct peak and low periods. While the sections above show seasonal averages, it's also insightful to look at the extremes:
- During the high season, the absolute peak month showcases Riverside's highest earning potential, with monthly revenues capable of climbing to $3,664, occupancy reaching a high of 49.1%, and ADRs peaking at $212.
- Conversely, the slowest single month of the year, typically falling within the low season, marks the market's lowest point. In this month, revenue might dip to $2,104, occupancy could drop to 34.8%, and ADRs may adjust down to $179.
- Understanding both the seasonal averages and these monthly peaks and troughs in revenue, occupancy, and ADR is crucial for maximizing your Airbnb profit potential in Riverside.
Seasonal Strategies for Maximizing Profit
- Peak Season: Maximize revenue through premium pricing and potentially longer minimum stays. Ensure high availability.
- Low Season: Offer competitive pricing, special promotions (e.g., extended stay discounts), and flexible cancellation policies. Target off-season travelers like remote workers or budget-conscious guests.
- Shoulder Seasons: Implement dynamic pricing that balances peak and low rates. Target weekend travelers or specific events. Offer slightly more flexible terms than peak season.
- Regularly analyze your own performance against these Riverside seasonality benchmarks and adjust your pricing and availability strategy accordingly.
Best Areas for Airbnb Investment in Riverside (2026)
Exploring the top neighborhoods for short-term rentals in Riverside? This section highlights key areas, outlining why they are attractive for hosts and guests, along with notable local attractions. Consider these locations based on your target guest profile and investment strategy.
| Neighborhood / Area | Why Host Here? (Target Guests & Appeal) | Key Attractions & Landmarks |
|---|---|---|
| Downtown Riverside | The heart of the city with a mix of historic sites and modern activities, popular with both tourists and locals. It features a vibrant dining scene and is close to key attractions. | Riverside Art Museum, Fox Theater, Riverside Convention Center, The Mission Inn, Riverside Plaza |
| Whitewater | A popular area for outdoor enthusiasts, offering easy access to hiking and nature. It's also known for its camping sites and proximity to natural attractions, making it ideal for families and adventurers. | San Gorgonio Wilderness, Mount San Jacinto State Park, Whitewater Preserve, Coachella Valley Preserve |
| Riverside Plaza | A shopping and dining hub that attracts visitors looking for entertainment and leisure activities, making it an attractive place for potential short-term rentals. | Riverside Plaza, movie theaters, restaurants, shopping |
| Mission Grove | A suburban area offering a quiet atmosphere with access to parks and family-friendly amenities, ideal for longer-term stays and families visiting the area. | Mission Grove Park, Dayton Street Park, local shopping centers |
| Canyon Crest | Known for its beautiful views and pleasant climate, this area provides great opportunities for hosting guests who prefer a quiet and scenic environment, particularly for those visiting university events. | Canyon Crest Town Centre, UC Riverside, Mount Rubidioux |
| Arlington | A community with historical significance and diverse restaurants, popular among visitors looking for a local experience. Close to several parks and community events. | Arlington Heights Sports Park, Historical Society of Riverside, local eateries |
| La Sierra | An affordable residential area with access to public transportation and amenities, attracting visitors needing convenient lodging options during longer stays. | La Sierra University, Riverside Metro, local markets |
| Woodcrest | A more rural feeling area that provides a tranquil setting away from city life, appealing for those looking for a peaceful retreat or visiting extended family. | Lake Mathews, Woodcrest Park, local trails |
Understanding Airbnb License Requirements & STR Laws in Riverside (2026)
While Riverside, California, United States currently shows low STR regulations, specific Airbnb license requirements might still exist or change. Always verify the latest short term rental regulations and Airbnb license requirements directly with local government authorities for Riverside to ensure full compliance before hosting.
(Source: AirROI data, 2026, finding no licensed listings among those analyzed)
Top Performing Airbnb Properties in Riverside (2026)
Benchmark your potential! Explore examples of top-performing Airbnb properties in Riversidebased on Trailing Twelve Month (TTM) revenue. Analyze their characteristics, revenue, occupancy rate, and ADR to understand what drives success in this market.
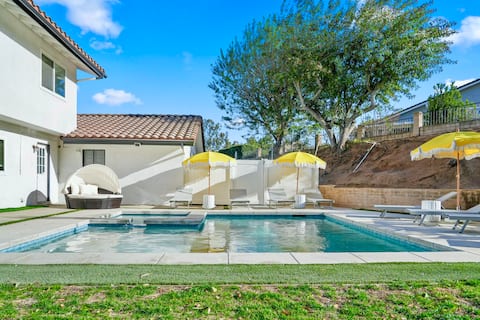
5BR Fun Haven: Pool, Mini Golf, Movie, Gameroom
Entire Place • 5 bedrooms

BOHEMIAN AND MODERN SERENE HOME WITH POOL
Entire Place • 4 bedrooms
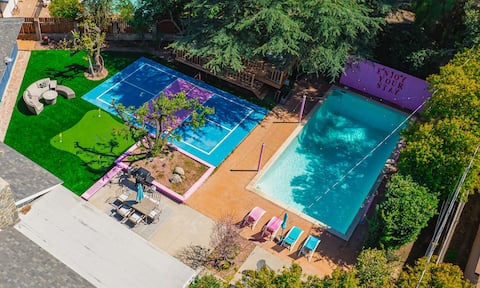
5BR|Pickleball Court |Pool|Tree Deck|Golf
Entire Place • 5 bedrooms

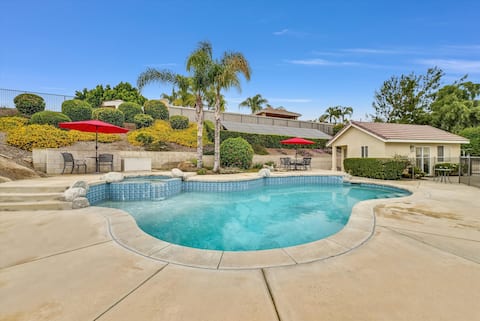
Mid Century Modern POOL HOME w/ GAME ROOM
Entire Place • 3 bedrooms
Stunning 8 bedroom, 5.5 bathroom pool house.
Entire Place • 8 bedrooms

Cozy Pool Home Spacious & Fun!
Entire Place • 3 bedrooms
Note: Performance varies based on location, size, amenities, seasonality, and management quality. Data reflects the past 12 months.
Top Performing Airbnb Hosts in Riverside (2026)
Learn from the best! This table showcases top-performing Airbnb hosts in Riverside based on the number of properties managed and estimated total revenue over the past year. Analyze their scale and performance metrics.
| Host Name | Properties | Grossing Revenue | Stay Reviews | Avg Rating |
|---|---|---|---|---|
| Cc | 9 | $335,474 | 87 | 4.73/5.0 |
| Evolve | 6 | $333,146 | 151 | 4.74/5.0 |
| Top Tier | 3 | $310,682 | 974 | 4.65/5.0 |
| Kaled | 3 | $260,454 | 363 | 4.86/5.0 |
| Karddy | 8 | $245,321 | 372 | 4.82/5.0 |
| Concord | 2 | $198,378 | 118 | 4.92/5.0 |
| Five Stars | 2 | $185,799 | 502 | 4.71/5.0 |
| Seraph | 2 | $172,608 | 99 | 4.95/5.0 |
| Hugo | 6 | $161,538 | 876 | 4.86/5.0 |
| Tiffany | 1 | $160,666 | 59 | 4.92/5.0 |
Analyzing the strategies of top hosts, such as their property selection, pricing, and guest communication, can offer valuable lessons for optimizing your own Airbnb operations in Riverside.
Dive Deeper: Advanced Riverside STR Market Data (2026)
Ready to unlock more insights? AirROI provides access to advanced metrics and comprehensive Airbnb data for Riverside. Explore detailed analytics beyond this report to refine your investment strategy, optimize pricing, and maximize your vacation rental profits.
Explore Advanced MetricsRiverside Short-Term Rental Market Composition (2026): Property & Room Types
Room Type Distribution
Property Type Distribution
Market Composition Insights for Riverside
- The Riverside Airbnb market composition is heavily skewed towards Entire Home/Apt listings, which make up 67.2% of the 433 active rentals. This indicates strong guest preference for privacy and space.
- However, a notable 32.3% share for Private Rooms suggests opportunities for budget-conscious travelers or hosts renting out spare rooms.
- Looking at the property type distribution in Riverside, House properties are the most common (75.1%), reflecting the local real estate landscape.
- Houses represent a significant 75.1% portion, catering likely to families or larger groups.
- The presence of 10.6% Hotel/Boutique listings indicates integration with traditional hospitality.
- Smaller segments like outdoor/unique (combined 0.7%) offer potential for unique stay experiences.
Riverside Airbnb Room Capacity Analysis (2026): Bedroom Distribution
Distribution of Listings by Number of Bedrooms
Room Capacity Insights for Riverside
- The dominant room capacity in Riverside is 1 bedroom listings, making up 23.6% of the market. This suggests a strong demand for properties suitable for couples or solo travelers.
- Together, 1 bedroom and 3 bedrooms properties represent 38.8% of the active Airbnb listings in Riverside, indicating a high concentration in these sizes.
- A significant 35.1% of listings offer 3+ bedrooms, catering to larger groups and families seeking more space in Riverside.
Riverside Vacation Rental Guest Capacity Trends (2026)
Distribution of Listings by Guest Capacity
Guest Capacity Insights for Riverside
- The most common guest capacity trend in Riverside vacation rentals is listings accommodating 8+ guests (25.6%). This suggests the primary traveler segment is likely larger groups.
- Properties designed for 8+ guests and 2 guests dominate the Riverside STR market, accounting for 40.6% of listings.
- 36.9% of properties accommodate 6+ guests, serving the market segment for larger families or group travel in Riverside.
- On average, properties in Riverside are equipped to host 3.8 guests.
Riverside Airbnb Booking Patterns (2026): Available vs. Booked Days
Available Days Distribution
Booked Days Distribution
Booking Pattern Insights for Riverside
- The most common availability pattern in Riverside falls within the 271-366 days range, representing 49.2% of listings. This suggests many properties have significant open periods on their calendars.
- Approximately 78.5% of listings show high availability (181+ days open annually), indicating potential for increased bookings or specific owner usage patterns.
- For booked days, the 31-90 days range is most frequent in Riverside (30.3%), reflecting common guest stay durations or potential owner blocking patterns.
- A notable 22.9% of properties secure long booking periods (181+ days booked per year), highlighting successful long-term rental strategies or significant owner usage.
Riverside Airbnb Minimum Stay Requirements Analysis
Distribution of Listings by Minimum Night Requirement
1 Night
109 listings
25.2% of total
2 Nights
99 listings
22.9% of total
3 Nights
32 listings
7.4% of total
4-6 Nights
11 listings
2.5% of total
7-29 Nights
65 listings
15% of total
30+ Nights
117 listings
27% of total
Key Insights
- The most prevalent minimum stay requirement in Riverside is 30+ Nights, adopted by 27% of listings. This highlights the market's preference for longer commitments.
- A significant segment (27%) caters to monthly stays (30+ nights) in Riverside, pointing to opportunities in the extended-stay market.
Recommendations
- Align with the market by considering a 30+ Nights minimum stay, as 27% of Riverside hosts use this setting.
- If feasible, allowing 1-night stays, especially midweek or during low season, could capture last-minute bookings, as only 25.2% currently do.
- Explore offering discounts for stays of 30+ nights to attract the 27% of the market seeking extended stays.
- Adjust minimum nights based on seasonality – potentially shorter during low season and longer during peak demand periods in Riverside.
Riverside Airbnb Cancellation Policy Trends Analysis (2026)
Limited
12 listings
2.8% of total
Super Strict 30 Days
1 listings
0.2% of total
Flexible
114 listings
26.4% of total
Moderate
118 listings
27.3% of total
Firm
132 listings
30.6% of total
Strict
55 listings
12.7% of total
Cancellation Policy Insights for Riverside
- The prevailing Airbnb cancellation policy trend in Riverside is Firm, used by 30.6% of listings.
- There's a relatively balanced mix between guest-friendly (53.7%) and stricter (43.3%) policies, offering choices for different guest needs.
Recommendations for Hosts
- Consider adopting a Firm policy to align with the 30.6% market standard in Riverside.
- Using a Strict policy might deter some guests, as only 12.7% of listings use it. Evaluate if potential revenue protection outweighs possible lower booking rates.
- Regularly review your cancellation policy against competitors and market demand shifts in Riverside.
Riverside STR Booking Lead Time Analysis (2026)
Average Booking Lead Time by Month
Booking Lead Time Insights for Riverside
- The overall average booking lead time for vacation rentals in Riverside is 27 days.
- Guests book furthest in advance for stays during October (average 48 days), likely coinciding with peak travel demand or local events.
- The shortest booking windows occur for stays in February (average 17 days), indicating more last-minute travel plans during this time.
- Seasonally, Fall (33 days avg.) sees the longest lead times, while Winter (22 days avg.) has the shortest, reflecting typical travel planning cycles.
Recommendations for Hosts
- Use the overall average lead time (27 days) as a baseline for your pricing and availability strategy in Riverside.
- For October stays, consider implementing length-of-stay discounts or slightly higher rates for bookings made less than 48 days out to capitalize on advance planning.
- Target marketing efforts for the Fall season well in advance (at least 33 days) to capture early planners.
- Monitor your own booking lead times against these Riverside averages to identify opportunities for dynamic pricing adjustments.
Popular & Essential Airbnb Amenities in Riverside (2026)
Amenity Prevalence
Amenity Insights for Riverside
- Essential amenities in Riverside that guests expect include: Wifi, Air conditioning, Smoke alarm. Lacking these (any) could significantly impact bookings.
- Popular amenities like Carbon monoxide alarm, Heating, Hot water are common but not universal. Offering these can provide a competitive edge.
Recommendations for Hosts
- Ensure your listing includes all essential amenities for Riverside: Wifi, Air conditioning, Smoke alarm.
- Prioritize adding missing essentials: Wifi, Air conditioning, Smoke alarm.
- Consider adding popular differentiators like Carbon monoxide alarm or Heating to increase appeal.
- Highlight unique or less common amenities you offer (e.g., hot tub, dedicated workspace, EV charger) in your listing description and photos.
- Regularly check competitor amenities in Riverside to stay competitive.
Riverside Airbnb Guest Demographics & Profile Analysis (2026)
Guest Profile Summary for Riverside
- The typical guest profile for Airbnb in Riverside consists of primarily domestic travelers (94%), often arriving from nearby Los Angeles, typically belonging to the Post-2000s (Gen Z/Alpha) group (50%), primarily speaking English or Spanish.
- Domestic travelers account for 94.3% of guests.
- Key international markets include United States (94.3%) and Canada (1%).
- Top languages spoken are English (65%) followed by Spanish (23.1%).
- A significant demographic segment is the Post-2000s (Gen Z/Alpha) group, representing 50% of guests.
Recommendations for Hosts
- Target domestic marketing efforts towards travelers from Los Angeles and Riverside.
- Tailor amenities and listing descriptions to appeal to the dominant Post-2000s (Gen Z/Alpha) demographic (e.g., highlight fast WiFi, smart home features, local guides).
- Highlight unique local experiences or amenities relevant to the primary guest profile.
- Consider seasonal promotions aligned with peak travel times for key origin markets.
Nearby Short-Term Rental Market Comparison
How does the Riverside Airbnb market stack up against its neighbors? Compare key performance metrics like average monthly revenue, ADR, and occupancy rates in surrounding areas to understand the broader regional STR landscape.
| Market | Active Properties | Monthly Revenue | Daily Rate | Avg. Occupancy |
|---|---|---|---|---|
| Newport Beach | 1,273 | $8,950 | $744.06 | 47% |
| Rancho San Diego | 25 | $8,649 | $568.72 | 48% |
| Malibu | 251 | $8,293 | $1263.89 | 35% |
| Thousand Palms | 33 | $8,119 | $725.48 | 36% |
| Manhattan Beach | 267 | $7,875 | $585.30 | 53% |
| Lakeside | 33 | $7,537 | $604.33 | 44% |
| GlenOak Hills | 41 | $7,394 | $648.65 | 41% |
| Bermuda Dunes | 143 | $7,324 | $664.90 | 39% |
| Mount Helix | 33 | $7,163 | $594.94 | 50% |
| Del Mar | 128 | $7,011 | $671.56 | 45% |