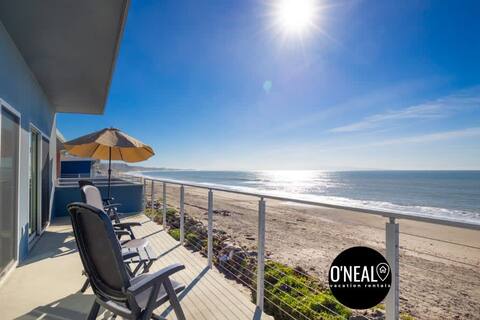
Rio del Mar Airbnb Market Analysis 2026: Short Term Rental Data & Vacation Rental Statistics in California, United States
Is Airbnb profitable in Rio del Mar in 2026? Explore comprehensive Airbnb analytics for Rio del Mar, California, United States to uncover income potential. This 2026 STR market report for Rio del Mar, based on AirROI data from February 2025 to January 2026, reveals key trends in the niche market of 193 active listings.
Whether you're considering an Airbnb investment in Rio del Mar, optimizing your existing vacation rental, or exploring rental arbitrage opportunities, understanding the Rio del Mar Airbnb data is crucial. Leveraging the low regulation environment is key to maximizing your short term rental income potential. Let's dive into the specifics.
Key Rio del Mar Airbnb Performance Metrics Overview
Monthly Airbnb Revenue Variations & Income Potential in Rio del Mar (2026)
Understanding the monthly revenue variations for Airbnb listings in Rio del Mar is key to maximizing your short term rental income potential. Seasonality significantly impacts earnings. Our analysis, based on data from the past 12 months, shows that the peak revenue month for STRs in Rio del Mar is typically July, while January often presents the lowest earnings, highlighting opportunities for strategic pricing adjustments during shoulder and low seasons. Explore the typical Airbnb income in Rio del Mar across different performance tiers:
- Best-in-class properties (Top 10%) achieve $11,499+ monthly, often utilizing dynamic pricing and superior guest experiences.
- Strong performing properties (Top 25%) earn $7,804 or more, indicating effective management and desirable locations/amenities.
- Typical properties (Median) generate around $4,788 per month, representing the average market performance.
- Entry-level properties (Bottom 25%) see earnings around $2,697, often with potential for optimization.
Average Monthly Airbnb Earnings Trend in Rio del Mar
Rio del Mar Airbnb Occupancy Rate Trends (2026)
Maximize your bookings by understanding the Rio del Mar STR occupancy trends. Seasonal demand shifts significantly influence how often properties are booked. Typically, Julysees the highest demand (peak season occupancy), while January experiences the lowest (low season). Effective strategies, like adjusting minimum stays or offering promotions, can boost occupancy during slower periods. Here's how different property tiers perform in Rio del Mar:
- Best-in-class properties (Top 10%) achieve 76%+ occupancy, indicating high desirability and potentially optimized availability.
- Strong performing properties (Top 25%) maintain 59% or higher occupancy, suggesting good market fit and guest satisfaction.
- Typical properties (Median) have an occupancy rate around 40%.
- Entry-level properties (Bottom 25%) average 22% occupancy, potentially facing higher vacancy.
Average Monthly Occupancy Rate Trend in Rio del Mar
Average Daily Rate (ADR) Airbnb Trends in Rio del Mar (2026)
Effective short term rental pricing strategy in Rio del Mar involves understanding monthly ADR fluctuations. The Average Daily Rate (ADR) for Airbnb in Rio del Mar typically peaks in June and dips lowest during February. Leveraging Airbnb dynamic pricing tools or strategies based on this seasonality can significantly boost revenue. Here's a look at the typical nightly rates achieved:
- Best-in-class properties (Top 10%) command rates of $769+ per night, often due to premium features or locations.
- Strong performing properties (Top 25%) achieve nightly rates of $565 or more.
- Typical properties (Median) charge around $426 per night.
- Entry-level properties (Bottom 25%) earn around $307 per night.
Average Daily Rate (ADR) Trend by Month in Rio del Mar
Get Live Rio del Mar Market Intelligence 👇

Explore Real-time Analytics
Airbnb Seasonality Analysis & Trends in Rio del Mar (2026)
Peak Season (July, August, June)
- Revenue averages $8,868 per month
- Occupancy rates average 57.9%
- Daily rates average $493
Shoulder Season
- Revenue averages $5,519 per month
- Occupancy maintains around 40.3%
- Daily rates hold near $465
Low Season (January, February, December)
- Revenue drops to average $3,667 per month
- Occupancy decreases to average 29.3%
- Daily rates adjust to average $439
Seasonality Insights for Rio del Mar
- The Airbnb seasonality in Rio del Mar shows highly seasonal trends requiring careful strategy. While the sections above show seasonal averages, it's also insightful to look at the extremes:
- During the high season, the absolute peak month showcases Rio del Mar's highest earning potential, with monthly revenues capable of climbing to $10,393, occupancy reaching a high of 66.5%, and ADRs peaking at $504.
- Conversely, the slowest single month of the year, typically falling within the low season, marks the market's lowest point. In this month, revenue might dip to $2,937, occupancy could drop to 23.7%, and ADRs may adjust down to $424.
- Understanding both the seasonal averages and these monthly peaks and troughs in revenue, occupancy, and ADR is crucial for maximizing your Airbnb profit potential in Rio del Mar.
Seasonal Strategies for Maximizing Profit
- Peak Season: Maximize revenue through premium pricing and potentially longer minimum stays. Ensure high availability.
- Low Season: Offer competitive pricing, special promotions (e.g., extended stay discounts), and flexible cancellation policies. Target off-season travelers like remote workers or budget-conscious guests.
- Shoulder Seasons: Implement dynamic pricing that balances peak and low rates. Target weekend travelers or specific events. Offer slightly more flexible terms than peak season.
- Regularly analyze your own performance against these Rio del Mar seasonality benchmarks and adjust your pricing and availability strategy accordingly.
Best Areas for Airbnb Investment in Rio del Mar (2026)
Exploring the top neighborhoods for short-term rentals in Rio del Mar? This section highlights key areas, outlining why they are attractive for hosts and guests, along with notable local attractions. Consider these locations based on your target guest profile and investment strategy.
| Neighborhood / Area | Why Host Here? (Target Guests & Appeal) | Key Attractions & Landmarks |
|---|---|---|
| Rio del Mar Beach | A beautiful beach area known for its sandy shores and family-friendly atmosphere. It's ideal for tourists looking for a relaxing beach getaway with plenty of outdoor activities. | Rio del Mar State Beach, Seascape Resort, Cement Ship, The Forest of Nisene Marks State Park, Davenport Ghost Town |
| Branciforte Creek | A serene area with access to nature and water activities, perfect for those wanting to enjoy kayaking, hiking, and the coastal view while being close to local amenities. | Branciforte Creek, Soquel Creek, Nearby State Parks, Santa Cruz Harbor, Fishing and Kayaking opportunities |
| Aptos Village | A quaint village atmosphere with local shops and eateries, making it an attractive destination for visitors who appreciate a small-town feel with close-knit community vibes. | Aptos Village Park, Local Art Galleries, Aptos History Museum, Nature Trails, Restaurants and Cafés |
| Seascape | A beachfront community featuring resort-style living with easy access to the beach. It's suitable for families and couples seeking a romantic getaway with outdoor activities. | Seascape Beach Resort, Golf Courses, Santa Cruz Beach Boardwalk, Myrtle Beach, Dining by the Ocean |
| Cabbage Beach | An idyllic stretch known for its natural beauty, this location is perfect for nature enthusiasts who enjoy less crowded beaches and scenic views. | Cabbage Beach, Local Wildlife Viewing, Scenic Coastal Trails, Wildflower Planting areas, Picnic spots |
| Sovereign | A hidden gem offering a combination of nature and tranquility. It's great for those seeking a peaceful retreat close to the coastline away from touristy areas. | Sovereign Beach Access, Nature Walks, Quiet Neighborhood, Sunset Views, Art and Craft shops |
| Forest of Nisene Marks | Known for its towering redwoods and extensive hiking and biking trails, perfect for eco-friendly travelers and outdoor adventurers. | Nisene Marks State Park, Redwood Trees, Hiking Trails, Mountain Biking, Nature Studies |
| Davenport | Small coastal town with stunning cliffs and ocean views, ideal for those looking for a rustic charm and a more laid-back atmosphere. | Davenport Beach, Davenport Landing, Cliffside Views, Local Dining, Historical Sites |
Understanding Airbnb License Requirements & STR Laws in Rio del Mar (2026)
While Rio del Mar, California, United States currently shows low STR regulations, specific Airbnb license requirements might still exist or change. Always verify the latest short term rental regulations and Airbnb license requirements directly with local government authorities for Rio del Mar to ensure full compliance before hosting.
(Source: AirROI data, 2026, finding no licensed listings among those analyzed)
Top Performing Airbnb Properties in Rio del Mar (2026)
Benchmark your potential! Explore examples of top-performing Airbnb properties in Rio del Marbased on Trailing Twelve Month (TTM) revenue. Analyze their characteristics, revenue, occupancy rate, and ADR to understand what drives success in this market.
Beachfront Rio Del Mar Home - 5 bedrooms!
Entire Place • 5 bedrooms

🍀Escape - Brand New Modern Chic Coastal Retreat🍀
Entire Place • 4 bedrooms

Breathtaking Beach Front House - Steps to the Sand
Entire Place • 4 bedrooms

Oceanfront Family Condo
Entire Place • 2 bedrooms

Beautiful Ocean View 2 BR-Seascape-Miles of Beach
Entire Place • 2 bedrooms

Amazing Beach House w/ Jacuzzi and Fire Pit
Entire Place • 3 bedrooms
Note: Performance varies based on location, size, amenities, seasonality, and management quality. Data reflects the past 12 months.
Top Performing Airbnb Hosts in Rio del Mar (2026)
Learn from the best! This table showcases top-performing Airbnb hosts in Rio del Mar based on the number of properties managed and estimated total revenue over the past year. Analyze their scale and performance metrics.
| Host Name | Properties | Grossing Revenue | Stay Reviews | Avg Rating |
|---|---|---|---|---|
| Cheshire Rio | 30 | $1,283,551 | 817 | 4.71/5.0 |
| Power West Properties Inc. | 20 | $1,084,600 | 1509 | 4.85/5.0 |
| Bailey Property Management | 18 | $728,581 | 327 | 4.58/5.0 |
| Jaleh | 5 | $669,146 | 349 | 4.87/5.0 |
| Ovr | 3 | $610,674 | 544 | 4.83/5.0 |
| Crystal | 3 | $505,216 | 1167 | 4.94/5.0 |
| Surf City | 4 | $277,365 | 316 | 4.78/5.0 |
| David | 2 | $237,534 | 197 | 4.98/5.0 |
| Janiece | 3 | $202,837 | 424 | 4.87/5.0 |
| Seascape Beach Resort | 11 | $198,431 | 872 | 4.75/5.0 |
Analyzing the strategies of top hosts, such as their property selection, pricing, and guest communication, can offer valuable lessons for optimizing your own Airbnb operations in Rio del Mar.
Dive Deeper: Advanced Rio del Mar STR Market Data (2026)
Ready to unlock more insights? AirROI provides access to advanced metrics and comprehensive Airbnb data for Rio del Mar. Explore detailed analytics beyond this report to refine your investment strategy, optimize pricing, and maximize your vacation rental profits.
Explore Advanced MetricsRio del Mar Short-Term Rental Market Composition (2026): Property & Room Types
Room Type Distribution
Property Type Distribution
Market Composition Insights for Rio del Mar
- The Rio del Mar Airbnb market composition is heavily skewed towards Entire Home/Apt listings, which make up 90.2% of the 193 active rentals. This indicates strong guest preference for privacy and space.
- Looking at the property type distribution in Rio del Mar, House properties are the most common (53.9%), reflecting the local real estate landscape.
- Houses represent a significant 53.9% portion, catering likely to families or larger groups.
- The presence of 7.8% Hotel/Boutique listings indicates integration with traditional hospitality.
- Smaller segments like others (combined 3.1%) offer potential for unique stay experiences.
Rio del Mar Airbnb Room Capacity Analysis (2026): Bedroom Distribution
Distribution of Listings by Number of Bedrooms
Room Capacity Insights for Rio del Mar
- The dominant room capacity in Rio del Mar is 2 bedrooms listings, making up 44% of the market. This suggests a strong demand for properties suitable for couples or solo travelers.
- Together, 2 bedrooms and 3 bedrooms properties represent 62.7% of the active Airbnb listings in Rio del Mar, indicating a high concentration in these sizes.
- A significant 31.7% of listings offer 3+ bedrooms, catering to larger groups and families seeking more space in Rio del Mar.
Rio del Mar Vacation Rental Guest Capacity Trends (2026)
Distribution of Listings by Guest Capacity
Guest Capacity Insights for Rio del Mar
- The most common guest capacity trend in Rio del Mar vacation rentals is listings accommodating 6 guests (36.3%). This suggests the primary traveler segment is likely larger groups.
- Properties designed for 6 guests and 8+ guests dominate the Rio del Mar STR market, accounting for 59.6% of listings.
- 61.2% of properties accommodate 6+ guests, serving the market segment for larger families or group travel in Rio del Mar.
- On average, properties in Rio del Mar are equipped to host 5.4 guests.
Rio del Mar Airbnb Booking Patterns (2026): Available vs. Booked Days
Available Days Distribution
Booked Days Distribution
Booking Pattern Insights for Rio del Mar
- The most common availability pattern in Rio del Mar falls within the 271-366 days range, representing 41.5% of listings. This suggests many properties have significant open periods on their calendars.
- Approximately 78.3% of listings show high availability (181+ days open annually), indicating potential for increased bookings or specific owner usage patterns.
- For booked days, the 91-180 days range is most frequent in Rio del Mar (36.8%), reflecting common guest stay durations or potential owner blocking patterns.
- A notable 23.3% of properties secure long booking periods (181+ days booked per year), highlighting successful long-term rental strategies or significant owner usage.
Rio del Mar Airbnb Minimum Stay Requirements Analysis
Distribution of Listings by Minimum Night Requirement
1 Night
24 listings
12.4% of total
2 Nights
45 listings
23.3% of total
3 Nights
14 listings
7.3% of total
4-6 Nights
14 listings
7.3% of total
7-29 Nights
9 listings
4.7% of total
30+ Nights
87 listings
45.1% of total
Key Insights
- The most prevalent minimum stay requirement in Rio del Mar is 30+ Nights, adopted by 45.1% of listings. This highlights the market's preference for longer commitments.
- A significant segment (45.1%) caters to monthly stays (30+ nights) in Rio del Mar, pointing to opportunities in the extended-stay market.
Recommendations
- Align with the market by considering a 30+ Nights minimum stay, as 45.1% of Rio del Mar hosts use this setting.
- If feasible, allowing 1-night stays, especially midweek or during low season, could capture last-minute bookings, as only 12.4% currently do.
- Explore offering discounts for stays of 30+ nights to attract the 45.1% of the market seeking extended stays.
- Adjust minimum nights based on seasonality – potentially shorter during low season and longer during peak demand periods in Rio del Mar.
Rio del Mar Airbnb Cancellation Policy Trends Analysis (2026)
Super Strict 30 Days
6 listings
3.1% of total
Non-refundable
1 listings
0.5% of total
Super Strict 60 Days
8 listings
4.2% of total
Refundable
1 listings
0.5% of total
Limited
2 listings
1% of total
Flexible
16 listings
8.3% of total
Moderate
22 listings
11.5% of total
Firm
111 listings
57.8% of total
Strict
25 listings
13% of total
Cancellation Policy Insights for Rio del Mar
- The prevailing Airbnb cancellation policy trend in Rio del Mar is Firm, used by 57.8% of listings.
- A majority (70.8%) of hosts in Rio del Mar utilize Firm or Strict policies, indicating a market where hosts prioritize booking security.
Recommendations for Hosts
- Consider adopting a Firm policy to align with the 57.8% market standard in Rio del Mar.
- Using a Strict policy might deter some guests, as only 13% of listings use it. Evaluate if potential revenue protection outweighs possible lower booking rates.
- Regularly review your cancellation policy against competitors and market demand shifts in Rio del Mar.
Rio del Mar STR Booking Lead Time Analysis (2026)
Average Booking Lead Time by Month
Booking Lead Time Insights for Rio del Mar
- The overall average booking lead time for vacation rentals in Rio del Mar is 57 days.
- Guests book furthest in advance for stays during July (average 84 days), likely coinciding with peak travel demand or local events.
- The shortest booking windows occur for stays in February (average 25 days), indicating more last-minute travel plans during this time.
- Seasonally, Summer (70 days avg.) sees the longest lead times, while Winter (34 days avg.) has the shortest, reflecting typical travel planning cycles.
Recommendations for Hosts
- Use the overall average lead time (57 days) as a baseline for your pricing and availability strategy in Rio del Mar.
- For July stays, consider implementing length-of-stay discounts or slightly higher rates for bookings made less than 84 days out to capitalize on advance planning.
- Target marketing efforts for the Summer season well in advance (at least 70 days) to capture early planners.
- Monitor your own booking lead times against these Rio del Mar averages to identify opportunities for dynamic pricing adjustments.
Popular & Essential Airbnb Amenities in Rio del Mar (2026)
Amenity Prevalence
Amenity Insights for Rio del Mar
- Essential amenities in Rio del Mar that guests expect include: Smoke alarm, Wifi, Heating, Coffee maker, Dishes and silverware, Carbon monoxide alarm, TV. Lacking these (any) could significantly impact bookings.
- Popular amenities like Microwave, Refrigerator, Patio or balcony are common but not universal. Offering these can provide a competitive edge.
Recommendations for Hosts
- Ensure your listing includes all essential amenities for Rio del Mar: Smoke alarm, Wifi, Heating, Coffee maker, Dishes and silverware, Carbon monoxide alarm, TV.
- Prioritize adding missing essentials: Heating, Coffee maker, Dishes and silverware, Carbon monoxide alarm, TV.
- Consider adding popular differentiators like Microwave or Refrigerator to increase appeal.
- Highlight unique or less common amenities you offer (e.g., hot tub, dedicated workspace, EV charger) in your listing description and photos.
- Regularly check competitor amenities in Rio del Mar to stay competitive.
Rio del Mar Airbnb Guest Demographics & Profile Analysis (2026)
Guest Profile Summary for Rio del Mar
- The typical guest profile for Airbnb in Rio del Mar consists of primarily domestic travelers (95%), often arriving from nearby San Francisco, typically belonging to the Post-2000s (Gen Z/Alpha) group (50%), primarily speaking English or Spanish.
- Domestic travelers account for 95.4% of guests.
- Key international markets include United States (95.4%) and United Kingdom (0.9%).
- Top languages spoken are English (63.6%) followed by Spanish (14.7%).
- A significant demographic segment is the Post-2000s (Gen Z/Alpha) group, representing 50% of guests.
Recommendations for Hosts
- Target domestic marketing efforts towards travelers from San Francisco and San Jose.
- Tailor amenities and listing descriptions to appeal to the dominant Post-2000s (Gen Z/Alpha) demographic (e.g., highlight fast WiFi, smart home features, local guides).
- Highlight unique local experiences or amenities relevant to the primary guest profile.
- Consider seasonal promotions aligned with peak travel times for key origin markets.
Nearby Short-Term Rental Market Comparison
How does the Rio del Mar Airbnb market stack up against its neighbors? Compare key performance metrics like average monthly revenue, ADR, and occupancy rates in surrounding areas to understand the broader regional STR landscape.
| Market | Active Properties | Monthly Revenue | Daily Rate | Avg. Occupancy |
|---|---|---|---|---|
| Carmel Point | 15 | $14,483 | $1046.17 | 54% |
| Del Monte Forest | 105 | $10,280 | $964.89 | 47% |
| Moss Beach | 34 | $10,092 | $676.91 | 53% |
| Carmel-by-the-Sea | 305 | $8,657 | $680.02 | 49% |
| Pleasure Point | 90 | $7,920 | $525.95 | 52% |
| Carmel | 29 | $7,901 | $597.00 | 49% |
| Castroville | 16 | $7,830 | $558.55 | 50% |
| Stinson Beach | 106 | $7,814 | $812.15 | 43% |
| Sand City | 10 | $7,391 | $497.43 | 60% |
| Del Rey Oaks | 33 | $7,281 | $474.67 | 54% |