Plymouth Airbnb Market Analysis 2026: Short Term Rental Data & Vacation Rental Statistics in California, United States
Is Airbnb profitable in Plymouth in 2026? Explore comprehensive Airbnb analytics for Plymouth, California, United States to uncover income potential. This 2026 STR market report for Plymouth, based on AirROI data from February 2025 to January 2026, reveals key trends in the niche market of 27 active listings.
Whether you're considering an Airbnb investment in Plymouth, optimizing your existing vacation rental, or exploring rental arbitrage opportunities, understanding the Plymouth Airbnb data is crucial. Leveraging the low regulation environment is key to maximizing your short term rental income potential. Let's dive into the specifics.
Key Plymouth Airbnb Performance Metrics Overview
Monthly Airbnb Revenue Variations & Income Potential in Plymouth (2026)
Understanding the monthly revenue variations for Airbnb listings in Plymouth is key to maximizing your short term rental income potential. Seasonality significantly impacts earnings. Our analysis, based on data from the past 12 months, shows that the peak revenue month for STRs in Plymouth is typically October, while February often presents the lowest earnings, highlighting opportunities for strategic pricing adjustments during shoulder and low seasons. Explore the typical Airbnb income in Plymouth across different performance tiers:
- Best-in-class properties (Top 10%) achieve $6,225+ monthly, often utilizing dynamic pricing and superior guest experiences.
- Strong performing properties (Top 25%) earn $4,049 or more, indicating effective management and desirable locations/amenities.
- Typical properties (Median) generate around $2,595 per month, representing the average market performance.
- Entry-level properties (Bottom 25%) see earnings around $1,486, often with potential for optimization.
Average Monthly Airbnb Earnings Trend in Plymouth
Plymouth Airbnb Occupancy Rate Trends (2026)
Maximize your bookings by understanding the Plymouth STR occupancy trends. Seasonal demand shifts significantly influence how often properties are booked. Typically, Maysees the highest demand (peak season occupancy), while January experiences the lowest (low season). Effective strategies, like adjusting minimum stays or offering promotions, can boost occupancy during slower periods. Here's how different property tiers perform in Plymouth:
- Best-in-class properties (Top 10%) achieve 63%+ occupancy, indicating high desirability and potentially optimized availability.
- Strong performing properties (Top 25%) maintain 48% or higher occupancy, suggesting good market fit and guest satisfaction.
- Typical properties (Median) have an occupancy rate around 31%.
- Entry-level properties (Bottom 25%) average 19% occupancy, potentially facing higher vacancy.
Average Monthly Occupancy Rate Trend in Plymouth
Average Daily Rate (ADR) Airbnb Trends in Plymouth (2026)
Effective short term rental pricing strategy in Plymouth involves understanding monthly ADR fluctuations. The Average Daily Rate (ADR) for Airbnb in Plymouth typically peaks in December and dips lowest during February. Leveraging Airbnb dynamic pricing tools or strategies based on this seasonality can significantly boost revenue. Here's a look at the typical nightly rates achieved:
- Best-in-class properties (Top 10%) command rates of $521+ per night, often due to premium features or locations.
- Strong performing properties (Top 25%) achieve nightly rates of $400 or more.
- Typical properties (Median) charge around $271 per night.
- Entry-level properties (Bottom 25%) earn around $182 per night.
Average Daily Rate (ADR) Trend by Month in Plymouth
Get Live Plymouth Market Intelligence 👇

Explore Real-time Analytics
Airbnb Seasonality Analysis & Trends in Plymouth (2026)
Peak Season (October, May, July)
- Revenue averages $4,255 per month
- Occupancy rates average 44.0%
- Daily rates average $310
Shoulder Season
- Revenue averages $3,221 per month
- Occupancy maintains around 32.8%
- Daily rates hold near $305
Low Season (January, February, March)
- Revenue drops to average $2,239 per month
- Occupancy decreases to average 28.4%
- Daily rates adjust to average $293
Seasonality Insights for Plymouth
- The Airbnb seasonality in Plymouth shows highly seasonal trends requiring careful strategy. While the sections above show seasonal averages, it's also insightful to look at the extremes:
- During the high season, the absolute peak month showcases Plymouth's highest earning potential, with monthly revenues capable of climbing to $4,528, occupancy reaching a high of 46.1%, and ADRs peaking at $337.
- Conversely, the slowest single month of the year, typically falling within the low season, marks the market's lowest point. In this month, revenue might dip to $1,863, occupancy could drop to 23.5%, and ADRs may adjust down to $266.
- Understanding both the seasonal averages and these monthly peaks and troughs in revenue, occupancy, and ADR is crucial for maximizing your Airbnb profit potential in Plymouth.
Seasonal Strategies for Maximizing Profit
- Peak Season: Maximize revenue through premium pricing and potentially longer minimum stays. Ensure high availability.
- Low Season: Offer competitive pricing, special promotions (e.g., extended stay discounts), and flexible cancellation policies. Target off-season travelers like remote workers or budget-conscious guests.
- Shoulder Seasons: Implement dynamic pricing that balances peak and low rates. Target weekend travelers or specific events. Offer slightly more flexible terms than peak season.
- Regularly analyze your own performance against these Plymouth seasonality benchmarks and adjust your pricing and availability strategy accordingly.
Best Areas for Airbnb Investment in Plymouth (2026)
Exploring the top neighborhoods for short-term rentals in Plymouth? This section highlights key areas, outlining why they are attractive for hosts and guests, along with notable local attractions. Consider these locations based on your target guest profile and investment strategy.
| Neighborhood / Area | Why Host Here? (Target Guests & Appeal) | Key Attractions & Landmarks |
|---|---|---|
| Lake Tahoe | A stunning freshwater lake known for its outdoor recreational opportunities, attracting tourists year-round for skiing in winter and hiking, boating, and beaches in summer. | Emerald Bay State Park, Northstar California Resort, Heavenly Mountain Resort, Sand Harbor, Tahoe Rim Trail, South Lake Tahoe |
| Amador County Wine Country | A beautiful region featuring numerous wineries, making it ideal for wine lovers and those seeking a relaxing getaway in a rustic setting. | Karly Wines, Broke Ass Winery, Renwood Winery, Amador Flower Farm, Sutter Creek, Jackson Rancheria Casino Resort |
| Plymouth Historic District | Rich in history and charm, this district offers quaint shops, restaurants, and access to local vineyards, attracting history enthusiasts and couples looking for romantic getaways. | Plymouth City Park, Wine country tours, Plymouth Pioneer Cemetery, Sierra Repertory Theatre |
| Fiddletown | Known for its gold rush history, this area attracts visitors interested in historical tours and the quieter, rural charm of California. | Fiddletown Historic Museum, Sierra Nevada foothills, Local wineries |
| Sutter Creek | A charming, historic town that serves as a gateway to wine country, appealing to tourists seeking a quaint experience with shopping, dining, and tasting rooms. | Sutter Creek Theatre, American Civil War Museum, Local art galleries, Wine tasting rooms |
| Shenandoah Valley | Renowned for its wineries and beautiful landscapes, perfect for couples and outdoor enthusiasts looking for wine experiences and nature activities. | Shenandoah National Park, Local wineries such as Terra d'Oro, Scenic hiking trails |
| Camanche Reservoir | A popular spot for fishing, boating, and other water activities, ideal for families and outdoor adventurers throughout the year. | Camanche North Shore, Camanche South Shore, Fishing and boating access |
| Jackson | Known for its historic gold rush town charm, shopping, and access to outdoor activities. A key stop for visitors exploring Amador County. | Historic Jackson, El Dorado County Fairgrounds, Shopping in the historic district, Gold rush history sites |
Understanding Airbnb License Requirements & STR Laws in Plymouth (2026)
While Plymouth, California, United States currently shows low STR regulations, specific Airbnb license requirements might still exist or change. Always verify the latest short term rental regulations and Airbnb license requirements directly with local government authorities for Plymouth to ensure full compliance before hosting.
(Source: AirROI data, 2026, finding no licensed listings among those analyzed)
Top Performing Airbnb Properties in Plymouth (2026)
Benchmark your potential! Explore examples of top-performing Airbnb properties in Plymouthbased on Trailing Twelve Month (TTM) revenue. Analyze their characteristics, revenue, occupancy rate, and ADR to understand what drives success in this market.

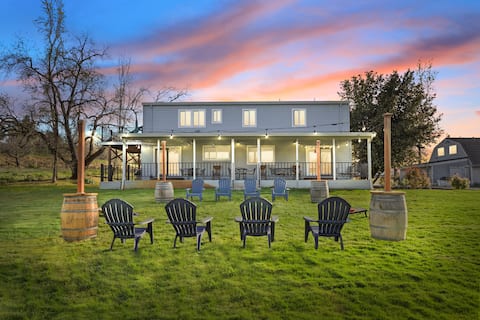
Luxurious Pet Friendly Wine Country Retreat
Entire Place • 4 bedrooms

Family Winery Estate- Pet-Friendly, Vineyard Views
Entire Place • 4 bedrooms
Lakeside Vineyard Retreat
Entire Place • 5 bedrooms
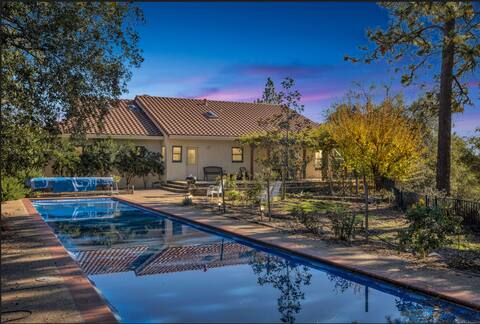
Your Private Vineyard with Pool & Fireplaces
Entire Place • 3 bedrooms

On-Site Winery: Rural Plymouth Getaway!
Entire Place • 3 bedrooms
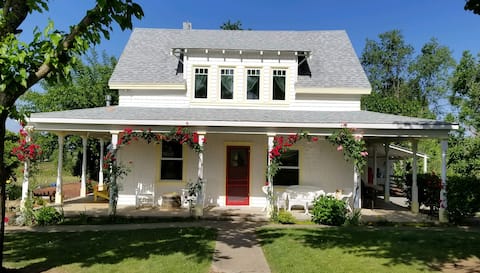
The Amador Farmhouse
Entire Place • 3 bedrooms
Note: Performance varies based on location, size, amenities, seasonality, and management quality. Data reflects the past 12 months.
Top Performing Airbnb Hosts in Plymouth (2026)
Learn from the best! This table showcases top-performing Airbnb hosts in Plymouth based on the number of properties managed and estimated total revenue over the past year. Analyze their scale and performance metrics.
| Host Name | Properties | Grossing Revenue | Stay Reviews | Avg Rating |
|---|---|---|---|---|
| Ari | 1 | $143,369 | 22 | 5.00/5.0 |
| Elizabeth | 3 | $104,711 | 96 | 4.90/5.0 |
| Elizabeth | 2 | $75,083 | 950 | 4.99/5.0 |
| Evolve | 2 | $70,848 | 30 | 4.86/5.0 |
| Amber | 1 | $66,504 | 39 | 4.95/5.0 |
| Thomas | 1 | $63,568 | 91 | 4.84/5.0 |
| Messina | 2 | $45,439 | 120 | 4.99/5.0 |
| Dan/Cheryl | 1 | $43,895 | 126 | 4.98/5.0 |
| Mike | 1 | $38,719 | 260 | 4.93/5.0 |
| Ashley | 1 | $36,308 | 82 | 4.89/5.0 |
Analyzing the strategies of top hosts, such as their property selection, pricing, and guest communication, can offer valuable lessons for optimizing your own Airbnb operations in Plymouth.
Dive Deeper: Advanced Plymouth STR Market Data (2026)
Ready to unlock more insights? AirROI provides access to advanced metrics and comprehensive Airbnb data for Plymouth. Explore detailed analytics beyond this report to refine your investment strategy, optimize pricing, and maximize your vacation rental profits.
Explore Advanced MetricsPlymouth Short-Term Rental Market Composition (2026): Property & Room Types
Room Type Distribution
Property Type Distribution
Market Composition Insights for Plymouth
- The Plymouth Airbnb market composition is heavily skewed towards Entire Home/Apt listings, which make up 92.6% of the 27 active rentals. This indicates strong guest preference for privacy and space.
- Looking at the property type distribution in Plymouth, House properties are the most common (70.4%), reflecting the local real estate landscape.
- Houses represent a significant 70.4% portion, catering likely to families or larger groups.
- Smaller segments like hotel/boutique (combined 3.7%) offer potential for unique stay experiences.
Plymouth Airbnb Room Capacity Analysis (2026): Bedroom Distribution
Distribution of Listings by Number of Bedrooms
Room Capacity Insights for Plymouth
- The dominant room capacity in Plymouth is 3 bedrooms listings, making up 33.3% of the market. This suggests a strong demand for properties suitable for families or small groups.
- Together, 3 bedrooms and 4 bedrooms properties represent 55.5% of the active Airbnb listings in Plymouth, indicating a high concentration in these sizes.
- A significant 59.2% of listings offer 3+ bedrooms, catering to larger groups and families seeking more space in Plymouth.
Plymouth Vacation Rental Guest Capacity Trends (2026)
Distribution of Listings by Guest Capacity
Guest Capacity Insights for Plymouth
- The most common guest capacity trend in Plymouth vacation rentals is listings accommodating 6 guests (40.7%). This suggests the primary traveler segment is likely larger groups.
- Properties designed for 6 guests and 8+ guests dominate the Plymouth STR market, accounting for 62.9% of listings.
- 62.9% of properties accommodate 6+ guests, serving the market segment for larger families or group travel in Plymouth.
- On average, properties in Plymouth are equipped to host 5.0 guests.
Plymouth Airbnb Booking Patterns (2026): Available vs. Booked Days
Available Days Distribution
Booked Days Distribution
Booking Pattern Insights for Plymouth
- The most common availability pattern in Plymouth falls within the 271-366 days range, representing 48.1% of listings. This suggests many properties have significant open periods on their calendars.
- Approximately 77.7% of listings show high availability (181+ days open annually), indicating potential for increased bookings or specific owner usage patterns.
- For booked days, the 91-180 days range is most frequent in Plymouth (37%), reflecting common guest stay durations or potential owner blocking patterns.
- A notable 22.2% of properties secure long booking periods (181+ days booked per year), highlighting successful long-term rental strategies or significant owner usage.
Plymouth Airbnb Minimum Stay Requirements Analysis
Distribution of Listings by Minimum Night Requirement
1 Night
4 listings
14.8% of total
2 Nights
16 listings
59.3% of total
3 Nights
1 listings
3.7% of total
7-29 Nights
1 listings
3.7% of total
30+ Nights
5 listings
18.5% of total
Key Insights
- The most prevalent minimum stay requirement in Plymouth is 2 Nights, adopted by 59.3% of listings. This highlights the market's preference for shorter, flexible bookings.
- A strong majority (74.1%) of the Plymouth Airbnb data shows acceptance of very short stays (1-2 nights), indicating a dynamic, high-turnover market.
- A significant segment (18.5%) caters to monthly stays (30+ nights) in Plymouth, pointing to opportunities in the extended-stay market.
Recommendations
- Align with the market by considering a 2 Nights minimum stay, as 59.3% of Plymouth hosts use this setting.
- If feasible, allowing 1-night stays, especially midweek or during low season, could capture last-minute bookings, as only 14.8% currently do.
- A 2-night minimum appears standard (59.3%). Consider this for weekends or peak periods.
- Explore offering discounts for stays of 30+ nights to attract the 18.5% of the market seeking extended stays.
- Adjust minimum nights based on seasonality – potentially shorter during low season and longer during peak demand periods in Plymouth.
Plymouth Airbnb Cancellation Policy Trends Analysis (2026)
Limited
2 listings
7.4% of total
Flexible
4 listings
14.8% of total
Moderate
11 listings
40.7% of total
Firm
7 listings
25.9% of total
Strict
3 listings
11.1% of total
Cancellation Policy Insights for Plymouth
- The prevailing Airbnb cancellation policy trend in Plymouth is Moderate, used by 40.7% of listings.
- There's a relatively balanced mix between guest-friendly (55.5%) and stricter (37.0%) policies, offering choices for different guest needs.
Recommendations for Hosts
- Consider adopting a Moderate policy to align with the 40.7% market standard in Plymouth.
- Using a Strict policy might deter some guests, as only 11.1% of listings use it. Evaluate if potential revenue protection outweighs possible lower booking rates.
- Regularly review your cancellation policy against competitors and market demand shifts in Plymouth.
Plymouth STR Booking Lead Time Analysis (2026)
Average Booking Lead Time by Month
Booking Lead Time Insights for Plymouth
- The overall average booking lead time for vacation rentals in Plymouth is 71 days.
- Guests book furthest in advance for stays during May (average 98 days), likely coinciding with peak travel demand or local events.
- The shortest booking windows occur for stays in February (average 43 days), indicating more last-minute travel plans during this time.
- Seasonally, Fall (85 days avg.) sees the longest lead times, while Winter (53 days avg.) has the shortest, reflecting typical travel planning cycles.
Recommendations for Hosts
- Use the overall average lead time (71 days) as a baseline for your pricing and availability strategy in Plymouth.
- For May stays, consider implementing length-of-stay discounts or slightly higher rates for bookings made less than 98 days out to capitalize on advance planning.
- Target marketing efforts for the Fall season well in advance (at least 85 days) to capture early planners.
- Monitor your own booking lead times against these Plymouth averages to identify opportunities for dynamic pricing adjustments.
Popular & Essential Airbnb Amenities in Plymouth (2026)
Amenity Prevalence
Amenity Insights for Plymouth
- Essential amenities in Plymouth that guests expect include: Free parking on premises, Air conditioning, Smoke alarm, Coffee maker, Heating, Hot water, Wifi. Lacking these (any) could significantly impact bookings.
- Popular amenities like TV, Hair dryer, Shampoo are common but not universal. Offering these can provide a competitive edge.
Recommendations for Hosts
- Ensure your listing includes all essential amenities for Plymouth: Free parking on premises, Air conditioning, Smoke alarm, Coffee maker, Heating, Hot water, Wifi.
- Prioritize adding missing essentials: Coffee maker, Heating, Hot water, Wifi.
- Consider adding popular differentiators like TV or Hair dryer to increase appeal.
- Highlight unique or less common amenities you offer (e.g., hot tub, dedicated workspace, EV charger) in your listing description and photos.
- Regularly check competitor amenities in Plymouth to stay competitive.
Plymouth Airbnb Guest Demographics & Profile Analysis (2026)
Guest Profile Summary for Plymouth
- The typical guest profile for Airbnb in Plymouth consists of primarily domestic travelers (98%), often arriving from nearby Reno, typically belonging to the Post-2000s (Gen Z/Alpha) group (50%), primarily speaking English or Spanish.
- Domestic travelers account for 98.2% of guests.
- Key international markets include United States (98.2%) and United Kingdom (0.4%).
- Top languages spoken are English (74.8%) followed by Spanish (6.5%).
- A significant demographic segment is the Post-2000s (Gen Z/Alpha) group, representing 50% of guests.
Recommendations for Hosts
- Target domestic marketing efforts towards travelers from Reno and Sacramento.
- Tailor amenities and listing descriptions to appeal to the dominant Post-2000s (Gen Z/Alpha) demographic (e.g., highlight fast WiFi, smart home features, local guides).
- Highlight unique local experiences or amenities relevant to the primary guest profile.
- Consider seasonal promotions aligned with peak travel times for key origin markets.
Nearby Short-Term Rental Market Comparison
How does the Plymouth Airbnb market stack up against its neighbors? Compare key performance metrics like average monthly revenue, ADR, and occupancy rates in surrounding areas to understand the broader regional STR landscape.
| Market | Active Properties | Monthly Revenue | Daily Rate | Avg. Occupancy |
|---|---|---|---|---|
| Wawona | 66 | $7,186 | $548.44 | 45% |
| Yosemite National Park | 227 | $6,835 | $511.03 | 44% |
| Zephyr Cove | 192 | $6,404 | $642.42 | 37% |
| Homewood | 150 | $5,842 | $595.57 | 40% |
| Meyers | 177 | $5,840 | $500.97 | 43% |
| Glenbrook | 32 | $5,788 | $841.74 | 35% |
| Yosemite West | 29 | $5,597 | $423.79 | 49% |
| Carnelian Bay | 349 | $5,362 | $561.69 | 39% |
| Incline Village-Crystal Bay | 204 | $5,197 | $589.54 | 35% |
| Tahoma | 199 | $5,011 | $605.47 | 36% |