Paso Robles Airbnb Market Analysis 2026: Short Term Rental Data & Vacation Rental Statistics in California, United States
Is Airbnb profitable in Paso Robles in 2026? Explore comprehensive Airbnb analytics for Paso Robles, California, United States to uncover income potential. This 2026 STR market report for Paso Robles, based on AirROI data from February 2025 to January 2026, reveals key trends in the market of 690 active listings.
Whether you're considering an Airbnb investment in Paso Robles, optimizing your existing vacation rental, or exploring rental arbitrage opportunities, understanding the Paso Robles Airbnb data is crucial. Leveraging the low regulation environment is key to maximizing your short term rental income potential. Let's dive into the specifics.
Key Paso Robles Airbnb Performance Metrics Overview
Monthly Airbnb Revenue Variations & Income Potential in Paso Robles (2026)
Understanding the monthly revenue variations for Airbnb listings in Paso Robles is key to maximizing your short term rental income potential. Seasonality significantly impacts earnings. Our analysis, based on data from the past 12 months, shows that the peak revenue month for STRs in Paso Robles is typically July, while February often presents the lowest earnings, highlighting opportunities for strategic pricing adjustments during shoulder and low seasons. Explore the typical Airbnb income in Paso Robles across different performance tiers:
- Best-in-class properties (Top 10%) achieve $11,221+ monthly, often utilizing dynamic pricing and superior guest experiences.
- Strong performing properties (Top 25%) earn $6,870 or more, indicating effective management and desirable locations/amenities.
- Typical properties (Median) generate around $4,096 per month, representing the average market performance.
- Entry-level properties (Bottom 25%) see earnings around $2,256, often with potential for optimization.
Average Monthly Airbnb Earnings Trend in Paso Robles
Paso Robles Airbnb Occupancy Rate Trends (2026)
Maximize your bookings by understanding the Paso Robles STR occupancy trends. Seasonal demand shifts significantly influence how often properties are booked. Typically, Julysees the highest demand (peak season occupancy), while January experiences the lowest (low season). Effective strategies, like adjusting minimum stays or offering promotions, can boost occupancy during slower periods. Here's how different property tiers perform in Paso Robles:
- Best-in-class properties (Top 10%) achieve 72%+ occupancy, indicating high desirability and potentially optimized availability.
- Strong performing properties (Top 25%) maintain 56% or higher occupancy, suggesting good market fit and guest satisfaction.
- Typical properties (Median) have an occupancy rate around 38%.
- Entry-level properties (Bottom 25%) average 23% occupancy, potentially facing higher vacancy.
Average Monthly Occupancy Rate Trend in Paso Robles
Average Daily Rate (ADR) Airbnb Trends in Paso Robles (2026)
Effective short term rental pricing strategy in Paso Robles involves understanding monthly ADR fluctuations. The Average Daily Rate (ADR) for Airbnb in Paso Robles typically peaks in June and dips lowest during February. Leveraging Airbnb dynamic pricing tools or strategies based on this seasonality can significantly boost revenue. Here's a look at the typical nightly rates achieved:
- Best-in-class properties (Top 10%) command rates of $837+ per night, often due to premium features or locations.
- Strong performing properties (Top 25%) achieve nightly rates of $506 or more.
- Typical properties (Median) charge around $338 per night.
- Entry-level properties (Bottom 25%) earn around $218 per night.
Average Daily Rate (ADR) Trend by Month in Paso Robles
Get Live Paso Robles Market Intelligence 👇

Explore Real-time Analytics
Airbnb Seasonality Analysis & Trends in Paso Robles (2026)
Peak Season (July, June, May)
- Revenue averages $6,879 per month
- Occupancy rates average 45.3%
- Daily rates average $454
Shoulder Season
- Revenue averages $5,683 per month
- Occupancy maintains around 41.2%
- Daily rates hold near $441
Low Season (January, February, March)
- Revenue drops to average $3,972 per month
- Occupancy decreases to average 33.4%
- Daily rates adjust to average $411
Seasonality Insights for Paso Robles
- The Airbnb seasonality in Paso Robles shows highly seasonal trends requiring careful strategy. While the sections above show seasonal averages, it's also insightful to look at the extremes:
- During the high season, the absolute peak month showcases Paso Robles's highest earning potential, with monthly revenues capable of climbing to $7,364, occupancy reaching a high of 47.4%, and ADRs peaking at $461.
- Conversely, the slowest single month of the year, typically falling within the low season, marks the market's lowest point. In this month, revenue might dip to $3,403, occupancy could drop to 28.8%, and ADRs may adjust down to $384.
- Understanding both the seasonal averages and these monthly peaks and troughs in revenue, occupancy, and ADR is crucial for maximizing your Airbnb profit potential in Paso Robles.
Seasonal Strategies for Maximizing Profit
- Peak Season: Maximize revenue through premium pricing and potentially longer minimum stays. Ensure high availability.
- Low Season: Offer competitive pricing, special promotions (e.g., extended stay discounts), and flexible cancellation policies. Target off-season travelers like remote workers or budget-conscious guests.
- Shoulder Seasons: Implement dynamic pricing that balances peak and low rates. Target weekend travelers or specific events. Offer slightly more flexible terms than peak season.
- Regularly analyze your own performance against these Paso Robles seasonality benchmarks and adjust your pricing and availability strategy accordingly.
Best Areas for Airbnb Investment in Paso Robles (2026)
Exploring the top neighborhoods for short-term rentals in Paso Robles? This section highlights key areas, outlining why they are attractive for hosts and guests, along with notable local attractions. Consider these locations based on your target guest profile and investment strategy.
| Neighborhood / Area | Why Host Here? (Target Guests & Appeal) | Key Attractions & Landmarks |
|---|---|---|
| Downtown Paso Robles | The heart of the city with a vibrant atmosphere, ideal for visitors looking for wine tasting rooms, restaurants, and shops. Close to festivals and events that attract tourists year-round. | Pasadena Park, Downtown City Park, Paso Robles Wine Centre, Sensorio, Harlow's, The Paso Robles Inn |
| Wine Country | Famous for its vineyards and wineries, perfect for those interested in wine tourism. Offers a scenic and serene environment for guests looking for relaxation and exploration of the wine culture. | Justin Vineyards & Winery, Tablas Creek Vineyard, Daou Vineyards, Eberle Winery, Ranchita Canyon Vineyard, Niner Wine Estates |
| Templeton | A charming small town neighboring Paso Robles, known for its quaint shops and excellent dining. Attractive for travelers seeking a quieter experience close to the wine region. | Templeton Community Park, Templeton Historical Museum, Pine Street Park, Red Soles Winery, Margarita Adventures |
| San Miguel | Just north of Paso Robles, this area offers a more rural experience. It features historic sites and is near wineries, catering to a different clientele looking for unique stays. | San Miguel Mission, Historic San Miguel, Pinnacles National Park, Don Juan Pond, San Miguel Market |
| Lake Nacimiento | Ideal for those who love outdoor activities. Attracts visitors for boating, fishing, and camping. A great area for cabins and lakeside homes. | Lake Nacimiento, Nacimiento-Fergusson Road, Pine Mountain Campground, Lake San Antonio, Murray Family Farms |
| Adelaida | Nestled in the rolling hills, this area is home to numerous boutique wineries and stunning landscapes. Perfect for travelers looking for a luxurious wine retreat. | Adelaida Vineyards & Winery, Lusso Della Terra, Vina Robles Amphitheatre, Ledge Vineyards, Nielson Vineyard |
| Paso Robles Hot Springs | A unique destination for those seeking relaxation and wellness through natural hot springs. In demand amongst spa enthusiasts and those looking to unwind. | River Oaks Hot Springs Spa, Paso Robles Inn Hot Springs, Sensory Spa by morgan, The Spa at River Oaks, Mt. San Antonio Hot Springs |
| North County | Covers an expansive area offering various small towns adjacent to wine country. Suitable for guests looking for a homey experience near wineries and farm-to-table dining options. | Cayucos Beach, Morro Bay State Park, Estero Bluffs State Park, Hearst Castle, Nitt Witt Ridge |
Understanding Airbnb License Requirements & STR Laws in Paso Robles (2026)
While Paso Robles, California, United States currently shows low STR regulations, specific Airbnb license requirements might still exist or change. Always verify the latest short term rental regulations and Airbnb license requirements directly with local government authorities for Paso Robles to ensure full compliance before hosting.
(Source: AirROI data, 2026, based on 0% licensed listings)
Top Performing Airbnb Properties in Paso Robles (2026)
Benchmark your potential! Explore examples of top-performing Airbnb properties in Paso Roblesbased on Trailing Twelve Month (TTM) revenue. Analyze their characteristics, revenue, occupancy rate, and ADR to understand what drives success in this market.
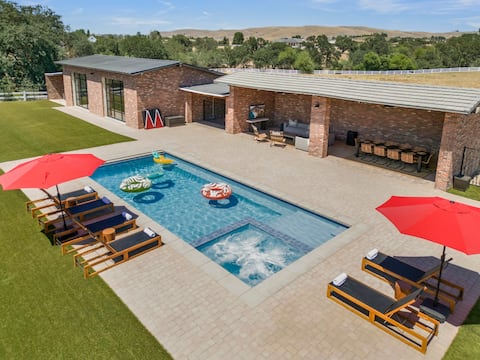
15 Acre Luxury Estate | VIP Experience
Entire Place • 8 bedrooms
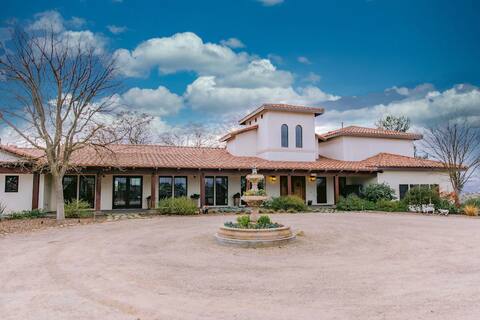
Amazing 15 Person Villa with Pool/Spa!
Entire Place • 8 bedrooms
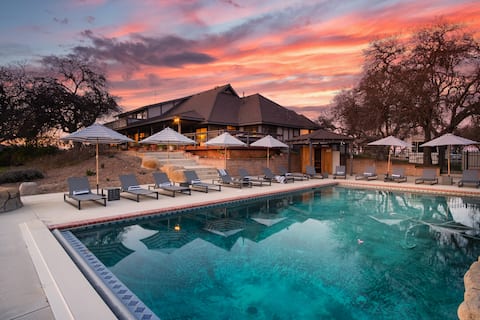
Cathedral by AvantStay | Estate w/ Sauna & Views
Entire Place • 7 bedrooms
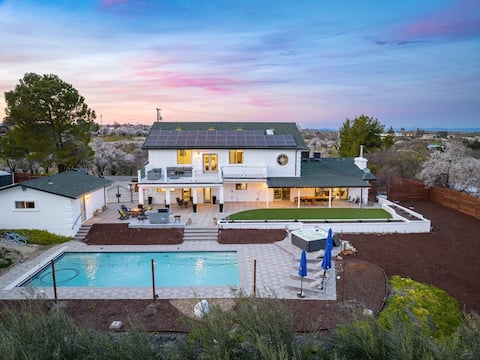
Min to Downtown, 7 BR/6 BA Estate-Pool & Hot Tub
Entire Place • 7 bedrooms
Dolcetto by AvantStay | Wine Country Mansion
Entire Place • 6 bedrooms
Rancho Robles by AvantStay | Views, Pool & Privacy
Entire Place • 6 bedrooms
Note: Performance varies based on location, size, amenities, seasonality, and management quality. Data reflects the past 12 months.
Top Performing Airbnb Hosts in Paso Robles (2026)
Learn from the best! This table showcases top-performing Airbnb hosts in Paso Robles based on the number of properties managed and estimated total revenue over the past year. Analyze their scale and performance metrics.
| Host Name | Properties | Grossing Revenue | Stay Reviews | Avg Rating |
|---|---|---|---|---|
| Paso Robles Vacation Rentals | 81 | $4,218,017 | 3384 | 4.87/5.0 |
| AvantStay Paso Robles | 13 | $2,243,578 | 540 | 4.89/5.0 |
| Kathy | 20 | $1,765,141 | 612 | 4.83/5.0 |
| April | 8 | $976,047 | 1541 | 4.97/5.0 |
| Stephanie | 5 | $859,243 | 335 | 4.98/5.0 |
| Leila And Tracey | 8 | $749,998 | 1557 | 4.96/5.0 |
| Karlie | 16 | $700,256 | 1351 | 4.89/5.0 |
| Lisa | 7 | $696,503 | 904 | 4.99/5.0 |
| Patrick And Trish | 8 | $577,240 | 849 | 4.92/5.0 |
| Resort Style Vacation Homes | 1 | $521,460 | 84 | 4.99/5.0 |
Analyzing the strategies of top hosts, such as their property selection, pricing, and guest communication, can offer valuable lessons for optimizing your own Airbnb operations in Paso Robles.
Dive Deeper: Advanced Paso Robles STR Market Data (2026)
Ready to unlock more insights? AirROI provides access to advanced metrics and comprehensive Airbnb data for Paso Robles. Explore detailed analytics beyond this report to refine your investment strategy, optimize pricing, and maximize your vacation rental profits.
Explore Advanced MetricsPaso Robles Short-Term Rental Market Composition (2026): Property & Room Types
Room Type Distribution
Property Type Distribution
Market Composition Insights for Paso Robles
- The Paso Robles Airbnb market composition is heavily skewed towards Entire Home/Apt listings, which make up 92.5% of the 690 active rentals. This indicates strong guest preference for privacy and space.
- Looking at the property type distribution in Paso Robles, House properties are the most common (73%), reflecting the local real estate landscape.
- Houses represent a significant 73% portion, catering likely to families or larger groups.
- The presence of 7.2% Hotel/Boutique listings indicates integration with traditional hospitality.
- Smaller segments like apartment/condo, unique stays (combined 5.3%) offer potential for unique stay experiences.
Paso Robles Airbnb Room Capacity Analysis (2026): Bedroom Distribution
Distribution of Listings by Number of Bedrooms
Room Capacity Insights for Paso Robles
- The dominant room capacity in Paso Robles is 3 bedrooms listings, making up 23.5% of the market. This suggests a strong demand for properties suitable for families or small groups.
- Together, 3 bedrooms and 2 bedrooms properties represent 46.7% of the active Airbnb listings in Paso Robles, indicating a high concentration in these sizes.
- A significant 48.3% of listings offer 3+ bedrooms, catering to larger groups and families seeking more space in Paso Robles.
Paso Robles Vacation Rental Guest Capacity Trends (2026)
Distribution of Listings by Guest Capacity
Guest Capacity Insights for Paso Robles
- The most common guest capacity trend in Paso Robles vacation rentals is listings accommodating 8+ guests (29.6%). This suggests the primary traveler segment is likely larger groups.
- Properties designed for 8+ guests and 6 guests dominate the Paso Robles STR market, accounting for 50.9% of listings.
- 51.9% of properties accommodate 6+ guests, serving the market segment for larger families or group travel in Paso Robles.
- On average, properties in Paso Robles are equipped to host 5.1 guests.
Paso Robles Airbnb Booking Patterns (2026): Available vs. Booked Days
Available Days Distribution
Booked Days Distribution
Booking Pattern Insights for Paso Robles
- The most common availability pattern in Paso Robles falls within the 181-270 days range, representing 43.9% of listings. This suggests many properties have significant open periods on their calendars.
- Approximately 78.2% of listings show high availability (181+ days open annually), indicating potential for increased bookings or specific owner usage patterns.
- For booked days, the 91-180 days range is most frequent in Paso Robles (46.2%), reflecting common guest stay durations or potential owner blocking patterns.
- A notable 22.6% of properties secure long booking periods (181+ days booked per year), highlighting successful long-term rental strategies or significant owner usage.
Paso Robles Airbnb Minimum Stay Requirements Analysis
Distribution of Listings by Minimum Night Requirement
1 Night
205 listings
29.7% of total
2 Nights
227 listings
32.9% of total
3 Nights
13 listings
1.9% of total
4-6 Nights
1 listings
0.1% of total
7-29 Nights
16 listings
2.3% of total
30+ Nights
228 listings
33% of total
Key Insights
- The most prevalent minimum stay requirement in Paso Robles is 30+ Nights, adopted by 33% of listings. This highlights the market's preference for longer commitments.
- A strong majority (62.6%) of the Paso Robles Airbnb data shows acceptance of very short stays (1-2 nights), indicating a dynamic, high-turnover market.
- A significant segment (33%) caters to monthly stays (30+ nights) in Paso Robles, pointing to opportunities in the extended-stay market.
Recommendations
- Align with the market by considering a 30+ Nights minimum stay, as 33% of Paso Robles hosts use this setting.
- If feasible, allowing 1-night stays, especially midweek or during low season, could capture last-minute bookings, as only 29.7% currently do.
- Explore offering discounts for stays of 30+ nights to attract the 33% of the market seeking extended stays.
- Adjust minimum nights based on seasonality – potentially shorter during low season and longer during peak demand periods in Paso Robles.
Paso Robles Airbnb Cancellation Policy Trends Analysis (2026)
Limited
5 listings
0.7% of total
Refundable
2 listings
0.3% of total
Super Strict 60 Days
4 listings
0.6% of total
Super Strict 30 Days
14 listings
2% of total
Non-refundable
2 listings
0.3% of total
Flexible
75 listings
10.9% of total
Moderate
176 listings
25.5% of total
Firm
348 listings
50.4% of total
Strict
64 listings
9.3% of total
Cancellation Policy Insights for Paso Robles
- The prevailing Airbnb cancellation policy trend in Paso Robles is Firm, used by 50.4% of listings.
- A majority (59.7%) of hosts in Paso Robles utilize Firm or Strict policies, indicating a market where hosts prioritize booking security.
- Strict cancellation policies are quite rare (9.3%), potentially making listings with this policy less competitive unless justified by high demand or property type.
Recommendations for Hosts
- Consider adopting a Firm policy to align with the 50.4% market standard in Paso Robles.
- Using a Strict policy might deter some guests, as only 9.3% of listings use it. Evaluate if potential revenue protection outweighs possible lower booking rates.
- Regularly review your cancellation policy against competitors and market demand shifts in Paso Robles.
Paso Robles STR Booking Lead Time Analysis (2026)
Average Booking Lead Time by Month
Booking Lead Time Insights for Paso Robles
- The overall average booking lead time for vacation rentals in Paso Robles is 54 days.
- Guests book furthest in advance for stays during October (average 71 days), likely coinciding with peak travel demand or local events.
- The shortest booking windows occur for stays in February (average 37 days), indicating more last-minute travel plans during this time.
- Seasonally, Fall (64 days avg.) sees the longest lead times, while Winter (41 days avg.) has the shortest, reflecting typical travel planning cycles.
Recommendations for Hosts
- Use the overall average lead time (54 days) as a baseline for your pricing and availability strategy in Paso Robles.
- For October stays, consider implementing length-of-stay discounts or slightly higher rates for bookings made less than 71 days out to capitalize on advance planning.
- Target marketing efforts for the Fall season well in advance (at least 64 days) to capture early planners.
- Monitor your own booking lead times against these Paso Robles averages to identify opportunities for dynamic pricing adjustments.
Popular & Essential Airbnb Amenities in Paso Robles (2026)
Amenity Prevalence
Amenity Insights for Paso Robles
- Essential amenities in Paso Robles that guests expect include: Wifi, Air conditioning, Smoke alarm, Heating, Carbon monoxide alarm. Lacking these (any) could significantly impact bookings.
- Popular amenities like TV, Free parking on premises, Hair dryer are common but not universal. Offering these can provide a competitive edge.
Recommendations for Hosts
- Ensure your listing includes all essential amenities for Paso Robles: Wifi, Air conditioning, Smoke alarm, Heating, Carbon monoxide alarm.
- Prioritize adding missing essentials: Wifi, Air conditioning, Smoke alarm, Heating, Carbon monoxide alarm.
- Consider adding popular differentiators like TV or Free parking on premises to increase appeal.
- Highlight unique or less common amenities you offer (e.g., hot tub, dedicated workspace, EV charger) in your listing description and photos.
- Regularly check competitor amenities in Paso Robles to stay competitive.
Paso Robles Airbnb Guest Demographics & Profile Analysis (2026)
Guest Profile Summary for Paso Robles
- The typical guest profile for Airbnb in Paso Robles consists of primarily domestic travelers (97%), often arriving from nearby Los Angeles, typically belonging to the Post-2000s (Gen Z/Alpha) group (50%), primarily speaking English or Spanish.
- Domestic travelers account for 96.9% of guests.
- Key international markets include United States (96.9%) and United Kingdom (0.7%).
- Top languages spoken are English (67.2%) followed by Spanish (15.2%).
- A significant demographic segment is the Post-2000s (Gen Z/Alpha) group, representing 50% of guests.
Recommendations for Hosts
- Target domestic marketing efforts towards travelers from Los Angeles and San Francisco.
- Tailor amenities and listing descriptions to appeal to the dominant Post-2000s (Gen Z/Alpha) demographic (e.g., highlight fast WiFi, smart home features, local guides).
- Highlight unique local experiences or amenities relevant to the primary guest profile.
- Consider seasonal promotions aligned with peak travel times for key origin markets.
Nearby Short-Term Rental Market Comparison
How does the Paso Robles Airbnb market stack up against its neighbors? Compare key performance metrics like average monthly revenue, ADR, and occupancy rates in surrounding areas to understand the broader regional STR landscape.
| Market | Active Properties | Monthly Revenue | Daily Rate | Avg. Occupancy |
|---|---|---|---|---|
| Carmel Point | 15 | $14,483 | $1046.17 | 54% |
| Montecito | 127 | $10,744 | $950.35 | 51% |
| Del Monte Forest | 105 | $10,280 | $964.89 | 47% |
| Carmel-by-the-Sea | 305 | $8,657 | $680.02 | 49% |
| Pleasure Point | 90 | $7,920 | $525.95 | 52% |
| Carmel | 29 | $7,901 | $597.00 | 49% |
| Castroville | 16 | $7,830 | $558.55 | 50% |
| Sand City | 10 | $7,391 | $497.43 | 60% |
| Del Rey Oaks | 33 | $7,281 | $474.67 | 54% |
| Los Olivos | 30 | $7,240 | $705.20 | 43% |