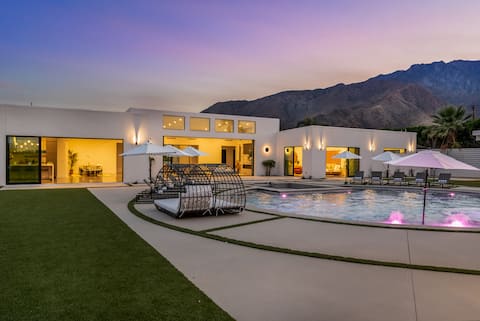
Palm Springs Airbnb Market Analysis 2026: Short Term Rental Data & Vacation Rental Statistics in California, United States
Is Airbnb profitable in Palm Springs in 2026? Explore comprehensive Airbnb analytics for Palm Springs, California, United States to uncover income potential. This 2026 STR market report for Palm Springs, based on AirROI data from February 2025 to January 2026, reveals key trends in the bustling market of 3,441 active listings.
Whether you're considering an Airbnb investment in Palm Springs, optimizing your existing vacation rental, or exploring rental arbitrage opportunities, understanding the Palm Springs Airbnb data is crucial. Navigating the high regulation landscape is key to maximizing your short term rental income potential. Let's dive into the specifics.
Key Palm Springs Airbnb Performance Metrics Overview
Monthly Airbnb Revenue Variations & Income Potential in Palm Springs (2026)
Understanding the monthly revenue variations for Airbnb listings in Palm Springs is key to maximizing your short term rental income potential. Seasonality significantly impacts earnings. Our analysis, based on data from the past 12 months, shows that the peak revenue month for STRs in Palm Springs is typically March, while September often presents the lowest earnings, highlighting opportunities for strategic pricing adjustments during shoulder and low seasons. Explore the typical Airbnb income in Palm Springs across different performance tiers:
- Best-in-class properties (Top 10%) achieve $14,479+ monthly, often utilizing dynamic pricing and superior guest experiences.
- Strong performing properties (Top 25%) earn $9,414 or more, indicating effective management and desirable locations/amenities.
- Typical properties (Median) generate around $5,080 per month, representing the average market performance.
- Entry-level properties (Bottom 25%) see earnings around $2,342, often with potential for optimization.
Average Monthly Airbnb Earnings Trend in Palm Springs
Palm Springs Airbnb Occupancy Rate Trends (2026)
Maximize your bookings by understanding the Palm Springs STR occupancy trends. Seasonal demand shifts significantly influence how often properties are booked. Typically, Marchsees the highest demand (peak season occupancy), while September experiences the lowest (low season). Effective strategies, like adjusting minimum stays or offering promotions, can boost occupancy during slower periods. Here's how different property tiers perform in Palm Springs:
- Best-in-class properties (Top 10%) achieve 77%+ occupancy, indicating high desirability and potentially optimized availability.
- Strong performing properties (Top 25%) maintain 58% or higher occupancy, suggesting good market fit and guest satisfaction.
- Typical properties (Median) have an occupancy rate around 38%.
- Entry-level properties (Bottom 25%) average 20% occupancy, potentially facing higher vacancy.
Average Monthly Occupancy Rate Trend in Palm Springs
Average Daily Rate (ADR) Airbnb Trends in Palm Springs (2026)
Effective short term rental pricing strategy in Palm Springs involves understanding monthly ADR fluctuations. The Average Daily Rate (ADR) for Airbnb in Palm Springs typically peaks in April and dips lowest during August. Leveraging Airbnb dynamic pricing tools or strategies based on this seasonality can significantly boost revenue. Here's a look at the typical nightly rates achieved:
- Best-in-class properties (Top 10%) command rates of $893+ per night, often due to premium features or locations.
- Strong performing properties (Top 25%) achieve nightly rates of $616 or more.
- Typical properties (Median) charge around $411 per night.
- Entry-level properties (Bottom 25%) earn around $222 per night.
Average Daily Rate (ADR) Trend by Month in Palm Springs
Get Live Palm Springs Market Intelligence 👇

Explore Real-time Analytics
Airbnb Seasonality Analysis & Trends in Palm Springs (2026)
Peak Season (March, April, February)
- Revenue averages $10,431 per month
- Occupancy rates average 56.7%
- Daily rates average $545
Shoulder Season
- Revenue averages $6,229 per month
- Occupancy maintains around 37.1%
- Daily rates hold near $486
Low Season (July, August, September)
- Revenue drops to average $4,557 per month
- Occupancy decreases to average 31.9%
- Daily rates adjust to average $432
Seasonality Insights for Palm Springs
- The Airbnb seasonality in Palm Springs shows highly seasonal trends requiring careful strategy. While the sections above show seasonal averages, it's also insightful to look at the extremes:
- During the high season, the absolute peak month showcases Palm Springs's highest earning potential, with monthly revenues capable of climbing to $11,976, occupancy reaching a high of 63.7%, and ADRs peaking at $589.
- Conversely, the slowest single month of the year, typically falling within the low season, marks the market's lowest point. In this month, revenue might dip to $4,172, occupancy could drop to 29.7%, and ADRs may adjust down to $423.
- Understanding both the seasonal averages and these monthly peaks and troughs in revenue, occupancy, and ADR is crucial for maximizing your Airbnb profit potential in Palm Springs.
Seasonal Strategies for Maximizing Profit
- Peak Season: Maximize revenue through premium pricing and potentially longer minimum stays. Ensure high availability.
- Low Season: Offer competitive pricing, special promotions (e.g., extended stay discounts), and flexible cancellation policies. Target off-season travelers like remote workers or budget-conscious guests.
- Shoulder Seasons: Implement dynamic pricing that balances peak and low rates. Target weekend travelers or specific events. Offer slightly more flexible terms than peak season.
- Regularly analyze your own performance against these Palm Springs seasonality benchmarks and adjust your pricing and availability strategy accordingly.
Best Areas for Airbnb Investment in Palm Springs (2026)
Exploring the top neighborhoods for short-term rentals in Palm Springs? This section highlights key areas, outlining why they are attractive for hosts and guests, along with notable local attractions. Consider these locations based on your target guest profile and investment strategy.
| Neighborhood / Area | Why Host Here? (Target Guests & Appeal) | Key Attractions & Landmarks |
|---|---|---|
| Palm Springs Downtown | The heart of Palm Springs with a vibrant mix of restaurants, shops, and nightlife. It's the go-to spot for visitors seeking entertainment and culture in a picturesque setting. | Palm Springs Art Museum, Tennis Club, Palm Canyon Drive, Spencers Restaurant, VillageFest |
| Tahquitz River Estates | A quiet residential neighborhood known for its mid-century modern architecture and proximity to downtown. Perfect for those looking for a peaceful stay close to many attractions. | Tahquitz River, local coffee shops, art galleries, family-friendly parks, mountain hiking trails |
| Desert Hot Springs | Known for its natural hot springs, this area is popular for wellness retreats. It attracts visitors looking for relaxation and spa experiences. | Desert Hot Springs Spa Hotel, Cielo Spa, Miracle Springs Resort, Bamboo Spa, natural mineral water pools |
| Canyon Country Club | A charming neighborhood set against the backdrop of the San Jacinto Mountains, offering golf courses and scenic views. Ideal for outdoor enthusiasts and golf lovers. | Canyon Country Club Golf Course, hiking routes, bike trails, golf clubs, desert views |
| Twin Palms | A historic neighborhood famous for its iconic mid-century architecture and celebrity homes. It's attractive for those seeking a stylish and unique vacation experience. | Twin Palms Historic District, Frank Sinatra's House, local boutiques, modernist architecture, art installations |
| Racquet Club Estates | Another iconic mid-century modern neighborhood that attracts design enthusiasts and visitors looking for a serene escape with luxurious homes. | Racquet Club Estates, Palm Springs Tennis Club, vintage shopping, local art galleries, scenic streets |
| Sunrise Park | Close to major attractions yet offering a tranquil environment. This area is ideal for families looking for spacious accommodations. | Sunrise Park, family-friendly amenities, local dining, shops nearby, walking trails |
| Smoke Tree Ranch | A unique, exclusive community rich in history, surrounded by nature, and offering luxurious accommodations. Great for travelers seeking tranquility and privacy. | Smoke Tree Ranch Resort, nature trails, horseback riding, lush landscapes, golfing opportunities |
Understanding Airbnb License Requirements & STR Laws in Palm Springs (2026)
Yes, Palm Springs, California, United States enforces high STR regulations. Obtaining a license and ensuring compliance is almost certainly required according to current 2026 STR laws. Always verify the latest short term rental regulations and Airbnb license requirements directly with local government authorities for Palm Springs to ensure full compliance before hosting.
(Source: AirROI data, 2026, based on 46% licensed listings)
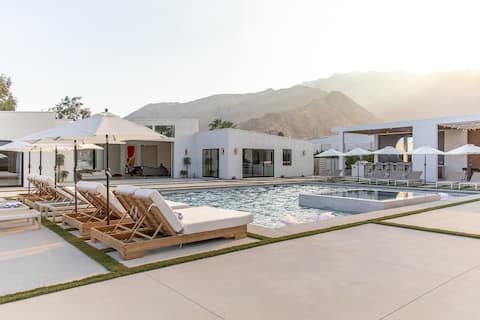
Top Performing Airbnb Properties in Palm Springs (2026)
Benchmark your potential! Explore examples of top-performing Airbnb properties in Palm Springsbased on Trailing Twelve Month (TTM) revenue. Analyze their characteristics, revenue, occupancy rate, and ADR to understand what drives success in this market.
7,000 Sq Ft Luxury Oasis - Spa Lounge & Airstream
Entire Place • 9 bedrooms
23BR Designer Concept Buyout! True PS Experience!
Entire Place • 23 bedrooms

The Marley Hotel by AvantStay | Full Hotel Buyout
Entire Place • 9 bedrooms
Blackhaus Full Buyout by AvantStay | 16-Room Hotel
Entire Place • 16 bedrooms

Hotel El Cid by AvantStay | Full Hotel Buyout
Entire Place • 7 bedrooms
The Catalina Palm Springs: 9BR Luxe Desert Oasis
Entire Place • 9 bedrooms
Note: Performance varies based on location, size, amenities, seasonality, and management quality. Data reflects the past 12 months.
Top Performing Airbnb Hosts in Palm Springs (2026)
Learn from the best! This table showcases top-performing Airbnb hosts in Palm Springs based on the number of properties managed and estimated total revenue over the past year. Analyze their scale and performance metrics.
| Host Name | Properties | Grossing Revenue | Stay Reviews | Avg Rating |
|---|---|---|---|---|
| ACME House Company | 151 | $12,237,134 | 2577 | 4.83/5.0 |
| Poolside Vacation Rentals | 92 | $11,924,014 | 4570 | 4.94/5.0 |
| AvantStay Palm Springs | 61 | $5,324,528 | 2449 | 4.71/5.0 |
| Natural Retreats (W) | 42 | $3,097,107 | 306 | 4.86/5.0 |
| Ryson Vacations | 50 | $2,493,504 | 1377 | 4.83/5.0 |
| Relax Palm Springs | 49 | $2,490,545 | 1418 | 4.88/5.0 |
| Michael | 36 | $2,489,146 | 1664 | 4.87/5.0 |
| APEK Rentals | 28 | $2,327,889 | 1392 | 4.65/5.0 |
| WorryFreeBnB | 28 | $2,211,090 | 1479 | 4.92/5.0 |
| Joe | 29 | $1,987,061 | 1048 | 4.92/5.0 |
Analyzing the strategies of top hosts, such as their property selection, pricing, and guest communication, can offer valuable lessons for optimizing your own Airbnb operations in Palm Springs.
Dive Deeper: Advanced Palm Springs STR Market Data (2026)
Ready to unlock more insights? AirROI provides access to advanced metrics and comprehensive Airbnb data for Palm Springs. Explore detailed analytics beyond this report to refine your investment strategy, optimize pricing, and maximize your vacation rental profits.
Explore Advanced MetricsPalm Springs Short-Term Rental Market Composition (2026): Property & Room Types
Room Type Distribution
Property Type Distribution
Market Composition Insights for Palm Springs
- The Palm Springs Airbnb market composition is heavily skewed towards Entire Home/Apt listings, which make up 93.8% of the 3,441 active rentals. This indicates strong guest preference for privacy and space.
- Looking at the property type distribution in Palm Springs, House properties are the most common (70.7%), reflecting the local real estate landscape.
- Houses represent a significant 70.7% portion, catering likely to families or larger groups.
- The presence of 5.5% Hotel/Boutique listings indicates integration with traditional hospitality.
- Smaller segments like others, outdoor/unique (combined 1.2%) offer potential for unique stay experiences.
Palm Springs Airbnb Room Capacity Analysis (2026): Bedroom Distribution
Distribution of Listings by Number of Bedrooms
Room Capacity Insights for Palm Springs
- The dominant room capacity in Palm Springs is 3 bedrooms listings, making up 36.9% of the market. This suggests a strong demand for properties suitable for families or small groups.
- Together, 3 bedrooms and 2 bedrooms properties represent 56.4% of the active Airbnb listings in Palm Springs, indicating a high concentration in these sizes.
- A significant 60.3% of listings offer 3+ bedrooms, catering to larger groups and families seeking more space in Palm Springs.
Palm Springs Vacation Rental Guest Capacity Trends (2026)
Distribution of Listings by Guest Capacity
Guest Capacity Insights for Palm Springs
- The most common guest capacity trend in Palm Springs vacation rentals is listings accommodating 6 guests (37.5%). This suggests the primary traveler segment is likely larger groups.
- Properties designed for 6 guests and 8+ guests dominate the Palm Springs STR market, accounting for 62.7% of listings.
- 63.3% of properties accommodate 6+ guests, serving the market segment for larger families or group travel in Palm Springs.
- On average, properties in Palm Springs are equipped to host 5.5 guests.
Palm Springs Airbnb Booking Patterns (2026): Available vs. Booked Days
Available Days Distribution
Booked Days Distribution
Booking Pattern Insights for Palm Springs
- The most common availability pattern in Palm Springs falls within the 271-366 days range, representing 48.1% of listings. This suggests many properties have significant open periods on their calendars.
- Approximately 83.1% of listings show high availability (181+ days open annually), indicating potential for increased bookings or specific owner usage patterns.
- For booked days, the 91-180 days range is most frequent in Palm Springs (35.5%), reflecting common guest stay durations or potential owner blocking patterns.
- A notable 18.0% of properties secure long booking periods (181+ days booked per year), highlighting successful long-term rental strategies or significant owner usage.
Palm Springs Airbnb Minimum Stay Requirements Analysis
Distribution of Listings by Minimum Night Requirement
1 Night
197 listings
5.7% of total
2 Nights
425 listings
12.4% of total
3 Nights
475 listings
13.8% of total
4-6 Nights
270 listings
7.9% of total
7-29 Nights
539 listings
15.7% of total
30+ Nights
1533 listings
44.6% of total
Key Insights
- The most prevalent minimum stay requirement in Palm Springs is 30+ Nights, adopted by 44.6% of listings. This highlights the market's preference for longer commitments.
- Very short stays (1-2 nights) are less common (18.1%), suggesting hosts prefer slightly longer bookings to optimize turnover.
- A significant segment (44.6%) caters to monthly stays (30+ nights) in Palm Springs, pointing to opportunities in the extended-stay market.
Recommendations
- Align with the market by considering a 30+ Nights minimum stay, as 44.6% of Palm Springs hosts use this setting.
- If feasible, allowing 1-night stays, especially midweek or during low season, could capture last-minute bookings, as only 5.7% currently do.
- Explore offering discounts for stays of 30+ nights to attract the 44.6% of the market seeking extended stays.
- Adjust minimum nights based on seasonality – potentially shorter during low season and longer during peak demand periods in Palm Springs.
Palm Springs Airbnb Cancellation Policy Trends Analysis (2026)
Non-refundable
2 listings
0.1% of total
Refundable
2 listings
0.1% of total
Super Strict 60 Days
238 listings
6.9% of total
Super Strict 30 Days
177 listings
5.2% of total
Limited
95 listings
2.8% of total
Flexible
226 listings
6.6% of total
Moderate
633 listings
18.5% of total
Firm
1454 listings
42.4% of total
Strict
599 listings
17.5% of total
Cancellation Policy Insights for Palm Springs
- The prevailing Airbnb cancellation policy trend in Palm Springs is Firm, used by 42.4% of listings.
- A majority (59.9%) of hosts in Palm Springs utilize Firm or Strict policies, indicating a market where hosts prioritize booking security.
Recommendations for Hosts
- Consider adopting a Firm policy to align with the 42.4% market standard in Palm Springs.
- Regularly review your cancellation policy against competitors and market demand shifts in Palm Springs.
Palm Springs STR Booking Lead Time Analysis (2026)
Average Booking Lead Time by Month
Booking Lead Time Insights for Palm Springs
- The overall average booking lead time for vacation rentals in Palm Springs is 69 days.
- Guests book furthest in advance for stays during March (average 97 days), likely coinciding with peak travel demand or local events.
- The shortest booking windows occur for stays in July (average 33 days), indicating more last-minute travel plans during this time.
- Seasonally, Winter (81 days avg.) sees the longest lead times, while Summer (37 days avg.) has the shortest, reflecting typical travel planning cycles.
Recommendations for Hosts
- Use the overall average lead time (69 days) as a baseline for your pricing and availability strategy in Palm Springs.
- For March stays, consider implementing length-of-stay discounts or slightly higher rates for bookings made less than 97 days out to capitalize on advance planning.
- Target marketing efforts for the Winter season well in advance (at least 81 days) to capture early planners.
- Monitor your own booking lead times against these Palm Springs averages to identify opportunities for dynamic pricing adjustments.
Popular & Essential Airbnb Amenities in Palm Springs (2026)
Amenity Prevalence
Amenity Insights for Palm Springs
- Essential amenities in Palm Springs that guests expect include: Wifi, Air conditioning, Smoke alarm, TV, Free parking on premises, Pool, Heating, Carbon monoxide alarm. Lacking these (any) could significantly impact bookings.
- Popular amenities like Kitchen, Fire extinguisher are common but not universal. Offering these can provide a competitive edge.
Recommendations for Hosts
- Ensure your listing includes all essential amenities for Palm Springs: Wifi, Air conditioning, Smoke alarm, TV, Free parking on premises, Pool, Heating, Carbon monoxide alarm.
- Prioritize adding missing essentials: Wifi, Air conditioning, Smoke alarm, TV, Free parking on premises, Pool, Heating, Carbon monoxide alarm.
- Consider adding popular differentiators like Kitchen or Fire extinguisher to increase appeal.
- Highlight unique or less common amenities you offer (e.g., hot tub, dedicated workspace, EV charger) in your listing description and photos.
- Regularly check competitor amenities in Palm Springs to stay competitive.
Palm Springs Airbnb Guest Demographics & Profile Analysis (2026)
Guest Profile Summary for Palm Springs
- The typical guest profile for Airbnb in Palm Springs consists of primarily domestic travelers (91%), often arriving from nearby Los Angeles, typically belonging to the Post-2000s (Gen Z/Alpha) group (50%), primarily speaking English or Spanish.
- Domestic travelers account for 90.9% of guests.
- Key international markets include United States (90.9%) and Canada (4.4%).
- Top languages spoken are English (64.9%) followed by Spanish (16.2%).
- A significant demographic segment is the Post-2000s (Gen Z/Alpha) group, representing 50% of guests.
Recommendations for Hosts
- Target domestic marketing efforts towards travelers from Los Angeles and San Diego.
- Tailor amenities and listing descriptions to appeal to the dominant Post-2000s (Gen Z/Alpha) demographic (e.g., highlight fast WiFi, smart home features, local guides).
- Highlight unique local experiences or amenities relevant to the primary guest profile.
- Consider seasonal promotions aligned with peak travel times for key origin markets.
Nearby Short-Term Rental Market Comparison
How does the Palm Springs Airbnb market stack up against its neighbors? Compare key performance metrics like average monthly revenue, ADR, and occupancy rates in surrounding areas to understand the broader regional STR landscape.
| Market | Active Properties | Monthly Revenue | Daily Rate | Avg. Occupancy |
|---|---|---|---|---|
| Newport Beach | 1,273 | $8,950 | $744.06 | 47% |
| Rancho San Diego | 25 | $8,649 | $568.72 | 48% |
| Thousand Palms | 33 | $8,119 | $725.48 | 36% |
| Lakeside | 33 | $7,537 | $604.33 | 44% |
| GlenOak Hills | 41 | $7,394 | $648.65 | 41% |
| Bermuda Dunes | 143 | $7,324 | $664.90 | 39% |
| Mount Helix | 33 | $7,163 | $594.94 | 50% |
| Del Mar | 128 | $7,011 | $671.56 | 45% |
| Rancho Santa Fe | 34 | $6,074 | $913.16 | 35% |
| Encinitas | 559 | $5,940 | $543.93 | 49% |