Oceano Airbnb Market Analysis 2026: Short Term Rental Data & Vacation Rental Statistics in California, United States
Is Airbnb profitable in Oceano in 2026? Explore comprehensive Airbnb analytics for Oceano, California, United States to uncover income potential. This 2026 STR market report for Oceano, based on AirROI data from February 2025 to January 2026, reveals key trends in the niche market of 184 active listings.
Whether you're considering an Airbnb investment in Oceano, optimizing your existing vacation rental, or exploring rental arbitrage opportunities, understanding the Oceano Airbnb data is crucial. Understanding the local regulations is key to maximizing your short term rental income potential. Let's dive into the specifics.
Key Oceano Airbnb Performance Metrics Overview
Monthly Airbnb Revenue Variations & Income Potential in Oceano (2026)
Understanding the monthly revenue variations for Airbnb listings in Oceano is key to maximizing your short term rental income potential. Seasonality significantly impacts earnings. Our analysis, based on data from the past 12 months, shows that the peak revenue month for STRs in Oceano is typically July, while February often presents the lowest earnings, highlighting opportunities for strategic pricing adjustments during shoulder and low seasons. Explore the typical Airbnb income in Oceano across different performance tiers:
- Best-in-class properties (Top 10%) achieve $11,347+ monthly, often utilizing dynamic pricing and superior guest experiences.
- Strong performing properties (Top 25%) earn $6,882 or more, indicating effective management and desirable locations/amenities.
- Typical properties (Median) generate around $3,663 per month, representing the average market performance.
- Entry-level properties (Bottom 25%) see earnings around $1,741, often with potential for optimization.
Average Monthly Airbnb Earnings Trend in Oceano
Oceano Airbnb Occupancy Rate Trends (2026)
Maximize your bookings by understanding the Oceano STR occupancy trends. Seasonal demand shifts significantly influence how often properties are booked. Typically, Julysees the highest demand (peak season occupancy), while January experiences the lowest (low season). Effective strategies, like adjusting minimum stays or offering promotions, can boost occupancy during slower periods. Here's how different property tiers perform in Oceano:
- Best-in-class properties (Top 10%) achieve 82%+ occupancy, indicating high desirability and potentially optimized availability.
- Strong performing properties (Top 25%) maintain 61% or higher occupancy, suggesting good market fit and guest satisfaction.
- Typical properties (Median) have an occupancy rate around 40%.
- Entry-level properties (Bottom 25%) average 22% occupancy, potentially facing higher vacancy.
Average Monthly Occupancy Rate Trend in Oceano
Average Daily Rate (ADR) Airbnb Trends in Oceano (2026)
Effective short term rental pricing strategy in Oceano involves understanding monthly ADR fluctuations. The Average Daily Rate (ADR) for Airbnb in Oceano typically peaks in June and dips lowest during February. Leveraging Airbnb dynamic pricing tools or strategies based on this seasonality can significantly boost revenue. Here's a look at the typical nightly rates achieved:
- Best-in-class properties (Top 10%) command rates of $744+ per night, often due to premium features or locations.
- Strong performing properties (Top 25%) achieve nightly rates of $464 or more.
- Typical properties (Median) charge around $219 per night.
- Entry-level properties (Bottom 25%) earn around $157 per night.
Average Daily Rate (ADR) Trend by Month in Oceano
Get Live Oceano Market Intelligence 👇

Explore Real-time Analytics
Airbnb Seasonality Analysis & Trends in Oceano (2026)
Peak Season (July, June, August)
- Revenue averages $7,051 per month
- Occupancy rates average 51.1%
- Daily rates average $364
Shoulder Season
- Revenue averages $4,886 per month
- Occupancy maintains around 40.4%
- Daily rates hold near $342
Low Season (January, February, March)
- Revenue drops to average $3,400 per month
- Occupancy decreases to average 40.1%
- Daily rates adjust to average $307
Seasonality Insights for Oceano
- The Airbnb seasonality in Oceano shows highly seasonal trends requiring careful strategy. While the sections above show seasonal averages, it's also insightful to look at the extremes:
- During the high season, the absolute peak month showcases Oceano's highest earning potential, with monthly revenues capable of climbing to $8,176, occupancy reaching a high of 56.1%, and ADRs peaking at $376.
- Conversely, the slowest single month of the year, typically falling within the low season, marks the market's lowest point. In this month, revenue might dip to $2,908, occupancy could drop to 31.1%, and ADRs may adjust down to $279.
- Understanding both the seasonal averages and these monthly peaks and troughs in revenue, occupancy, and ADR is crucial for maximizing your Airbnb profit potential in Oceano.
Seasonal Strategies for Maximizing Profit
- Peak Season: Maximize revenue through premium pricing and potentially longer minimum stays. Ensure high availability.
- Low Season: Offer competitive pricing, special promotions (e.g., extended stay discounts), and flexible cancellation policies. Target off-season travelers like remote workers or budget-conscious guests.
- Shoulder Seasons: Implement dynamic pricing that balances peak and low rates. Target weekend travelers or specific events. Offer slightly more flexible terms than peak season.
- Regularly analyze your own performance against these Oceano seasonality benchmarks and adjust your pricing and availability strategy accordingly.
Best Areas for Airbnb Investment in Oceano (2026)
Exploring the top neighborhoods for short-term rentals in Oceano? This section highlights key areas, outlining why they are attractive for hosts and guests, along with notable local attractions. Consider these locations based on your target guest profile and investment strategy.
| Neighborhood / Area | Why Host Here? (Target Guests & Appeal) | Key Attractions & Landmarks |
|---|---|---|
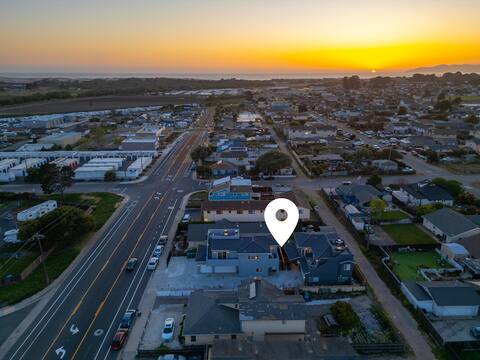
| Oceano Dunes | An iconic beach destination known for its sand dunes and stunning coastline. Popular among outdoor enthusiasts and families who enjoy beach activities, off-roading, and camping. | Oceano Dunes State Park, Butterfly Grove Sanctuary, Pismo Beach Pier, Oceano Lagoon, Pacific Coast Highway |
| Pismo Beach | A picturesque beach town just north of Oceano, famous for its surf spots and clam chowder. It's a hub for tourists looking to enjoy beautiful sunsets and beachside activities. | Pismo Beach Pier, Monarch Butterfly Grove, Dinosaur Caves Park, Pismo Beach Premium Outlets, Oceano Dunes |
| Shell Beach | An upscale coastal neighborhood known for its tranquil beaches and stunning ocean views. Attracts vacationers seeking a more peaceful retreat with upscale dining options. | Shell Beach, Pirates Cove Beach, Pismo Lighthouse Suite, Ocean Views, Local wineries |
| Avila Beach | A charming coastal village with warm weather, known for its family-friendly atmosphere and beautiful beaches. Ideal for families and those looking for relaxation by the sea. | Avila Beach, Avila Valley Barn, Bob Jones City to Sea Trail, Avila Hot Springs, Point Sal State Park |
| Grover Beach | A vibrant beach community offering a more laid-back vibe, popular for its wide sandy beaches and community events. Great for budget travelers and families. | Grover Beach, Pismo State Beach, Dunes Center, Minturn Hike, Narrow Gauge Railroad Trail |
| North Beach | The northern section of Pismo Beach, known for its natural beauty and spacious beaches. Attracts both tourists and locals for picnics and beach sports. | North Beach Campground, Pismo Beach North, Pismo State Beach Boardwalk, California Coast Trail, Sand dunes |
| California State Route 1 | One of the most scenic drives in the United States, perfect for tourists looking to explore the beautiful coastal landscape. Ideal for road trip enthusiasts and nature lovers. | Scenic ocean views, Hearst Castle nearby, Elephant Seal Rookery, Big Sur coast access, Multiple beach access points |
| Pismo Preserve | A natural area offering trails and stunning coastal views, ideal for outdoor activities like hiking and birdwatching. Attracts nature lovers and active vacationers. | Pismo Preserve Trails, Ocean views, Wildlife observation, Nature center, Hiking trails |
Understanding Airbnb License Requirements & STR Laws in Oceano (2026)
With 20% of listings showing registration in 2026, understanding potential Airbnb license requirements is crucial in Oceano. Always verify the latest short term rental regulations and Airbnb license requirements directly with local government authorities for Oceano to ensure full compliance before hosting.
(Source: AirROI data, 2026, based on 20% licensed listings)
Top Performing Airbnb Properties in Oceano (2026)
Benchmark your potential! Explore examples of top-performing Airbnb properties in Oceanobased on Trailing Twelve Month (TTM) revenue. Analyze their characteristics, revenue, occupancy rate, and ADR to understand what drives success in this market.

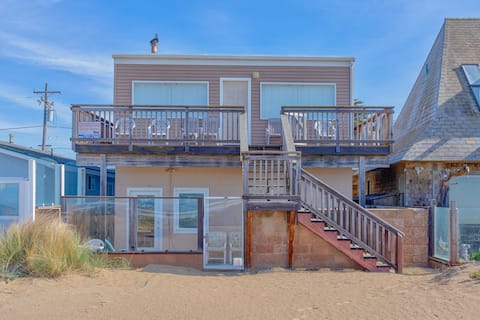
Strandcastle Beach House 2.0 - Oceanfront!
Entire Place • 4 bedrooms
1432 Strand Way
Entire Place • 5 bedrooms
Sleeps 22! Two Houses! Game Rooms!
Entire Place • 6 bedrooms
Happy Clam Castle 5BD/3.5BA Oceanfront
Entire Place • 5 bedrooms

Strandcastle Beach House - Oceanfront!
Entire Place • 4 bedrooms

Between the Dunes: Breezy Beachfront Oceano Home!
Entire Place • 4 bedrooms
Note: Performance varies based on location, size, amenities, seasonality, and management quality. Data reflects the past 12 months.
Top Performing Airbnb Hosts in Oceano (2026)
Learn from the best! This table showcases top-performing Airbnb hosts in Oceano based on the number of properties managed and estimated total revenue over the past year. Analyze their scale and performance metrics.
| Host Name | Properties | Grossing Revenue | Stay Reviews | Avg Rating |
|---|---|---|---|---|
| Beach Bum Holiday Rentals | 16 | $1,051,732 | 438 | 4.67/5.0 |
| Amber | 10 | $683,870 | 5347 | 4.90/5.0 |
| Mauri | 3 | $558,909 | 203 | 4.96/5.0 |
| Chad & Melissa | 3 | $395,389 | 75 | 4.95/5.0 |
| Terri | 28 | $388,711 | 288 | 4.66/5.0 |
| Coastal Vacation | 17 | $374,506 | 140 | 4.74/5.0 |
| Sal & Eva | 2 | $292,990 | 225 | 4.74/5.0 |
| Evolve | 3 | $248,985 | 83 | 4.76/5.0 |
| David | 6 | $239,557 | 1255 | 4.82/5.0 |
| Joy | 1 | $157,834 | 61 | 4.95/5.0 |
Analyzing the strategies of top hosts, such as their property selection, pricing, and guest communication, can offer valuable lessons for optimizing your own Airbnb operations in Oceano.
Dive Deeper: Advanced Oceano STR Market Data (2026)
Ready to unlock more insights? AirROI provides access to advanced metrics and comprehensive Airbnb data for Oceano. Explore detailed analytics beyond this report to refine your investment strategy, optimize pricing, and maximize your vacation rental profits.
Explore Advanced MetricsOceano Short-Term Rental Market Composition (2026): Property & Room Types
Room Type Distribution
Property Type Distribution
Market Composition Insights for Oceano
- The Oceano Airbnb market composition is heavily skewed towards Entire Home/Apt listings, which make up 98.9% of the 184 active rentals. This indicates strong guest preference for privacy and space.
- Looking at the property type distribution in Oceano, House properties are the most common (48.4%), reflecting the local real estate landscape.
- Houses represent a significant 48.4% portion, catering likely to families or larger groups.
- Smaller segments like hotel/boutique, outdoor/unique, others (combined 4.9%) offer potential for unique stay experiences.
Oceano Airbnb Room Capacity Analysis (2026): Bedroom Distribution
Distribution of Listings by Number of Bedrooms
Room Capacity Insights for Oceano
- The dominant room capacity in Oceano is 1 bedroom listings, making up 48.4% of the market. This suggests a strong demand for properties suitable for couples or solo travelers.
- Together, 1 bedroom and 3 bedrooms properties represent 65.2% of the active Airbnb listings in Oceano, indicating a high concentration in these sizes.
- A significant 30.9% of listings offer 3+ bedrooms, catering to larger groups and families seeking more space in Oceano.
Oceano Vacation Rental Guest Capacity Trends (2026)
Distribution of Listings by Guest Capacity
Guest Capacity Insights for Oceano
- The most common guest capacity trend in Oceano vacation rentals is listings accommodating 4 guests (35.3%). This suggests the primary traveler segment is likely small families or groups.
- Properties designed for 4 guests and 8+ guests dominate the Oceano STR market, accounting for 65.7% of listings.
- 44.6% of properties accommodate 6+ guests, serving the market segment for larger families or group travel in Oceano.
- On average, properties in Oceano are equipped to host 5.2 guests.
Oceano Airbnb Booking Patterns (2026): Available vs. Booked Days
Available Days Distribution
Booked Days Distribution
Booking Pattern Insights for Oceano
- The most common availability pattern in Oceano falls within the 271-366 days range, representing 51.1% of listings. This suggests many properties have significant open periods on their calendars.
- Approximately 79.4% of listings show high availability (181+ days open annually), indicating potential for increased bookings or specific owner usage patterns.
- For booked days, the 31-90 days range is most frequent in Oceano (37%), reflecting common guest stay durations or potential owner blocking patterns.
- A notable 22.3% of properties secure long booking periods (181+ days booked per year), highlighting successful long-term rental strategies or significant owner usage.
Oceano Airbnb Minimum Stay Requirements Analysis
Distribution of Listings by Minimum Night Requirement
1 Night
48 listings
26.1% of total
2 Nights
48 listings
26.1% of total
3 Nights
1 listings
0.5% of total
4-6 Nights
2 listings
1.1% of total
7-29 Nights
3 listings
1.6% of total
30+ Nights
82 listings
44.6% of total
Key Insights
- The most prevalent minimum stay requirement in Oceano is 30+ Nights, adopted by 44.6% of listings. This highlights the market's preference for longer commitments.
- A significant segment (44.6%) caters to monthly stays (30+ nights) in Oceano, pointing to opportunities in the extended-stay market.
Recommendations
- Align with the market by considering a 30+ Nights minimum stay, as 44.6% of Oceano hosts use this setting.
- If feasible, allowing 1-night stays, especially midweek or during low season, could capture last-minute bookings, as only 26.1% currently do.
- Explore offering discounts for stays of 30+ nights to attract the 44.6% of the market seeking extended stays.
- Adjust minimum nights based on seasonality – potentially shorter during low season and longer during peak demand periods in Oceano.
Oceano Airbnb Cancellation Policy Trends Analysis (2026)
Super Strict 30 Days
3 listings
1.6% of total
Flexible
66 listings
36.1% of total
Moderate
22 listings
12% of total
Firm
62 listings
33.9% of total
Strict
30 listings
16.4% of total
Cancellation Policy Insights for Oceano
- The prevailing Airbnb cancellation policy trend in Oceano is Flexible, used by 36.1% of listings.
- A majority (50.3%) of hosts in Oceano utilize Firm or Strict policies, indicating a market where hosts prioritize booking security.
Recommendations for Hosts
- Consider adopting a Flexible policy to align with the 36.1% market standard in Oceano.
- Regularly review your cancellation policy against competitors and market demand shifts in Oceano.
Oceano STR Booking Lead Time Analysis (2026)
Average Booking Lead Time by Month
Booking Lead Time Insights for Oceano
- The overall average booking lead time for vacation rentals in Oceano is 40 days.
- Guests book furthest in advance for stays during June (average 61 days), likely coinciding with peak travel demand or local events.
- The shortest booking windows occur for stays in February (average 25 days), indicating more last-minute travel plans during this time.
- Seasonally, Summer (54 days avg.) sees the longest lead times, while Spring (31 days avg.) has the shortest, reflecting typical travel planning cycles.
Recommendations for Hosts
- Use the overall average lead time (40 days) as a baseline for your pricing and availability strategy in Oceano.
- For June stays, consider implementing length-of-stay discounts or slightly higher rates for bookings made less than 61 days out to capitalize on advance planning.
- Target marketing efforts for the Summer season well in advance (at least 54 days) to capture early planners.
- Monitor your own booking lead times against these Oceano averages to identify opportunities for dynamic pricing adjustments.
Popular & Essential Airbnb Amenities in Oceano (2026)
Amenity Prevalence
Amenity Insights for Oceano
- Essential amenities in Oceano that guests expect include: Wifi, Carbon monoxide alarm, Smoke alarm, TV, Microwave, Refrigerator, Heating. Lacking these (any) could significantly impact bookings.
- Popular amenities like Essentials, Dishes and silverware, Coffee maker are common but not universal. Offering these can provide a competitive edge.
Recommendations for Hosts
- Ensure your listing includes all essential amenities for Oceano: Wifi, Carbon monoxide alarm, Smoke alarm, TV, Microwave, Refrigerator, Heating.
- Prioritize adding missing essentials: Wifi, Carbon monoxide alarm, Smoke alarm, TV, Microwave, Refrigerator, Heating.
- Consider adding popular differentiators like Essentials or Dishes and silverware to increase appeal.
- Highlight unique or less common amenities you offer (e.g., hot tub, dedicated workspace, EV charger) in your listing description and photos.
- Regularly check competitor amenities in Oceano to stay competitive.
Oceano Airbnb Guest Demographics & Profile Analysis (2026)
Guest Profile Summary for Oceano
- The typical guest profile for Airbnb in Oceano consists of primarily domestic travelers (96%), often arriving from nearby Fresno, typically belonging to the Post-2000s (Gen Z/Alpha) group (50%), primarily speaking English or Spanish.
- Domestic travelers account for 95.5% of guests.
- Key international markets include United States (95.5%) and Germany (0.7%).
- Top languages spoken are English (66.9%) followed by Spanish (16.6%).
- A significant demographic segment is the Post-2000s (Gen Z/Alpha) group, representing 50% of guests.
Recommendations for Hosts
- Target domestic marketing efforts towards travelers from Fresno and Los Angeles.
- Tailor amenities and listing descriptions to appeal to the dominant Post-2000s (Gen Z/Alpha) demographic (e.g., highlight fast WiFi, smart home features, local guides).
- Highlight unique local experiences or amenities relevant to the primary guest profile.
- Consider seasonal promotions aligned with peak travel times for key origin markets.
Nearby Short-Term Rental Market Comparison
How does the Oceano Airbnb market stack up against its neighbors? Compare key performance metrics like average monthly revenue, ADR, and occupancy rates in surrounding areas to understand the broader regional STR landscape.
| Market | Active Properties | Monthly Revenue | Daily Rate | Avg. Occupancy |
|---|---|---|---|---|
| Carmel Point | 15 | $14,483 | $1046.17 | 54% |
| Montecito | 127 | $10,744 | $950.35 | 51% |
| Del Monte Forest | 105 | $10,280 | $964.89 | 47% |
| Carmel-by-the-Sea | 305 | $8,657 | $680.02 | 49% |
| Pleasure Point | 90 | $7,920 | $525.95 | 52% |
| Carmel | 29 | $7,901 | $597.00 | 49% |
| Castroville | 16 | $7,830 | $558.55 | 50% |
| Sand City | 10 | $7,391 | $497.43 | 60% |
| Del Rey Oaks | 33 | $7,281 | $474.67 | 54% |
| Los Olivos | 30 | $7,240 | $705.20 | 43% |