Murrieta Airbnb Market Analysis 2026: Short Term Rental Data & Vacation Rental Statistics in California, United States
Is Airbnb profitable in Murrieta in 2026? Explore comprehensive Airbnb analytics for Murrieta, California, United States to uncover income potential. This 2026 STR market report for Murrieta, based on AirROI data from February 2025 to January 2026, reveals key trends in the niche market of 131 active listings.
Whether you're considering an Airbnb investment in Murrieta, optimizing your existing vacation rental, or exploring rental arbitrage opportunities, understanding the Murrieta Airbnb data is crucial. Leveraging the low regulation environment is key to maximizing your short term rental income potential. Let's dive into the specifics.
Key Murrieta Airbnb Performance Metrics Overview
Monthly Airbnb Revenue Variations & Income Potential in Murrieta (2026)
Understanding the monthly revenue variations for Airbnb listings in Murrieta is key to maximizing your short term rental income potential. Seasonality significantly impacts earnings. Our analysis, based on data from the past 12 months, shows that the peak revenue month for STRs in Murrieta is typically June, while February often presents the lowest earnings, highlighting opportunities for strategic pricing adjustments during shoulder and low seasons. Explore the typical Airbnb income in Murrieta across different performance tiers:
- Best-in-class properties (Top 10%) achieve $13,234+ monthly, often utilizing dynamic pricing and superior guest experiences.
- Strong performing properties (Top 25%) earn $6,776 or more, indicating effective management and desirable locations/amenities.
- Typical properties (Median) generate around $3,090 per month, representing the average market performance.
- Entry-level properties (Bottom 25%) see earnings around $1,079, often with potential for optimization.
Average Monthly Airbnb Earnings Trend in Murrieta
Murrieta Airbnb Occupancy Rate Trends (2026)
Maximize your bookings by understanding the Murrieta STR occupancy trends. Seasonal demand shifts significantly influence how often properties are booked. Typically, Junesees the highest demand (peak season occupancy), while January experiences the lowest (low season). Effective strategies, like adjusting minimum stays or offering promotions, can boost occupancy during slower periods. Here's how different property tiers perform in Murrieta:
- Best-in-class properties (Top 10%) achieve 73%+ occupancy, indicating high desirability and potentially optimized availability.
- Strong performing properties (Top 25%) maintain 59% or higher occupancy, suggesting good market fit and guest satisfaction.
- Typical properties (Median) have an occupancy rate around 40%.
- Entry-level properties (Bottom 25%) average 21% occupancy, potentially facing higher vacancy.
Average Monthly Occupancy Rate Trend in Murrieta
Average Daily Rate (ADR) Airbnb Trends in Murrieta (2026)
Effective short term rental pricing strategy in Murrieta involves understanding monthly ADR fluctuations. The Average Daily Rate (ADR) for Airbnb in Murrieta typically peaks in June and dips lowest during February. Leveraging Airbnb dynamic pricing tools or strategies based on this seasonality can significantly boost revenue. Here's a look at the typical nightly rates achieved:
- Best-in-class properties (Top 10%) command rates of $799+ per night, often due to premium features or locations.
- Strong performing properties (Top 25%) achieve nightly rates of $418 or more.
- Typical properties (Median) charge around $188 per night.
- Entry-level properties (Bottom 25%) earn around $89 per night.
Average Daily Rate (ADR) Trend by Month in Murrieta
Get Live Murrieta Market Intelligence 👇

Explore Real-time Analytics
Airbnb Seasonality Analysis & Trends in Murrieta (2026)
Peak Season (June, July, May)
- Revenue averages $6,598 per month
- Occupancy rates average 42.5%
- Daily rates average $343
Shoulder Season
- Revenue averages $5,582 per month
- Occupancy maintains around 40.6%
- Daily rates hold near $327
Low Season (February, March, September)
- Revenue drops to average $4,395 per month
- Occupancy decreases to average 40.8%
- Daily rates adjust to average $305
Seasonality Insights for Murrieta
- The Airbnb seasonality in Murrieta shows moderate seasonality with distinct peak and low periods. While the sections above show seasonal averages, it's also insightful to look at the extremes:
- During the high season, the absolute peak month showcases Murrieta's highest earning potential, with monthly revenues capable of climbing to $6,813, occupancy reaching a high of 45.4%, and ADRs peaking at $350.
- Conversely, the slowest single month of the year, typically falling within the low season, marks the market's lowest point. In this month, revenue might dip to $3,611, occupancy could drop to 35.0%, and ADRs may adjust down to $289.
- Understanding both the seasonal averages and these monthly peaks and troughs in revenue, occupancy, and ADR is crucial for maximizing your Airbnb profit potential in Murrieta.
Seasonal Strategies for Maximizing Profit
- Peak Season: Maximize revenue through premium pricing and potentially longer minimum stays. Ensure high availability.
- Low Season: Offer competitive pricing, special promotions (e.g., extended stay discounts), and flexible cancellation policies. Target off-season travelers like remote workers or budget-conscious guests.
- Shoulder Seasons: Implement dynamic pricing that balances peak and low rates. Target weekend travelers or specific events. Offer slightly more flexible terms than peak season.
- Regularly analyze your own performance against these Murrieta seasonality benchmarks and adjust your pricing and availability strategy accordingly.
Best Areas for Airbnb Investment in Murrieta (2026)
Exploring the top neighborhoods for short-term rentals in Murrieta? This section highlights key areas, outlining why they are attractive for hosts and guests, along with notable local attractions. Consider these locations based on your target guest profile and investment strategy.
| Neighborhood / Area | Why Host Here? (Target Guests & Appeal) | Key Attractions & Landmarks |
|---|---|---|
| Old Town Murrieta | Historic area with charming shops, restaurants, and a local vibe. Perfect for guests who appreciate a small-town atmosphere while still having access to modern amenities. | Murrieta Old Town Merchants, Murrieta Community Center, Murrieta Library, Murrieta Town Square, Local Parks |
| Murrieta Hot Springs | Known for its natural hot springs, this area attracts visitors looking for relaxation and wellness. Ideal for hosting wellness retreats and guests seeking a tranquil escape. | Murrieta Hot Springs Resort, Nature Trails, Nearby Spa Services, Temecula Wine Country |
| Greer Ranch | A serene, upscale community that offers beautiful views and a family-friendly environment. Great for longer-term stays and families looking for a quiet getaway. | Greer Ranch Park, Scenic Hiking Trails, Nearby Schools and Amenities |
| Rancho Bella Vista | A suburban neighborhood with modern homes and convenient access to shopping and dining. Excellent for guests who want family-friendly accommodations near local attractions. | Local Parks, Shopping Centers, Restaurants, Easy Access to Major Roads |
| Sun City | An adult community popular for its active lifestyle offerings and recreational activities. A good target for older travelers looking for a peaceful and engaging environment. | Sun City Library, Multiple Golf Courses, Clubhouses and Social Activities |
| California Oaks | A residential area known for its parks and schools, ideal for families traveling with children. Family-friendly atmosphere with plenty of outdoor activities. | California Oaks Sports Park, Murrieta Valley High School, Nearby Shopping |
| Copper Canyon | A scenic area with plenty of outdoor space and trails. Attracts nature lovers and hikers seeking a more rural experience close to Murrieta. | Copper Canyon Park, Trails for Hiking and Biking, Nature Preserves |
| Temeku Hills | Adjacent to Temecula, this area offers golf and luxury living. Great for guests interested in golfing and exploring the wine country nearby. | Temeku Hills Golf Course, Wine Country Tours, Local Dining Options |
Understanding Airbnb License Requirements & STR Laws in Murrieta (2026)
While Murrieta, California, United States currently shows low STR regulations, specific Airbnb license requirements might still exist or change. Always verify the latest short term rental regulations and Airbnb license requirements directly with local government authorities for Murrieta to ensure full compliance before hosting.
(Source: AirROI data, 2026, finding no licensed listings among those analyzed)
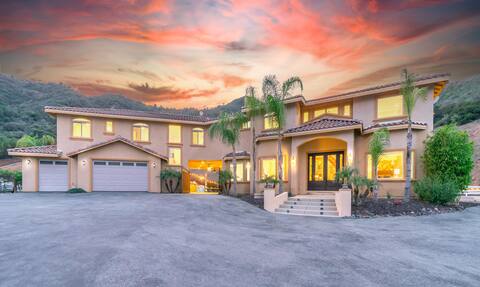
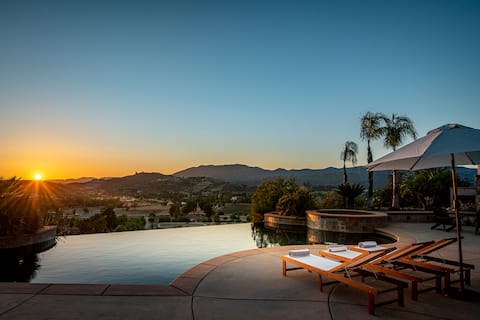
Top Performing Airbnb Properties in Murrieta (2026)
Benchmark your potential! Explore examples of top-performing Airbnb properties in Murrietabased on Trailing Twelve Month (TTM) revenue. Analyze their characteristics, revenue, occupancy rate, and ADR to understand what drives success in this market.
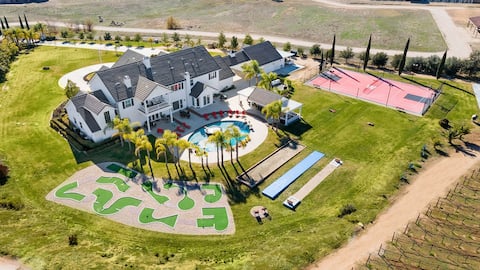
New Luxury Celebrity Vineyard Estate Temecula
Entire Place • 8 bedrooms

Colina by AvantStay | Mountaintop Oasis w/ Pool
Entire Place • 6 bedrooms
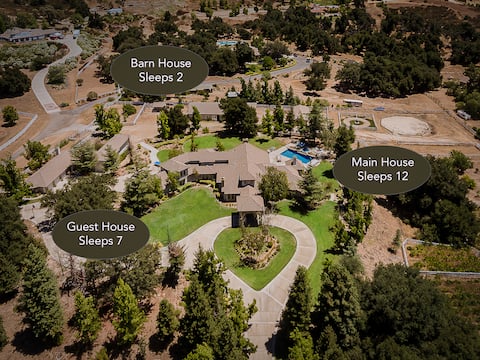
The Oaktree Estate by Fieldtrip | 7 Acre Resort
Entire Place • 10 bedrooms
Casa Vinedo Estate, 8 Bedroom, Pool/HotTub, Events
Entire Place • 8 bedrooms
Vineyard View by Fieldtrip | 8 Bd w Infinity Pool
Entire Place • 8 bedrooms
Barona View Villa
Entire Place • 6 bedrooms
Note: Performance varies based on location, size, amenities, seasonality, and management quality. Data reflects the past 12 months.
Top Performing Airbnb Hosts in Murrieta (2026)
Learn from the best! This table showcases top-performing Airbnb hosts in Murrieta based on the number of properties managed and estimated total revenue over the past year. Analyze their scale and performance metrics.
| Host Name | Properties | Grossing Revenue | Stay Reviews | Avg Rating |
|---|---|---|---|---|
| Fieldtrip | 2 | $641,057 | 164 | 4.85/5.0 |
| Casa Vinedo | 3 | $570,773 | 183 | 4.77/5.0 |
| Resort Style Vacation Homes | 1 | $462,870 | 107 | 4.98/5.0 |
| AvantStay Temecula | 2 | $441,069 | 141 | 4.84/5.0 |
| Karey | 2 | $202,300 | 94 | 4.97/5.0 |
| Sarah | 1 | $169,070 | 37 | 4.97/5.0 |
| Carlos | 2 | $154,519 | 128 | 4.93/5.0 |
| Tonya | 1 | $149,685 | 66 | 4.92/5.0 |
| SunnyDays | 1 | $146,047 | 29 | 4.59/5.0 |
| Kena | 1 | $128,144 | 106 | 4.92/5.0 |
Analyzing the strategies of top hosts, such as their property selection, pricing, and guest communication, can offer valuable lessons for optimizing your own Airbnb operations in Murrieta.
Dive Deeper: Advanced Murrieta STR Market Data (2026)
Ready to unlock more insights? AirROI provides access to advanced metrics and comprehensive Airbnb data for Murrieta. Explore detailed analytics beyond this report to refine your investment strategy, optimize pricing, and maximize your vacation rental profits.
Explore Advanced MetricsMurrieta Short-Term Rental Market Composition (2026): Property & Room Types
Room Type Distribution
Property Type Distribution
Market Composition Insights for Murrieta
- The Murrieta Airbnb market composition is heavily skewed towards Entire Home/Apt listings, which make up 71% of the 131 active rentals. This indicates strong guest preference for privacy and space.
- Looking at the property type distribution in Murrieta, House properties are the most common (80.9%), reflecting the local real estate landscape.
- Houses represent a significant 80.9% portion, catering likely to families or larger groups.
- The presence of 9.2% Hotel/Boutique listings indicates integration with traditional hospitality.
- Smaller segments like apartment/condo, others, outdoor/unique, unique stays (combined 9.9%) offer potential for unique stay experiences.
Murrieta Airbnb Room Capacity Analysis (2026): Bedroom Distribution
Distribution of Listings by Number of Bedrooms
Room Capacity Insights for Murrieta
- The dominant room capacity in Murrieta is 5+ bedrooms listings, making up 25.2% of the market. This suggests a strong demand for properties suitable for families or small groups.
- Together, 5+ bedrooms and 1 bedroom properties represent 41.2% of the active Airbnb listings in Murrieta, indicating a high concentration in these sizes.
- A significant 52.7% of listings offer 3+ bedrooms, catering to larger groups and families seeking more space in Murrieta.
Murrieta Vacation Rental Guest Capacity Trends (2026)
Distribution of Listings by Guest Capacity
Guest Capacity Insights for Murrieta
- The most common guest capacity trend in Murrieta vacation rentals is listings accommodating 8+ guests (44.3%). This suggests the primary traveler segment is likely larger groups.
- Properties designed for 8+ guests and 2 guests dominate the Murrieta STR market, accounting for 55.8% of listings.
- 51.9% of properties accommodate 6+ guests, serving the market segment for larger families or group travel in Murrieta.
- On average, properties in Murrieta are equipped to host 4.7 guests.
Murrieta Airbnb Booking Patterns (2026): Available vs. Booked Days
Available Days Distribution
Booked Days Distribution
Booking Pattern Insights for Murrieta
- The most common availability pattern in Murrieta falls within the 271-366 days range, representing 42.7% of listings. This suggests many properties have significant open periods on their calendars.
- Approximately 77.8% of listings show high availability (181+ days open annually), indicating potential for increased bookings or specific owner usage patterns.
- For booked days, the 91-180 days range is most frequent in Murrieta (35.1%), reflecting common guest stay durations or potential owner blocking patterns.
- A notable 22.9% of properties secure long booking periods (181+ days booked per year), highlighting successful long-term rental strategies or significant owner usage.
Murrieta Airbnb Minimum Stay Requirements Analysis
Distribution of Listings by Minimum Night Requirement
1 Night
43 listings
32.8% of total
2 Nights
26 listings
19.8% of total
3 Nights
2 listings
1.5% of total
4-6 Nights
4 listings
3.1% of total
7-29 Nights
21 listings
16% of total
30+ Nights
35 listings
26.7% of total
Key Insights
- The most prevalent minimum stay requirement in Murrieta is 1 Night, adopted by 32.8% of listings. This highlights the market's preference for shorter, flexible bookings.
- A significant segment (26.7%) caters to monthly stays (30+ nights) in Murrieta, pointing to opportunities in the extended-stay market.
Recommendations
- Align with the market by considering a 1 Night minimum stay, as 32.8% of Murrieta hosts use this setting.
- Explore offering discounts for stays of 30+ nights to attract the 26.7% of the market seeking extended stays.
- Adjust minimum nights based on seasonality – potentially shorter during low season and longer during peak demand periods in Murrieta.
Murrieta Airbnb Cancellation Policy Trends Analysis (2026)
Super Strict 30 Days
5 listings
3.8% of total
Limited
1 listings
0.8% of total
Flexible
36 listings
27.5% of total
Moderate
33 listings
25.2% of total
Firm
41 listings
31.3% of total
Strict
15 listings
11.5% of total
Cancellation Policy Insights for Murrieta
- The prevailing Airbnb cancellation policy trend in Murrieta is Firm, used by 31.3% of listings.
- There's a relatively balanced mix between guest-friendly (52.7%) and stricter (42.8%) policies, offering choices for different guest needs.
Recommendations for Hosts
- Consider adopting a Firm policy to align with the 31.3% market standard in Murrieta.
- Using a Strict policy might deter some guests, as only 11.5% of listings use it. Evaluate if potential revenue protection outweighs possible lower booking rates.
- Regularly review your cancellation policy against competitors and market demand shifts in Murrieta.
Murrieta STR Booking Lead Time Analysis (2026)
Average Booking Lead Time by Month
Booking Lead Time Insights for Murrieta
- The overall average booking lead time for vacation rentals in Murrieta is 37 days.
- Guests book furthest in advance for stays during October (average 57 days), likely coinciding with peak travel demand or local events.
- The shortest booking windows occur for stays in February (average 23 days), indicating more last-minute travel plans during this time.
- Seasonally, Fall (52 days avg.) sees the longest lead times, while Winter (31 days avg.) has the shortest, reflecting typical travel planning cycles.
Recommendations for Hosts
- Use the overall average lead time (37 days) as a baseline for your pricing and availability strategy in Murrieta.
- For October stays, consider implementing length-of-stay discounts or slightly higher rates for bookings made less than 57 days out to capitalize on advance planning.
- Target marketing efforts for the Fall season well in advance (at least 52 days) to capture early planners.
- Monitor your own booking lead times against these Murrieta averages to identify opportunities for dynamic pricing adjustments.
Popular & Essential Airbnb Amenities in Murrieta (2026)
Amenity Prevalence
Amenity Insights for Murrieta
- Essential amenities in Murrieta that guests expect include: Wifi, Smoke alarm, Carbon monoxide alarm, Air conditioning. Lacking these (any) could significantly impact bookings.
- Popular amenities like Heating, Hot water, Hangers are common but not universal. Offering these can provide a competitive edge.
Recommendations for Hosts
- Ensure your listing includes all essential amenities for Murrieta: Wifi, Smoke alarm, Carbon monoxide alarm, Air conditioning.
- Prioritize adding missing essentials: Wifi, Smoke alarm, Carbon monoxide alarm, Air conditioning.
- Consider adding popular differentiators like Heating or Hot water to increase appeal.
- Highlight unique or less common amenities you offer (e.g., hot tub, dedicated workspace, EV charger) in your listing description and photos.
- Regularly check competitor amenities in Murrieta to stay competitive.
Murrieta Airbnb Guest Demographics & Profile Analysis (2026)
Guest Profile Summary for Murrieta
- The typical guest profile for Airbnb in Murrieta consists of primarily domestic travelers (95%), often arriving from nearby Los Angeles, typically belonging to the Post-2000s (Gen Z/Alpha) group (50%), primarily speaking English or Spanish.
- Domestic travelers account for 95.1% of guests.
- Key international markets include United States (95.1%) and Canada (1.2%).
- Top languages spoken are English (63.8%) followed by Spanish (19.6%).
- A significant demographic segment is the Post-2000s (Gen Z/Alpha) group, representing 50% of guests.
Recommendations for Hosts
- Target domestic marketing efforts towards travelers from Los Angeles and San Diego.
- Tailor amenities and listing descriptions to appeal to the dominant Post-2000s (Gen Z/Alpha) demographic (e.g., highlight fast WiFi, smart home features, local guides).
- Highlight unique local experiences or amenities relevant to the primary guest profile.
- Consider seasonal promotions aligned with peak travel times for key origin markets.
Nearby Short-Term Rental Market Comparison
How does the Murrieta Airbnb market stack up against its neighbors? Compare key performance metrics like average monthly revenue, ADR, and occupancy rates in surrounding areas to understand the broader regional STR landscape.
| Market | Active Properties | Monthly Revenue | Daily Rate | Avg. Occupancy |
|---|---|---|---|---|
| Newport Beach | 1,273 | $8,950 | $744.06 | 47% |
| Rancho San Diego | 25 | $8,649 | $568.72 | 48% |
| Malibu | 251 | $8,293 | $1263.89 | 35% |
| Thousand Palms | 33 | $8,119 | $725.48 | 36% |
| Manhattan Beach | 267 | $7,875 | $585.30 | 53% |
| Lakeside | 33 | $7,537 | $604.33 | 44% |
| GlenOak Hills | 41 | $7,394 | $648.65 | 41% |
| Bermuda Dunes | 143 | $7,324 | $664.90 | 39% |
| Mount Helix | 33 | $7,163 | $594.94 | 50% |
| Del Mar | 128 | $7,011 | $671.56 | 45% |