Marina del Rey Airbnb Market Analysis 2026: Short Term Rental Data & Vacation Rental Statistics in California, United States
Is Airbnb profitable in Marina del Rey in 2026? Explore comprehensive Airbnb analytics for Marina del Rey, California, United States to uncover income potential. This 2026 STR market report for Marina del Rey, based on AirROI data from February 2025 to January 2026, reveals key trends in the market of 329 active listings.
Whether you're considering an Airbnb investment in Marina del Rey, optimizing your existing vacation rental, or exploring rental arbitrage opportunities, understanding the Marina del Rey Airbnb data is crucial. Leveraging the low regulation environment is key to maximizing your short term rental income potential. Let's dive into the specifics.
Key Marina del Rey Airbnb Performance Metrics Overview
Monthly Airbnb Revenue Variations & Income Potential in Marina del Rey (2026)
Understanding the monthly revenue variations for Airbnb listings in Marina del Rey is key to maximizing your short term rental income potential. Seasonality significantly impacts earnings. Our analysis, based on data from the past 12 months, shows that the peak revenue month for STRs in Marina del Rey is typically July, while January often presents the lowest earnings, highlighting opportunities for strategic pricing adjustments during shoulder and low seasons. Explore the typical Airbnb income in Marina del Rey across different performance tiers:
- Best-in-class properties (Top 10%) achieve $10,165+ monthly, often utilizing dynamic pricing and superior guest experiences.
- Strong performing properties (Top 25%) earn $6,916 or more, indicating effective management and desirable locations/amenities.
- Typical properties (Median) generate around $3,968 per month, representing the average market performance.
- Entry-level properties (Bottom 25%) see earnings around $1,950, often with potential for optimization.
Average Monthly Airbnb Earnings Trend in Marina del Rey
Marina del Rey Airbnb Occupancy Rate Trends (2026)
Maximize your bookings by understanding the Marina del Rey STR occupancy trends. Seasonal demand shifts significantly influence how often properties are booked. Typically, Aprilsees the highest demand (peak season occupancy), while January experiences the lowest (low season). Effective strategies, like adjusting minimum stays or offering promotions, can boost occupancy during slower periods. Here's how different property tiers perform in Marina del Rey:
- Best-in-class properties (Top 10%) achieve 84%+ occupancy, indicating high desirability and potentially optimized availability.
- Strong performing properties (Top 25%) maintain 69% or higher occupancy, suggesting good market fit and guest satisfaction.
- Typical properties (Median) have an occupancy rate around 44%.
- Entry-level properties (Bottom 25%) average 20% occupancy, potentially facing higher vacancy.
Average Monthly Occupancy Rate Trend in Marina del Rey
Average Daily Rate (ADR) Airbnb Trends in Marina del Rey (2026)
Effective short term rental pricing strategy in Marina del Rey involves understanding monthly ADR fluctuations. The Average Daily Rate (ADR) for Airbnb in Marina del Rey typically peaks in September and dips lowest during February. Leveraging Airbnb dynamic pricing tools or strategies based on this seasonality can significantly boost revenue. Here's a look at the typical nightly rates achieved:
- Best-in-class properties (Top 10%) command rates of $544+ per night, often due to premium features or locations.
- Strong performing properties (Top 25%) achieve nightly rates of $401 or more.
- Typical properties (Median) charge around $306 per night.
- Entry-level properties (Bottom 25%) earn around $235 per night.
Average Daily Rate (ADR) Trend by Month in Marina del Rey
Get Live Marina del Rey Market Intelligence 👇

Explore Real-time Analytics
Airbnb Seasonality Analysis & Trends in Marina del Rey (2026)
Peak Season (July, April, June)
- Revenue averages $5,746 per month
- Occupancy rates average 50.7%
- Daily rates average $354
Shoulder Season
- Revenue averages $4,837 per month
- Occupancy maintains around 44.1%
- Daily rates hold near $357
Low Season (January, February, November)
- Revenue drops to average $4,244 per month
- Occupancy decreases to average 43.2%
- Daily rates adjust to average $342
Seasonality Insights for Marina del Rey
- The Airbnb seasonality in Marina del Rey shows moderate seasonality with distinct peak and low periods. While the sections above show seasonal averages, it's also insightful to look at the extremes:
- During the high season, the absolute peak month showcases Marina del Rey's highest earning potential, with monthly revenues capable of climbing to $5,874, occupancy reaching a high of 51.0%, and ADRs peaking at $377.
- Conversely, the slowest single month of the year, typically falling within the low season, marks the market's lowest point. In this month, revenue might dip to $3,832, occupancy could drop to 36.7%, and ADRs may adjust down to $312.
- Understanding both the seasonal averages and these monthly peaks and troughs in revenue, occupancy, and ADR is crucial for maximizing your Airbnb profit potential in Marina del Rey.
Seasonal Strategies for Maximizing Profit
- Peak Season: Maximize revenue through premium pricing and potentially longer minimum stays. Ensure high availability.
- Low Season: Offer competitive pricing, special promotions (e.g., extended stay discounts), and flexible cancellation policies. Target off-season travelers like remote workers or budget-conscious guests.
- Shoulder Seasons: Implement dynamic pricing that balances peak and low rates. Target weekend travelers or specific events. Offer slightly more flexible terms than peak season.
- Regularly analyze your own performance against these Marina del Rey seasonality benchmarks and adjust your pricing and availability strategy accordingly.
Best Areas for Airbnb Investment in Marina del Rey (2026)
Exploring the top neighborhoods for short-term rentals in Marina del Rey? This section highlights key areas, outlining why they are attractive for hosts and guests, along with notable local attractions. Consider these locations based on your target guest profile and investment strategy.
| Neighborhood / Area | Why Host Here? (Target Guests & Appeal) | Key Attractions & Landmarks |
|---|---|---|
| Marina Beach | Beautiful sandy beach ideal for sunbathing, water sports, and beach walks. Attracts tourists looking for a beach getaway close to urban amenities. | Marina Beach, Jungle Cruise, Venice Beach Boardwalk, Nearby restaurants and cafes, Boat rentals |
| Marina Del Rey Harbor | One of the largest man-made marinas in the world, offering a scenic waterfront with dining and entertainment options. Popular among boaters and visitors. | Boat rentals and tours, Fisherman's Village, Marina del Rey Farmers Market, Waterfront dining, Marina Walk |
| LAX Area | Close proximity to Los Angeles International Airport, making it a convenient choice for travelers. Good for short-term stays before or after flights. | In-n-Out Burger, Theme restaurants, Quick access to West Los Angeles, Hollywood nearby |
| Ballona Wetlands | A natural habitat sanctuary perfect for nature lovers and hikers. Offers unique wildlife viewing opportunities in an urban setting. | Ballona Wetlands Ecological Reserve, Nature trails, Birdwatching, Scenic views, Close to marina |
| Culver City | Vibrant suburb with a thriving arts scene and great dining options. Ideal for guests wanting to explore local culture and entertainment. | Sony Pictures Studios, Culver City Downtown, Culver City Park, The Culver Hotel |
| Venice Beach | Famous for its bohemian spirit, quirky shops, and lively boardwalk. Ideal for young travelers looking for a unique LA experience. | Venice Boardwalk, Muscle Beach, Venice Canals, Street performers, Art shops |
| Santa Monica | Known for its iconic pier and beach, Santa Monica is a major tourist destination with shopping, dining, and entertainment. | Santa Monica Pier, Third Street Promenade, Palisades Park, Beach activities, Shopping and dining |
| Westchester | A family-friendly neighborhood that offers a quieter vibe while being close to attractions. Great for extended stays. | Westchester Park, Shopping centers, Cultural events, Proximity to LAX |
Understanding Airbnb License Requirements & STR Laws in Marina del Rey (2026)
While Marina del Rey, California, United States currently shows low STR regulations, specific Airbnb license requirements might still exist or change. Always verify the latest short term rental regulations and Airbnb license requirements directly with local government authorities for Marina del Rey to ensure full compliance before hosting.
(Source: AirROI data, 2026, based on 3% licensed listings)
Top Performing Airbnb Properties in Marina del Rey (2026)
Benchmark your potential! Explore examples of top-performing Airbnb properties in Marina del Reybased on Trailing Twelve Month (TTM) revenue. Analyze their characteristics, revenue, occupancy rate, and ADR to understand what drives success in this market.
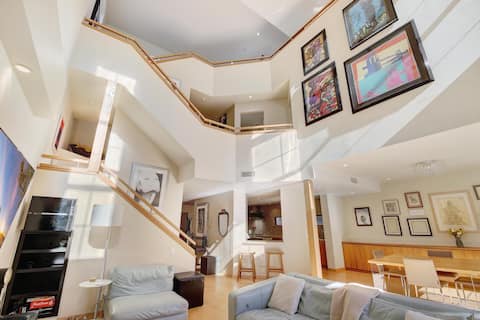
Stunning luxury Rooftop Steps from the Beach
Entire Place • 6 bedrooms
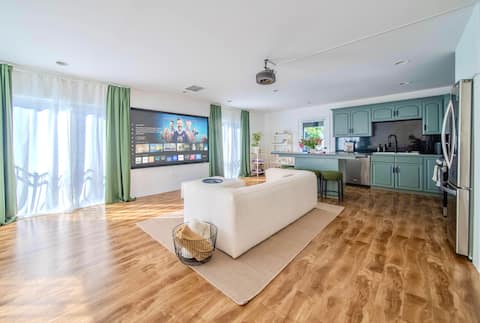
Steps to Beach | Private Rooftop| 100"Movie Screen
Entire Place • 2 bedrooms

Waterfront Bright & Stylish-Resort Style Amenities
Entire Place • 2 bedrooms

Lovely Waterfront 2BDRM + Luxury Amenities
Entire Place • 2 bedrooms

Promo Limited time ! Breathtaking Marina Views !
Entire Place • 2 bedrooms

Turquoise House by Oraklus
Entire Place • 3 bedrooms
Note: Performance varies based on location, size, amenities, seasonality, and management quality. Data reflects the past 12 months.
Top Performing Airbnb Hosts in Marina del Rey (2026)
Learn from the best! This table showcases top-performing Airbnb hosts in Marina del Rey based on the number of properties managed and estimated total revenue over the past year. Analyze their scale and performance metrics.
| Host Name | Properties | Grossing Revenue | Stay Reviews | Avg Rating |
|---|---|---|---|---|
| DriftHaus Estate Management | 13 | $697,288 | 455 | 4.66/5.0 |
| Dolphine Bay | 15 | $518,887 | 239 | 4.76/5.0 |
| Luxe Property Management | 8 | $432,866 | 313 | 4.56/5.0 |
| Lisa | 8 | $399,524 | 309 | 4.85/5.0 |
| ZenStay | 7 | $397,456 | 94 | 4.33/5.0 |
| Jordan | 4 | $384,431 | 687 | 4.94/5.0 |
| Peter | 4 | $382,795 | 193 | 4.75/5.0 |
| LAStays | 5 | $374,023 | 99 | 4.82/5.0 |
| Nadia | 3 | $347,311 | 196 | 4.98/5.0 |
| Adam And Rachel | 2 | $276,466 | 351 | 4.77/5.0 |
Analyzing the strategies of top hosts, such as their property selection, pricing, and guest communication, can offer valuable lessons for optimizing your own Airbnb operations in Marina del Rey.
Dive Deeper: Advanced Marina del Rey STR Market Data (2026)
Ready to unlock more insights? AirROI provides access to advanced metrics and comprehensive Airbnb data for Marina del Rey. Explore detailed analytics beyond this report to refine your investment strategy, optimize pricing, and maximize your vacation rental profits.
Explore Advanced MetricsMarina del Rey Short-Term Rental Market Composition (2026): Property & Room Types
Room Type Distribution
Property Type Distribution
Market Composition Insights for Marina del Rey
- The Marina del Rey Airbnb market composition is heavily skewed towards Entire Home/Apt listings, which make up 93% of the 329 active rentals. This indicates strong guest preference for privacy and space.
- Looking at the property type distribution in Marina del Rey, Apartment/Condo properties are the most common (90.6%), reflecting the local real estate landscape.
- Smaller segments like outdoor/unique, others, hotel/boutique (combined 1.8%) offer potential for unique stay experiences.
Marina del Rey Airbnb Room Capacity Analysis (2026): Bedroom Distribution
Distribution of Listings by Number of Bedrooms
Room Capacity Insights for Marina del Rey
- The dominant room capacity in Marina del Rey is 2 bedrooms listings, making up 43.5% of the market. This suggests a strong demand for properties suitable for couples or solo travelers.
- Together, 2 bedrooms and 1 bedroom properties represent 81.2% of the active Airbnb listings in Marina del Rey, indicating a high concentration in these sizes.
Marina del Rey Vacation Rental Guest Capacity Trends (2026)
Distribution of Listings by Guest Capacity
Guest Capacity Insights for Marina del Rey
- The most common guest capacity trend in Marina del Rey vacation rentals is listings accommodating 6 guests (25.5%). This suggests the primary traveler segment is likely larger groups.
- Properties designed for 6 guests and 4 guests dominate the Marina del Rey STR market, accounting for 47.4% of listings.
- 42.2% of properties accommodate 6+ guests, serving the market segment for larger families or group travel in Marina del Rey.
- On average, properties in Marina del Rey are equipped to host 4.5 guests.
Marina del Rey Airbnb Booking Patterns (2026): Available vs. Booked Days
Available Days Distribution
Booked Days Distribution
Booking Pattern Insights for Marina del Rey
- The most common availability pattern in Marina del Rey falls within the 271-366 days range, representing 60.2% of listings. This suggests many properties have significant open periods on their calendars.
- Approximately 87.3% of listings show high availability (181+ days open annually), indicating potential for increased bookings or specific owner usage patterns.
- For booked days, the 31-90 days range is most frequent in Marina del Rey (37.7%), reflecting common guest stay durations or potential owner blocking patterns.
- A notable 12.8% of properties secure long booking periods (181+ days booked per year), highlighting successful long-term rental strategies or significant owner usage.
Marina del Rey Airbnb Minimum Stay Requirements Analysis
Distribution of Listings by Minimum Night Requirement
1 Night
105 listings
31.9% of total
2 Nights
72 listings
21.9% of total
3 Nights
7 listings
2.1% of total
4-6 Nights
10 listings
3% of total
7-29 Nights
19 listings
5.8% of total
30+ Nights
116 listings
35.3% of total
Key Insights
- The most prevalent minimum stay requirement in Marina del Rey is 30+ Nights, adopted by 35.3% of listings. This highlights the market's preference for longer commitments.
- A significant segment (35.3%) caters to monthly stays (30+ nights) in Marina del Rey, pointing to opportunities in the extended-stay market.
Recommendations
- Align with the market by considering a 30+ Nights minimum stay, as 35.3% of Marina del Rey hosts use this setting.
- Explore offering discounts for stays of 30+ nights to attract the 35.3% of the market seeking extended stays.
- Adjust minimum nights based on seasonality – potentially shorter during low season and longer during peak demand periods in Marina del Rey.
Marina del Rey Airbnb Cancellation Policy Trends Analysis (2026)
Refundable
1 listings
0.3% of total
Limited
4 listings
1.2% of total
Super Strict 30 Days
3 listings
0.9% of total
Flexible
73 listings
22.6% of total
Moderate
74 listings
22.9% of total
Firm
66 listings
20.4% of total
Strict
102 listings
31.6% of total
Cancellation Policy Insights for Marina del Rey
- The prevailing Airbnb cancellation policy trend in Marina del Rey is Strict, used by 31.6% of listings.
- A majority (52.0%) of hosts in Marina del Rey utilize Firm or Strict policies, indicating a market where hosts prioritize booking security.
Recommendations for Hosts
- Consider adopting a Strict policy to align with the 31.6% market standard in Marina del Rey.
- With 31.6% using Strict terms, this is a viable option in Marina del Rey, particularly for high-value properties or during peak demand periods.
- Regularly review your cancellation policy against competitors and market demand shifts in Marina del Rey.
Marina del Rey STR Booking Lead Time Analysis (2026)
Average Booking Lead Time by Month
Booking Lead Time Insights for Marina del Rey
- The overall average booking lead time for vacation rentals in Marina del Rey is 34 days.
- Guests book furthest in advance for stays during August (average 56 days), likely coinciding with peak travel demand or local events.
- The shortest booking windows occur for stays in February (average 23 days), indicating more last-minute travel plans during this time.
- Seasonally, Summer (47 days avg.) sees the longest lead times, while Spring (34 days avg.) has the shortest, reflecting typical travel planning cycles.
Recommendations for Hosts
- Use the overall average lead time (34 days) as a baseline for your pricing and availability strategy in Marina del Rey.
- For August stays, consider implementing length-of-stay discounts or slightly higher rates for bookings made less than 56 days out to capitalize on advance planning.
- Target marketing efforts for the Summer season well in advance (at least 47 days) to capture early planners.
- Monitor your own booking lead times against these Marina del Rey averages to identify opportunities for dynamic pricing adjustments.
Popular & Essential Airbnb Amenities in Marina del Rey (2026)
Amenity Prevalence
Amenity Insights for Marina del Rey
- Essential amenities in Marina del Rey that guests expect include: Wifi, TV, Smoke alarm, Kitchen. Lacking these (any) could significantly impact bookings.
- Popular amenities like Air conditioning, Carbon monoxide alarm, Heating are common but not universal. Offering these can provide a competitive edge.
Recommendations for Hosts
- Ensure your listing includes all essential amenities for Marina del Rey: Wifi, TV, Smoke alarm, Kitchen.
- Prioritize adding missing essentials: TV, Smoke alarm, Kitchen.
- Consider adding popular differentiators like Air conditioning or Carbon monoxide alarm to increase appeal.
- Highlight unique or less common amenities you offer (e.g., hot tub, dedicated workspace, EV charger) in your listing description and photos.
- Regularly check competitor amenities in Marina del Rey to stay competitive.
Marina del Rey Airbnb Guest Demographics & Profile Analysis (2026)
Guest Profile Summary for Marina del Rey
- The typical guest profile for Airbnb in Marina del Rey consists of primarily domestic travelers (69%), often arriving from nearby Los Angeles, typically belonging to the Post-2000s (Gen Z/Alpha) group (50%), primarily speaking English or Spanish.
- Domestic travelers account for 68.9% of guests.
- Key international markets include United States (68.9%) and United Kingdom (4.6%).
- Top languages spoken are English (53.9%) followed by Spanish (14.4%).
- A significant demographic segment is the Post-2000s (Gen Z/Alpha) group, representing 50% of guests.
Recommendations for Hosts
- Target domestic marketing efforts towards travelers from Los Angeles and New York.
- Tailor amenities and listing descriptions to appeal to the dominant Post-2000s (Gen Z/Alpha) demographic (e.g., highlight fast WiFi, smart home features, local guides).
- Highlight unique local experiences or amenities relevant to the primary guest profile.
- Consider seasonal promotions aligned with peak travel times for key origin markets.
Nearby Short-Term Rental Market Comparison
How does the Marina del Rey Airbnb market stack up against its neighbors? Compare key performance metrics like average monthly revenue, ADR, and occupancy rates in surrounding areas to understand the broader regional STR landscape.
| Market | Active Properties | Monthly Revenue | Daily Rate | Avg. Occupancy |
|---|---|---|---|---|
| Montecito | 127 | $10,744 | $950.35 | 51% |
| Newport Beach | 1,273 | $8,950 | $744.06 | 47% |
| Malibu | 251 | $8,293 | $1263.89 | 35% |
| Manhattan Beach | 267 | $7,875 | $585.30 | 53% |
| Del Mar | 128 | $7,011 | $671.56 | 45% |
| Toro Canyon | 33 | $6,935 | $717.58 | 42% |
| Avalon | 249 | $6,705 | $696.60 | 38% |
| Summerland | 88 | $6,323 | $494.72 | 49% |
| Rancho Santa Fe | 34 | $6,074 | $913.16 | 35% |
| Unincorporated Santa Monica Mountains | 119 | $6,008 | $699.60 | 38% |