Los Altos Hills Airbnb Market Analysis 2026: Short Term Rental Data & Vacation Rental Statistics in California, United States
Is Airbnb profitable in Los Altos Hills in 2026? Explore comprehensive Airbnb analytics for Los Altos Hills, California, United States to uncover income potential. This 2026 STR market report for Los Altos Hills, based on AirROI data from February 2025 to January 2026, reveals key trends in the niche market of 36 active listings.
Whether you're considering an Airbnb investment in Los Altos Hills, optimizing your existing vacation rental, or exploring rental arbitrage opportunities, understanding the Los Altos Hills Airbnb data is crucial. Leveraging the low regulation environment is key to maximizing your short term rental income potential. Let's dive into the specifics.
Key Los Altos Hills Airbnb Performance Metrics Overview
Monthly Airbnb Revenue Variations & Income Potential in Los Altos Hills (2026)
Understanding the monthly revenue variations for Airbnb listings in Los Altos Hills is key to maximizing your short term rental income potential. Seasonality significantly impacts earnings. Our analysis, based on data from the past 12 months, shows that the peak revenue month for STRs in Los Altos Hills is typically March, while January often presents the lowest earnings, highlighting opportunities for strategic pricing adjustments during shoulder and low seasons. Explore the typical Airbnb income in Los Altos Hills across different performance tiers:
- Best-in-class properties (Top 10%) achieve $18,445+ monthly, often utilizing dynamic pricing and superior guest experiences.
- Strong performing properties (Top 25%) earn $8,984 or more, indicating effective management and desirable locations/amenities.
- Typical properties (Median) generate around $4,129 per month, representing the average market performance.
- Entry-level properties (Bottom 25%) see earnings around $1,756, often with potential for optimization.
Average Monthly Airbnb Earnings Trend in Los Altos Hills
Los Altos Hills Airbnb Occupancy Rate Trends (2026)
Maximize your bookings by understanding the Los Altos Hills STR occupancy trends. Seasonal demand shifts significantly influence how often properties are booked. Typically, Marchsees the highest demand (peak season occupancy), while January experiences the lowest (low season). Effective strategies, like adjusting minimum stays or offering promotions, can boost occupancy during slower periods. Here's how different property tiers perform in Los Altos Hills:
- Best-in-class properties (Top 10%) achieve 88%+ occupancy, indicating high desirability and potentially optimized availability.
- Strong performing properties (Top 25%) maintain 71% or higher occupancy, suggesting good market fit and guest satisfaction.
- Typical properties (Median) have an occupancy rate around 47%.
- Entry-level properties (Bottom 25%) average 24% occupancy, potentially facing higher vacancy.
Average Monthly Occupancy Rate Trend in Los Altos Hills
Average Daily Rate (ADR) Airbnb Trends in Los Altos Hills (2026)
Effective short term rental pricing strategy in Los Altos Hills involves understanding monthly ADR fluctuations. The Average Daily Rate (ADR) for Airbnb in Los Altos Hills typically peaks in September and dips lowest during February. Leveraging Airbnb dynamic pricing tools or strategies based on this seasonality can significantly boost revenue. Here's a look at the typical nightly rates achieved:
- Best-in-class properties (Top 10%) command rates of $1,459+ per night, often due to premium features or locations.
- Strong performing properties (Top 25%) achieve nightly rates of $714 or more.
- Typical properties (Median) charge around $215 per night.
- Entry-level properties (Bottom 25%) earn around $115 per night.
Average Daily Rate (ADR) Trend by Month in Los Altos Hills
Get Live Los Altos Hills Market Intelligence 👇

Explore Real-time Analytics
Airbnb Seasonality Analysis & Trends in Los Altos Hills (2026)
Peak Season (March, June, May)
- Revenue averages $11,265 per month
- Occupancy rates average 57.4%
- Daily rates average $553
Shoulder Season
- Revenue averages $8,048 per month
- Occupancy maintains around 47.7%
- Daily rates hold near $558
Low Season (January, August, September)
- Revenue drops to average $5,061 per month
- Occupancy decreases to average 44.2%
- Daily rates adjust to average $573
Seasonality Insights for Los Altos Hills
- The Airbnb seasonality in Los Altos Hills shows highly seasonal trends requiring careful strategy. While the sections above show seasonal averages, it's also insightful to look at the extremes:
- During the high season, the absolute peak month showcases Los Altos Hills's highest earning potential, with monthly revenues capable of climbing to $11,617, occupancy reaching a high of 59.4%, and ADRs peaking at $592.
- Conversely, the slowest single month of the year, typically falling within the low season, marks the market's lowest point. In this month, revenue might dip to $2,325, occupancy could drop to 34.8%, and ADRs may adjust down to $515.
- Understanding both the seasonal averages and these monthly peaks and troughs in revenue, occupancy, and ADR is crucial for maximizing your Airbnb profit potential in Los Altos Hills.
Seasonal Strategies for Maximizing Profit
- Peak Season: Maximize revenue through premium pricing and potentially longer minimum stays. Ensure high availability.
- Low Season: Offer competitive pricing, special promotions (e.g., extended stay discounts), and flexible cancellation policies. Target off-season travelers like remote workers or budget-conscious guests.
- Shoulder Seasons: Implement dynamic pricing that balances peak and low rates. Target weekend travelers or specific events. Offer slightly more flexible terms than peak season.
- Regularly analyze your own performance against these Los Altos Hills seasonality benchmarks and adjust your pricing and availability strategy accordingly.
Best Areas for Airbnb Investment in Los Altos Hills (2026)
Exploring the top neighborhoods for short-term rentals in Los Altos Hills? This section highlights key areas, outlining why they are attractive for hosts and guests, along with notable local attractions. Consider these locations based on your target guest profile and investment strategy.
| Neighborhood / Area | Why Host Here? (Target Guests & Appeal) | Key Attractions & Landmarks |
|---|---|---|
| Pinecrest | An upscale residential community known for its large estates and lush greenery. It's ideal for families and those seeking a serene environment while being close to Silicon Valley attractions. | Pinecrest Gardens, Matheson Hammock Park, Coral Pine Park, Local shops and cafes |
| Foothills Park | A beautiful nature park offering hiking trails and scenic views of the Santa Clara Valley. It attracts nature lovers and outdoor enthusiasts looking for tranquility. | Hiking trails, Scenic overlooks, Fishing ponds, Picnic areas |
| Los Altos Village | The charming downtown area with a mix of small shops, restaurants, and local services. Popular for its community feel and accessibility to amenities. | Los Altos History Museum, Local restaurants, Shops and boutiques, Parks |
| Mountain View | Nearby city with a vibrant tech scene and numerous attractions. It appeals to business travelers and those attending events in Silicon Valley. | Shoreline Amphitheatre, Googleplex, Mount View Farmers Market, Castro Street dining and nightlife |
| Stanford University | Home to one of the world's leading universities, attracting visitors for events, conferences, and campus tours. Perfect for academic-related stays. | Stanford Memorial Church, Cantor Arts Center, Rodin Sculpture Garden, Stanford Shopping Center |
| Cupertino | Known for its tech companies, including Apple. It attracts tech workers and visitors attending local events and conferences. | Apple Park Visitor Center, DeAnza College, Cupertino Memorial Park |
| Sunnyvale | A family-friendly neighborhood with parks and close access to major Silicon Valley companies. Great for families visiting or relocating for work. | Sunnyvale Farmers Market, Las Palmas Park, Sunnyvale Baylands Park |
| Los Altos Hills Open Space | Offers expansive views and access to nature. Attracts visitors looking for outdoor activities and a peaceful retreat close to Los Altos. | Hiking and biking trails, Horseback riding, Scenic views |
Understanding Airbnb License Requirements & STR Laws in Los Altos Hills (2026)
While Los Altos Hills, California, United States currently shows low STR regulations, specific Airbnb license requirements might still exist or change. Always verify the latest short term rental regulations and Airbnb license requirements directly with local government authorities for Los Altos Hills to ensure full compliance before hosting.
(Source: AirROI data, 2026, based on 3% licensed listings)
Top Performing Airbnb Properties in Los Altos Hills (2026)
Benchmark your potential! Explore examples of top-performing Airbnb properties in Los Altos Hillsbased on Trailing Twelve Month (TTM) revenue. Analyze their characteristics, revenue, occupancy rate, and ADR to understand what drives success in this market.
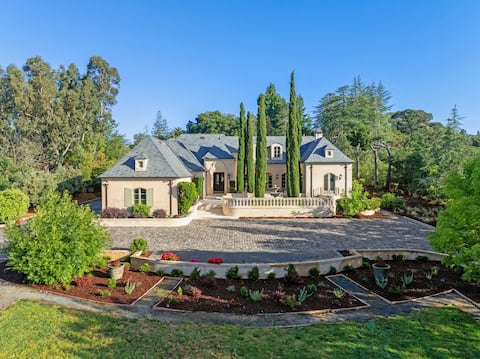
Luxurious Vintage French Chateau
Entire Place • 6 bedrooms

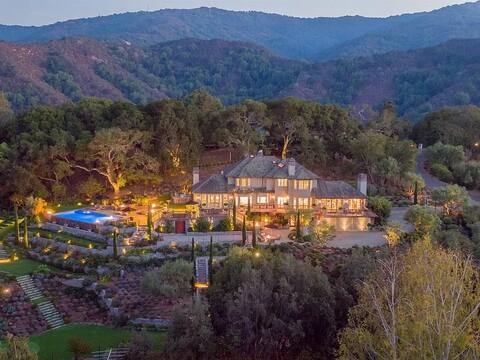
Grand Oasis Los Altos
Entire Place • 7 bedrooms

Stunning Luxurious Modern Los Altos Hills Villa
Entire Place • 4 bedrooms
Luxury Retreat in Los Altos Hills
Entire Place • 4 bedrooms

Cozy house with views and pools
Entire Place • 5 bedrooms

Beautiful home Pool/spa 4bd/4ba Los Altos Hills
Entire Place • 4 bedrooms
Note: Performance varies based on location, size, amenities, seasonality, and management quality. Data reflects the past 12 months.
Top Performing Airbnb Hosts in Los Altos Hills (2026)
Learn from the best! This table showcases top-performing Airbnb hosts in Los Altos Hills based on the number of properties managed and estimated total revenue over the past year. Analyze their scale and performance metrics.
| Host Name | Properties | Grossing Revenue | Stay Reviews | Avg Rating |
|---|---|---|---|---|
| Kiana | 1 | $272,814 | 25 | 4.88/5.0 |
| Sydney | 1 | $224,748 | 3 | 4.67/5.0 |
| Nikki | 1 | $197,542 | 25 | 5.00/5.0 |
| Cassandra | 1 | $195,266 | 13 | 4.69/5.0 |
| Dylan | 1 | $122,776 | 19 | 4.42/5.0 |
| Dawn | 1 | $121,540 | 86 | 4.95/5.0 |
| Abida | 1 | $103,632 | 16 | 4.25/5.0 |
| Donna | 1 | $89,079 | 409 | 4.94/5.0 |
| Joanna | 1 | $81,701 | 293 | 4.85/5.0 |
| April | 2 | $77,392 | 112 | 4.70/5.0 |
Analyzing the strategies of top hosts, such as their property selection, pricing, and guest communication, can offer valuable lessons for optimizing your own Airbnb operations in Los Altos Hills.
Dive Deeper: Advanced Los Altos Hills STR Market Data (2026)
Ready to unlock more insights? AirROI provides access to advanced metrics and comprehensive Airbnb data for Los Altos Hills. Explore detailed analytics beyond this report to refine your investment strategy, optimize pricing, and maximize your vacation rental profits.
Explore Advanced MetricsLos Altos Hills Short-Term Rental Market Composition (2026): Property & Room Types
Room Type Distribution
Property Type Distribution
Market Composition Insights for Los Altos Hills
- The Los Altos Hills Airbnb market composition is heavily skewed towards Entire Home/Apt listings, which make up 69.4% of the 36 active rentals. This indicates strong guest preference for privacy and space.
- However, a notable 30.6% share for Private Rooms suggests opportunities for budget-conscious travelers or hosts renting out spare rooms.
- Looking at the property type distribution in Los Altos Hills, House properties are the most common (75%), reflecting the local real estate landscape.
- Houses represent a significant 75% portion, catering likely to families or larger groups.
- The presence of 11.1% Hotel/Boutique listings indicates integration with traditional hospitality.
Los Altos Hills Airbnb Room Capacity Analysis (2026): Bedroom Distribution
Distribution of Listings by Number of Bedrooms
Room Capacity Insights for Los Altos Hills
- The dominant room capacity in Los Altos Hills is 1 bedroom listings, making up 25% of the market. This suggests a strong demand for properties suitable for couples or solo travelers.
- Together, 1 bedroom and 5+ bedrooms properties represent 47.2% of the active Airbnb listings in Los Altos Hills, indicating a high concentration in these sizes.
- A significant 38.9% of listings offer 3+ bedrooms, catering to larger groups and families seeking more space in Los Altos Hills.
Los Altos Hills Vacation Rental Guest Capacity Trends (2026)
Distribution of Listings by Guest Capacity
Guest Capacity Insights for Los Altos Hills
- The most common guest capacity trend in Los Altos Hills vacation rentals is listings accommodating 8+ guests (33.3%). This suggests the primary traveler segment is likely larger groups.
- Properties designed for 8+ guests and 2 guests dominate the Los Altos Hills STR market, accounting for 52.7% of listings.
- 36.1% of properties accommodate 6+ guests, serving the market segment for larger families or group travel in Los Altos Hills.
- On average, properties in Los Altos Hills are equipped to host 3.8 guests.
Los Altos Hills Airbnb Booking Patterns (2026): Available vs. Booked Days
Available Days Distribution
Booked Days Distribution
Booking Pattern Insights for Los Altos Hills
- The most common availability pattern in Los Altos Hills falls within the 271-366 days range, representing 52.8% of listings. This suggests many properties have significant open periods on their calendars.
- Approximately 75.0% of listings show high availability (181+ days open annually), indicating potential for increased bookings or specific owner usage patterns.
- For booked days, the 31-90 days range is most frequent in Los Altos Hills (33.3%), reflecting common guest stay durations or potential owner blocking patterns.
- A notable 25.0% of properties secure long booking periods (181+ days booked per year), highlighting successful long-term rental strategies or significant owner usage.
Los Altos Hills Airbnb Minimum Stay Requirements Analysis
Distribution of Listings by Minimum Night Requirement
1 Night
14 listings
38.9% of total
3 Nights
3 listings
8.3% of total
4-6 Nights
6 listings
16.7% of total
7-29 Nights
2 listings
5.6% of total
30+ Nights
11 listings
30.6% of total
Key Insights
- The most prevalent minimum stay requirement in Los Altos Hills is 1 Night, adopted by 38.9% of listings. This highlights the market's preference for shorter, flexible bookings.
- A significant segment (30.6%) caters to monthly stays (30+ nights) in Los Altos Hills, pointing to opportunities in the extended-stay market.
Recommendations
- Align with the market by considering a 1 Night minimum stay, as 38.9% of Los Altos Hills hosts use this setting.
- Explore offering discounts for stays of 30+ nights to attract the 30.6% of the market seeking extended stays.
- Adjust minimum nights based on seasonality – potentially shorter during low season and longer during peak demand periods in Los Altos Hills.
Los Altos Hills Airbnb Cancellation Policy Trends Analysis (2026)
Flexible
4 listings
11.1% of total
Moderate
11 listings
30.6% of total
Firm
17 listings
47.2% of total
Strict
4 listings
11.1% of total
Cancellation Policy Insights for Los Altos Hills
- The prevailing Airbnb cancellation policy trend in Los Altos Hills is Firm, used by 47.2% of listings.
- A majority (58.3%) of hosts in Los Altos Hills utilize Firm or Strict policies, indicating a market where hosts prioritize booking security.
Recommendations for Hosts
- Consider adopting a Firm policy to align with the 47.2% market standard in Los Altos Hills.
- Using a Strict policy might deter some guests, as only 11.1% of listings use it. Evaluate if potential revenue protection outweighs possible lower booking rates.
- Regularly review your cancellation policy against competitors and market demand shifts in Los Altos Hills.
Los Altos Hills STR Booking Lead Time Analysis (2026)
Average Booking Lead Time by Month
Booking Lead Time Insights for Los Altos Hills
- The overall average booking lead time for vacation rentals in Los Altos Hills is 41 days.
- Guests book furthest in advance for stays during September (average 58 days), likely coinciding with peak travel demand or local events.
- The shortest booking windows occur for stays in March (average 19 days), indicating more last-minute travel plans during this time.
- Seasonally, Summer (49 days avg.) sees the longest lead times, while Winter (31 days avg.) has the shortest, reflecting typical travel planning cycles.
Recommendations for Hosts
- Use the overall average lead time (41 days) as a baseline for your pricing and availability strategy in Los Altos Hills.
- For September stays, consider implementing length-of-stay discounts or slightly higher rates for bookings made less than 58 days out to capitalize on advance planning.
- Target marketing efforts for the Summer season well in advance (at least 49 days) to capture early planners.
- Monitor your own booking lead times against these Los Altos Hills averages to identify opportunities for dynamic pricing adjustments.
Popular & Essential Airbnb Amenities in Los Altos Hills (2026)
Amenity Prevalence
Amenity Insights for Los Altos Hills
- Essential amenities in Los Altos Hills that guests expect include: Carbon monoxide alarm, Wifi, Smoke alarm, Free parking on premises. Lacking these (any) could significantly impact bookings.
- Popular amenities like Heating, Washer, Hot water are common but not universal. Offering these can provide a competitive edge.
Recommendations for Hosts
- Ensure your listing includes all essential amenities for Los Altos Hills: Carbon monoxide alarm, Wifi, Smoke alarm, Free parking on premises.
- Prioritize adding missing essentials: Free parking on premises.
- Consider adding popular differentiators like Heating or Washer to increase appeal.
- Highlight unique or less common amenities you offer (e.g., hot tub, dedicated workspace, EV charger) in your listing description and photos.
- Regularly check competitor amenities in Los Altos Hills to stay competitive.
Los Altos Hills Airbnb Guest Demographics & Profile Analysis (2026)
Guest Profile Summary for Los Altos Hills
- The typical guest profile for Airbnb in Los Altos Hills consists of primarily domestic travelers (80%), often arriving from nearby San Francisco, typically belonging to the Post-2000s (Gen Z/Alpha) group (50%), primarily speaking English or Spanish.
- Domestic travelers account for 79.5% of guests.
- Key international markets include United States (79.5%) and Germany (3.1%).
- Top languages spoken are English (55.5%) followed by Spanish (11%).
- A significant demographic segment is the Post-2000s (Gen Z/Alpha) group, representing 50% of guests.
Recommendations for Hosts
- Target domestic marketing efforts towards travelers from San Francisco and Palo Alto.
- Tailor amenities and listing descriptions to appeal to the dominant Post-2000s (Gen Z/Alpha) demographic (e.g., highlight fast WiFi, smart home features, local guides).
- Highlight unique local experiences or amenities relevant to the primary guest profile.
- Consider seasonal promotions aligned with peak travel times for key origin markets.
Nearby Short-Term Rental Market Comparison
How does the Los Altos Hills Airbnb market stack up against its neighbors? Compare key performance metrics like average monthly revenue, ADR, and occupancy rates in surrounding areas to understand the broader regional STR landscape.
| Market | Active Properties | Monthly Revenue | Daily Rate | Avg. Occupancy |
|---|---|---|---|---|
| Carmel Point | 15 | $14,483 | $1046.17 | 54% |
| Del Monte Forest | 105 | $10,280 | $964.89 | 47% |
| Moss Beach | 34 | $10,092 | $676.91 | 53% |
| Sonoma | 228 | $9,647 | $819.87 | 43% |
| Marshall | 18 | $8,897 | $607.75 | 50% |
| St. Helena | 50 | $8,684 | $924.70 | 38% |
| Carmel-by-the-Sea | 305 | $8,657 | $680.02 | 49% |
| Kenwood | 60 | $8,643 | $810.83 | 41% |
| Glen Ellen | 85 | $8,482 | $799.53 | 43% |
| Eldridge | 21 | $8,410 | $930.61 | 41% |