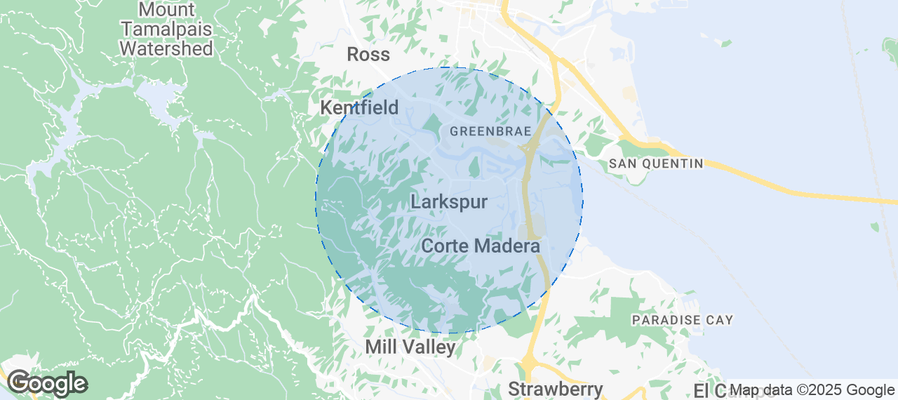
Larkspur Airbnb Market Analysis 2026: Short Term Rental Data & Vacation Rental Statistics in California, United States
Is Airbnb profitable in Larkspur in 2026? Explore comprehensive Airbnb analytics for Larkspur, California, United States to uncover income potential. This 2026 STR market report for Larkspur, based on AirROI data from February 2025 to January 2026, reveals key trends in the niche market of 19 active listings.
Whether you're considering an Airbnb investment in Larkspur, optimizing your existing vacation rental, or exploring rental arbitrage opportunities, understanding the Larkspur Airbnb data is crucial. Leveraging the low regulation environment is key to maximizing your short term rental income potential. Let's dive into the specifics.
Key Larkspur Airbnb Performance Metrics Overview
Monthly Airbnb Revenue Variations & Income Potential in Larkspur (2026)
Understanding the monthly revenue variations for Airbnb listings in Larkspur is key to maximizing your short term rental income potential. Seasonality significantly impacts earnings. Our analysis, based on data from the past 12 months, shows that the peak revenue month for STRs in Larkspur is typically May, while January often presents the lowest earnings, highlighting opportunities for strategic pricing adjustments during shoulder and low seasons. Explore the typical Airbnb income in Larkspur across different performance tiers:
- Best-in-class properties (Top 10%) achieve $12,875+ monthly, often utilizing dynamic pricing and superior guest experiences.
- Strong performing properties (Top 25%) earn $6,411 or more, indicating effective management and desirable locations/amenities.
- Typical properties (Median) generate around $3,835 per month, representing the average market performance.
- Entry-level properties (Bottom 25%) see earnings around $1,664, often with potential for optimization.
Average Monthly Airbnb Earnings Trend in Larkspur
Larkspur Airbnb Occupancy Rate Trends (2026)
Maximize your bookings by understanding the Larkspur STR occupancy trends. Seasonal demand shifts significantly influence how often properties are booked. Typically, Octobersees the highest demand (peak season occupancy), while January experiences the lowest (low season). Effective strategies, like adjusting minimum stays or offering promotions, can boost occupancy during slower periods. Here's how different property tiers perform in Larkspur:
- Best-in-class properties (Top 10%) achieve 88%+ occupancy, indicating high desirability and potentially optimized availability.
- Strong performing properties (Top 25%) maintain 80% or higher occupancy, suggesting good market fit and guest satisfaction.
- Typical properties (Median) have an occupancy rate around 60%.
- Entry-level properties (Bottom 25%) average 33% occupancy, potentially facing higher vacancy.
Average Monthly Occupancy Rate Trend in Larkspur
Average Daily Rate (ADR) Airbnb Trends in Larkspur (2026)
Effective short term rental pricing strategy in Larkspur involves understanding monthly ADR fluctuations. The Average Daily Rate (ADR) for Airbnb in Larkspur typically peaks in May and dips lowest during January. Leveraging Airbnb dynamic pricing tools or strategies based on this seasonality can significantly boost revenue. Here's a look at the typical nightly rates achieved:
- Best-in-class properties (Top 10%) command rates of $535+ per night, often due to premium features or locations.
- Strong performing properties (Top 25%) achieve nightly rates of $326 or more.
- Typical properties (Median) charge around $199 per night.
- Entry-level properties (Bottom 25%) earn around $155 per night.
Average Daily Rate (ADR) Trend by Month in Larkspur
Get Live Larkspur Market Intelligence 👇
Explore Real-time Analytics
Airbnb Seasonality Analysis & Trends in Larkspur (2026)
Peak Season (May, July, March)
- Revenue averages $6,086 per month
- Occupancy rates average 61.8%
- Daily rates average $271
Shoulder Season
- Revenue averages $5,013 per month
- Occupancy maintains around 57.3%
- Daily rates hold near $262
Low Season (January, February, December)
- Revenue drops to average $4,110 per month
- Occupancy decreases to average 50.7%
- Daily rates adjust to average $252
Seasonality Insights for Larkspur
- The Airbnb seasonality in Larkspur shows moderate seasonality with distinct peak and low periods. While the sections above show seasonal averages, it's also insightful to look at the extremes:
- During the high season, the absolute peak month showcases Larkspur's highest earning potential, with monthly revenues capable of climbing to $6,262, occupancy reaching a high of 71.0%, and ADRs peaking at $274.
- Conversely, the slowest single month of the year, typically falling within the low season, marks the market's lowest point. In this month, revenue might dip to $3,823, occupancy could drop to 42.4%, and ADRs may adjust down to $243.
- Understanding both the seasonal averages and these monthly peaks and troughs in revenue, occupancy, and ADR is crucial for maximizing your Airbnb profit potential in Larkspur.
Seasonal Strategies for Maximizing Profit
- Peak Season: Maximize revenue through premium pricing and potentially longer minimum stays. Ensure high availability.
- Low Season: Offer competitive pricing, special promotions (e.g., extended stay discounts), and flexible cancellation policies. Target off-season travelers like remote workers or budget-conscious guests.
- Shoulder Seasons: Implement dynamic pricing that balances peak and low rates. Target weekend travelers or specific events. Offer slightly more flexible terms than peak season.
- Regularly analyze your own performance against these Larkspur seasonality benchmarks and adjust your pricing and availability strategy accordingly.
Best Areas for Airbnb Investment in Larkspur (2026)
Exploring the top neighborhoods for short-term rentals in Larkspur? This section highlights key areas, outlining why they are attractive for hosts and guests, along with notable local attractions. Consider these locations based on your target guest profile and investment strategy.
| Neighborhood / Area | Why Host Here? (Target Guests & Appeal) | Key Attractions & Landmarks |
|---|---|---|
| Marin Country Mart | This upscale shopping and dining destination attracts visitors for its premium brands and waterfront views. It's perfect for travelers looking for a luxurious experience in the heart of Marin County. | Marin Country Mart Shops, Waterfront Park, Cowgirl Creamery, Bovine Bakery, Restaurant E, Outdoor Events and Festivals |
| Larkspur Landing | A convenient location for travelers seeking mainland access to the Marin area and beyond, with easy access to public transportation and stunning bay views. | Larkspur Ferry Terminal, Marin Civic Center, China Camp State Park, Scenic Bay Views, Nearby Restaurants |
| Historic Larkspur | Charming and picturesque, Historic Larkspur offers quaint shops and a laid-back atmosphere, attracting visitors looking for a tranquil escape. | Larkspur Hotel, Larkspur Plaza Shopping Center, Miller Creek Park, Local Art Galleries, Dining Options |
| St. Patrick's Church | A landmark in the area that draws in both locals and visitors, particularly around holiday seasons, making nearby accommodations desirable. | Historical Architecture, Community Events, Beautiful Landscaping |
| Larkspur Marina | Ideal for those who love water activities and scenic views, appealing to tourists and locals alike looking for boating and recreation. | Marina Park, Boating and Kayaking, Waterfront Trails, Picnic Areas |
| Redwood Highway | A major route attracting travelers heading north, offering quick access to nearby attractions, making it a strategic location for overnight stays. | Access to Point Reyes, Nearby Dining and Services, Scenic Drives |
| Dalmatian Coast Park | A lesser-known gem that offers outdoor activities and scenic beauty, attracting nature lovers and families seeking recreation in a park setting. | Parks and Trails, Picnic Areas, Natural Beauty |
| Larkspur's Farmers Market | Attractive to visitors who appreciate local produce and artisanal goods, creating a lively atmosphere and community feel every week. | Local Produce, Artisan Vendors, Community Events |
Understanding Airbnb License Requirements & STR Laws in Larkspur (2026)
While Larkspur, California, United States currently shows low STR regulations, specific Airbnb license requirements might still exist or change. Always verify the latest short term rental regulations and Airbnb license requirements directly with local government authorities for Larkspur to ensure full compliance before hosting.
(Source: AirROI data, 2026, finding no licensed listings among those analyzed)
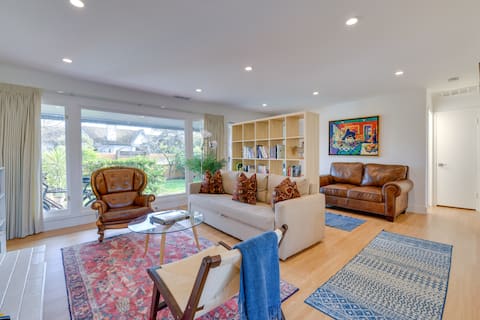
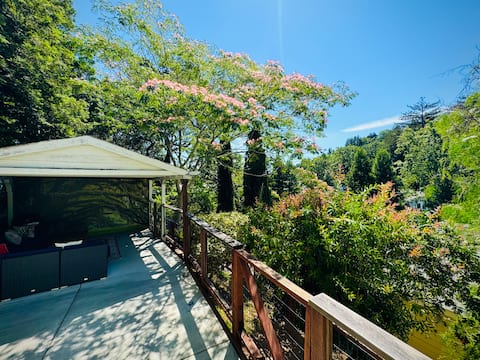
Top Performing Airbnb Properties in Larkspur (2026)
Benchmark your potential! Explore examples of top-performing Airbnb properties in Larkspurbased on Trailing Twelve Month (TTM) revenue. Analyze their characteristics, revenue, occupancy rate, and ADR to understand what drives success in this market.

Modern Rustic Retreat Home w/cedar hot tub
Entire Place • 3 bedrooms
Garden Cottage
Entire Place • 3 bedrooms

Cozy Larkspur Cabin
Entire Place • 1 bedroom

Luxury Waterfront Getaway
Entire Place • 2 bedrooms

Guesthouse in Larkspur
Entire Place • 1 bedroom
Modern Studio in Redwoods w/Deck & Outdoor Cinema
Entire Place • 1 bedroom
Note: Performance varies based on location, size, amenities, seasonality, and management quality. Data reflects the past 12 months.
Top Performing Airbnb Hosts in Larkspur (2026)
Learn from the best! This table showcases top-performing Airbnb hosts in Larkspur based on the number of properties managed and estimated total revenue over the past year. Analyze their scale and performance metrics.
| Host Name | Properties | Grossing Revenue | Stay Reviews | Avg Rating |
|---|---|---|---|---|
| Adrienne | 1 | $171,359 | 90 | 4.89/5.0 |
| Ruth | 1 | $102,751 | 65 | 4.97/5.0 |
| Alison | 1 | $61,106 | 286 | 4.95/5.0 |
| Amber | 1 | $59,747 | 12 | 4.92/5.0 |
| Armand | 1 | $53,575 | 19 | 5.00/5.0 |
| Livia | 1 | $50,680 | 28 | 4.86/5.0 |
| Tully | 1 | $43,605 | 252 | 4.86/5.0 |
| Heidi | 1 | $35,220 | 53 | 4.74/5.0 |
| Katie | 1 | $31,235 | 30 | 4.83/5.0 |
| Dr John | 2 | $29,711 | 245 | 4.75/5.0 |
Analyzing the strategies of top hosts, such as their property selection, pricing, and guest communication, can offer valuable lessons for optimizing your own Airbnb operations in Larkspur.
Dive Deeper: Advanced Larkspur STR Market Data (2026)
Ready to unlock more insights? AirROI provides access to advanced metrics and comprehensive Airbnb data for Larkspur. Explore detailed analytics beyond this report to refine your investment strategy, optimize pricing, and maximize your vacation rental profits.
Explore Advanced MetricsLarkspur Short-Term Rental Market Composition (2026): Property & Room Types
Room Type Distribution
Property Type Distribution
Market Composition Insights for Larkspur
- The Larkspur Airbnb market composition is heavily skewed towards Entire Home/Apt listings, which make up 89.5% of the 19 active rentals. This indicates strong guest preference for privacy and space.
- Looking at the property type distribution in Larkspur, House properties are the most common (42.1%), reflecting the local real estate landscape.
- Houses represent a significant 42.1% portion, catering likely to families or larger groups.
- The presence of 5.3% Hotel/Boutique listings indicates integration with traditional hospitality.
Larkspur Airbnb Room Capacity Analysis (2026): Bedroom Distribution
Distribution of Listings by Number of Bedrooms
Room Capacity Insights for Larkspur
- The dominant room capacity in Larkspur is 1 bedroom listings, making up 52.6% of the market. This suggests a strong demand for properties suitable for couples or solo travelers.
- Together, 1 bedroom and 2 bedrooms properties represent 84.2% of the active Airbnb listings in Larkspur, indicating a high concentration in these sizes.
- With over half the market (52.6%) consisting of studios or 1-bedroom units, Larkspur is particularly well-suited for individuals or couples.
Larkspur Vacation Rental Guest Capacity Trends (2026)
Distribution of Listings by Guest Capacity
Guest Capacity Insights for Larkspur
- The most common guest capacity trend in Larkspur vacation rentals is listings accommodating 2 guests (47.4%). This suggests the primary traveler segment is likely couples or solo travelers.
- Properties designed for 2 guests and 4 guests dominate the Larkspur STR market, accounting for 68.5% of listings.
- A significant 47.4% of listings cater specifically to 1-2 guests, highlighting strong demand from couples and solo travelers in Larkspur.
- 10.5% of properties accommodate 6+ guests, serving the market segment for larger families or group travel in Larkspur.
- On average, properties in Larkspur are equipped to host 2.9 guests.
Larkspur Airbnb Booking Patterns (2026): Available vs. Booked Days
Available Days Distribution
Booked Days Distribution
Booking Pattern Insights for Larkspur
- The most common availability pattern in Larkspur falls within the 271-366 days range, representing 47.4% of listings. This suggests many properties have significant open periods on their calendars.
- Approximately 63.2% of listings show high availability (181+ days open annually), indicating potential for increased bookings or specific owner usage patterns.
- For booked days, the 31-90 days range is most frequent in Larkspur (31.6%), reflecting common guest stay durations or potential owner blocking patterns.
- A notable 36.9% of properties secure long booking periods (181+ days booked per year), highlighting successful long-term rental strategies or significant owner usage.
Larkspur Airbnb Minimum Stay Requirements Analysis
Distribution of Listings by Minimum Night Requirement
1 Night
1 listings
5.3% of total
2 Nights
3 listings
15.8% of total
3 Nights
4 listings
21.1% of total
7-29 Nights
4 listings
21.1% of total
30+ Nights
7 listings
36.8% of total
Key Insights
- The most prevalent minimum stay requirement in Larkspur is 30+ Nights, adopted by 36.8% of listings. This highlights the market's preference for longer commitments.
- A significant segment (36.8%) caters to monthly stays (30+ nights) in Larkspur, pointing to opportunities in the extended-stay market.
Recommendations
- Align with the market by considering a 30+ Nights minimum stay, as 36.8% of Larkspur hosts use this setting.
- If feasible, allowing 1-night stays, especially midweek or during low season, could capture last-minute bookings, as only 5.3% currently do.
- Explore offering discounts for stays of 30+ nights to attract the 36.8% of the market seeking extended stays.
- Adjust minimum nights based on seasonality – potentially shorter during low season and longer during peak demand periods in Larkspur.
Larkspur Airbnb Cancellation Policy Trends Analysis (2026)
Flexible
3 listings
15.8% of total
Moderate
4 listings
21.1% of total
Firm
8 listings
42.1% of total
Strict
4 listings
21.1% of total
Cancellation Policy Insights for Larkspur
- The prevailing Airbnb cancellation policy trend in Larkspur is Firm, used by 42.1% of listings.
- A majority (63.2%) of hosts in Larkspur utilize Firm or Strict policies, indicating a market where hosts prioritize booking security.
Recommendations for Hosts
- Consider adopting a Firm policy to align with the 42.1% market standard in Larkspur.
- Regularly review your cancellation policy against competitors and market demand shifts in Larkspur.
Larkspur STR Booking Lead Time Analysis (2026)
Average Booking Lead Time by Month
Booking Lead Time Insights for Larkspur
- The overall average booking lead time for vacation rentals in Larkspur is 54 days.
- Guests book furthest in advance for stays during December (average 82 days), likely coinciding with peak travel demand or local events.
- The shortest booking windows occur for stays in January (average 27 days), indicating more last-minute travel plans during this time.
- Seasonally, Summer (71 days avg.) sees the longest lead times, while Fall (48 days avg.) has the shortest, reflecting typical travel planning cycles.
Recommendations for Hosts
- Use the overall average lead time (54 days) as a baseline for your pricing and availability strategy in Larkspur.
- For December stays, consider implementing length-of-stay discounts or slightly higher rates for bookings made less than 82 days out to capitalize on advance planning.
- Target marketing efforts for the Summer season well in advance (at least 71 days) to capture early planners.
- Monitor your own booking lead times against these Larkspur averages to identify opportunities for dynamic pricing adjustments.
Popular & Essential Airbnb Amenities in Larkspur (2026)
Amenity Prevalence
Amenity Insights for Larkspur
- Popular amenities like Essentials, Heating, Wifi are common but not universal. Offering these can provide a competitive edge.
- Warning: Wifi is not universally provided but is considered essential globally. Ensure reliable Wifi is offered.
Recommendations for Hosts
- Consider adding popular differentiators like Essentials or Heating to increase appeal.
- Highlight unique or less common amenities you offer (e.g., hot tub, dedicated workspace, EV charger) in your listing description and photos.
- Regularly check competitor amenities in Larkspur to stay competitive.
Larkspur Airbnb Guest Demographics & Profile Analysis (2026)
Guest Profile Summary for Larkspur
- The typical guest profile for Airbnb in Larkspur consists of primarily domestic travelers (89%), often arriving from nearby San Francisco, typically belonging to the Post-2000s (Gen Z/Alpha) group (50%), primarily speaking English or Spanish.
- Domestic travelers account for 89.4% of guests.
- Key international markets include United States (89.4%) and Australia (2%).
- Top languages spoken are English (61.8%) followed by Spanish (13.2%).
- A significant demographic segment is the Post-2000s (Gen Z/Alpha) group, representing 50% of guests.
Recommendations for Hosts
- Target domestic marketing efforts towards travelers from San Francisco and New York.
- Tailor amenities and listing descriptions to appeal to the dominant Post-2000s (Gen Z/Alpha) demographic (e.g., highlight fast WiFi, smart home features, local guides).
- Highlight unique local experiences or amenities relevant to the primary guest profile.
- Consider seasonal promotions aligned with peak travel times for key origin markets.
Nearby Short-Term Rental Market Comparison
How does the Larkspur Airbnb market stack up against its neighbors? Compare key performance metrics like average monthly revenue, ADR, and occupancy rates in surrounding areas to understand the broader regional STR landscape.
| Market | Active Properties | Monthly Revenue | Daily Rate | Avg. Occupancy |
|---|---|---|---|---|
| Carmel Point | 15 | $14,483 | $1046.17 | 54% |
| Del Monte Forest | 105 | $10,280 | $964.89 | 47% |
| Moss Beach | 34 | $10,092 | $676.91 | 53% |
| Sonoma | 228 | $9,647 | $819.87 | 43% |
| Marshall | 18 | $8,897 | $607.75 | 50% |
| St. Helena | 50 | $8,684 | $924.70 | 38% |
| Carmel-by-the-Sea | 305 | $8,657 | $680.02 | 49% |
| Kenwood | 60 | $8,643 | $810.83 | 41% |
| Glen Ellen | 85 | $8,482 | $799.53 | 43% |
| Eldridge | 21 | $8,410 | $930.61 | 41% |