Joshua Tree Airbnb Market Analysis 2026: Short Term Rental Data & Vacation Rental Statistics in California, United States
Is Airbnb profitable in Joshua Tree in 2026? Explore comprehensive Airbnb analytics for Joshua Tree, California, United States to uncover income potential. This 2026 STR market report for Joshua Tree, based on AirROI data from February 2025 to January 2026, reveals key trends in the bustling market of 1,181 active listings.
Whether you're considering an Airbnb investment in Joshua Tree, optimizing your existing vacation rental, or exploring rental arbitrage opportunities, understanding the Joshua Tree Airbnb data is crucial. Navigating the high regulation landscape is key to maximizing your short term rental income potential. Let's dive into the specifics.
Key Joshua Tree Airbnb Performance Metrics Overview
Monthly Airbnb Revenue Variations & Income Potential in Joshua Tree (2026)
Understanding the monthly revenue variations for Airbnb listings in Joshua Tree is key to maximizing your short term rental income potential. Seasonality significantly impacts earnings. Our analysis, based on data from the past 12 months, shows that the peak revenue month for STRs in Joshua Tree is typically April, while September often presents the lowest earnings, highlighting opportunities for strategic pricing adjustments during shoulder and low seasons. Explore the typical Airbnb income in Joshua Tree across different performance tiers:
- Best-in-class properties (Top 10%) achieve $10,856+ monthly, often utilizing dynamic pricing and superior guest experiences.
- Strong performing properties (Top 25%) earn $6,395 or more, indicating effective management and desirable locations/amenities.
- Typical properties (Median) generate around $3,723 per month, representing the average market performance.
- Entry-level properties (Bottom 25%) see earnings around $2,053, often with potential for optimization.
Average Monthly Airbnb Earnings Trend in Joshua Tree
Joshua Tree Airbnb Occupancy Rate Trends (2026)
Maximize your bookings by understanding the Joshua Tree STR occupancy trends. Seasonal demand shifts significantly influence how often properties are booked. Typically, Marchsees the highest demand (peak season occupancy), while September experiences the lowest (low season). Effective strategies, like adjusting minimum stays or offering promotions, can boost occupancy during slower periods. Here's how different property tiers perform in Joshua Tree:
- Best-in-class properties (Top 10%) achieve 84%+ occupancy, indicating high desirability and potentially optimized availability.
- Strong performing properties (Top 25%) maintain 68% or higher occupancy, suggesting good market fit and guest satisfaction.
- Typical properties (Median) have an occupancy rate around 48%.
- Entry-level properties (Bottom 25%) average 28% occupancy, potentially facing higher vacancy.
Average Monthly Occupancy Rate Trend in Joshua Tree
Average Daily Rate (ADR) Airbnb Trends in Joshua Tree (2026)
Effective short term rental pricing strategy in Joshua Tree involves understanding monthly ADR fluctuations. The Average Daily Rate (ADR) for Airbnb in Joshua Tree typically peaks in April and dips lowest during August. Leveraging Airbnb dynamic pricing tools or strategies based on this seasonality can significantly boost revenue. Here's a look at the typical nightly rates achieved:
- Best-in-class properties (Top 10%) command rates of $549+ per night, often due to premium features or locations.
- Strong performing properties (Top 25%) achieve nightly rates of $361 or more.
- Typical properties (Median) charge around $247 per night.
- Entry-level properties (Bottom 25%) earn around $181 per night.
Average Daily Rate (ADR) Trend by Month in Joshua Tree
Get Live Joshua Tree Market Intelligence 👇

Explore Real-time Analytics
Airbnb Seasonality Analysis & Trends in Joshua Tree (2026)
Peak Season (April, March, December)
- Revenue averages $6,654 per month
- Occupancy rates average 56.5%
- Daily rates average $354
Shoulder Season
- Revenue averages $4,892 per month
- Occupancy maintains around 48.1%
- Daily rates hold near $314
Low Season (July, August, September)
- Revenue drops to average $3,873 per month
- Occupancy decreases to average 41.1%
- Daily rates adjust to average $276
Seasonality Insights for Joshua Tree
- The Airbnb seasonality in Joshua Tree shows moderate seasonality with distinct peak and low periods. While the sections above show seasonal averages, it's also insightful to look at the extremes:
- During the high season, the absolute peak month showcases Joshua Tree's highest earning potential, with monthly revenues capable of climbing to $7,067, occupancy reaching a high of 60.5%, and ADRs peaking at $373.
- Conversely, the slowest single month of the year, typically falling within the low season, marks the market's lowest point. In this month, revenue might dip to $3,620, occupancy could drop to 38.9%, and ADRs may adjust down to $269.
- Understanding both the seasonal averages and these monthly peaks and troughs in revenue, occupancy, and ADR is crucial for maximizing your Airbnb profit potential in Joshua Tree.
Seasonal Strategies for Maximizing Profit
- Peak Season: Maximize revenue through premium pricing and potentially longer minimum stays. Ensure high availability.
- Low Season: Offer competitive pricing, special promotions (e.g., extended stay discounts), and flexible cancellation policies. Target off-season travelers like remote workers or budget-conscious guests.
- Shoulder Seasons: Implement dynamic pricing that balances peak and low rates. Target weekend travelers or specific events. Offer slightly more flexible terms than peak season.
- Regularly analyze your own performance against these Joshua Tree seasonality benchmarks and adjust your pricing and availability strategy accordingly.
Best Areas for Airbnb Investment in Joshua Tree (2026)
Exploring the top neighborhoods for short-term rentals in Joshua Tree? This section highlights key areas, outlining why they are attractive for hosts and guests, along with notable local attractions. Consider these locations based on your target guest profile and investment strategy.
| Neighborhood / Area | Why Host Here? (Target Guests & Appeal) | Key Attractions & Landmarks |
|---|---|---|
| Pioneertown | A historic Old West movie set that’s now a popular destination for arts and music events. It offers unique accommodation experiences and a glimpse into the storied past of Hollywood. | Pappy & Harriet's Pioneertown Palace, Pioneertown Mountains Preserve, Joshua Tree Music Festival, Old West movie set, Hiking trails |
| Joshua Tree Village | The gateway to Joshua Tree National Park, offering a vibrant arts scene, local shops, and eateries. It's a charming area that attracts visitors seeking nature and the local culture. | Joshua Tree National Park, Noah Purifoy Outdoor Desert Art Museum, Joshua Tree Coffee Company, Art galleries, Local shops |
| La Copine | A trendy spot within the Pioneertown area, known for its eclectic dining options and art. It attracts food enthusiasts and those looking for unique experiences near Joshua Tree. | La Copine restaurant, Pioneertown Mercantile, Cultural events, Local art |
| Cholla Cactus Garden | Located within Joshua Tree National Park, this area is famous for its stunning Cholla cacti which bloom beautifully at sunrise and sunset. Perfect for nature lovers and photographers. | Cholla Cactus Garden, Joshua Tree National Park, Nature walks, Photography spots |
| Keys View | A stunning viewpoint in Joshua Tree National Park that offers panoramic views of the Coachella Valley and the San Andreas Fault. Great for travelers seeking breathtaking vistas. | Keys View, Joshua Tree National Park, Stargazing, Nature walks |
| Skull Rock | A unique rock formation that is a favorite among tourists. It’s a popular stop for those exploring Joshua Tree National Park and looking for unique photo opportunities. | Skull Rock, Joshua Tree National Park, Nature trails, Rock climbing |
| Hidden Valley | A beautiful area known for its scenic trails and rock formations, it's a popular spot for climbing and hiking. Attracts outdoor enthusiasts and those wishing to escape into nature. | Hidden Valley Nature Trail, Joshua Tree National Park, Rock climbing, Nature trails |
| Cottonwood Spring | Located in the southern part of Joshua Tree National Park, it’s known for its lush oasis and diverse wildlife. Ideal for those seeking remote retreats surrounded by nature. | Cottonwood Spring Oasis, Joshua Tree National Park, Hiking trails, Wildlife viewing |
Understanding Airbnb License Requirements & STR Laws in Joshua Tree (2026)
Yes, Joshua Tree, California, United States enforces high STR regulations. Obtaining a license and ensuring compliance is almost certainly required according to current 2026 STR laws. Always verify the latest short term rental regulations and Airbnb license requirements directly with local government authorities for Joshua Tree to ensure full compliance before hosting.
(Source: AirROI data, 2026, based on 94% licensed listings)
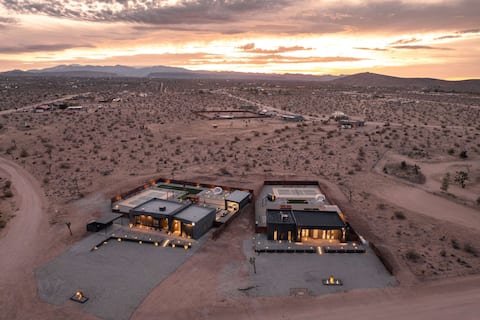
Top Performing Airbnb Properties in Joshua Tree (2026)
Benchmark your potential! Explore examples of top-performing Airbnb properties in Joshua Treebased on Trailing Twelve Month (TTM) revenue. Analyze their characteristics, revenue, occupancy rate, and ADR to understand what drives success in this market.
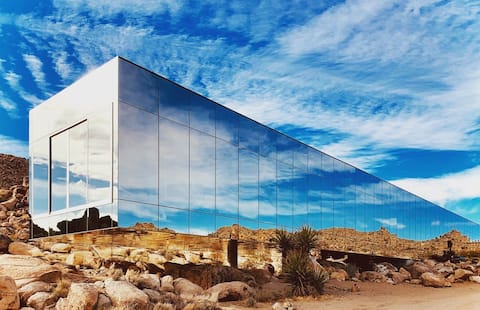
Invisible House | Desert Icon w/ Indoor Pool
Entire Place • 4 bedrooms
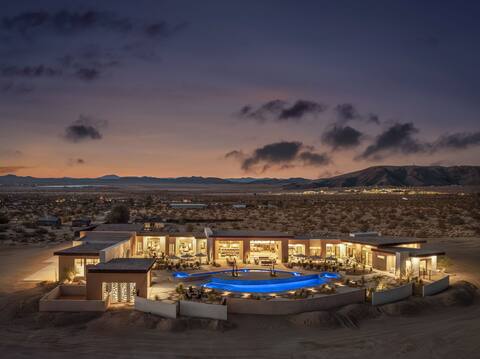
Peak by Fieldtrip | 8 BR Modern Oasis | 2 Pools
Entire Place • 8 bedrooms
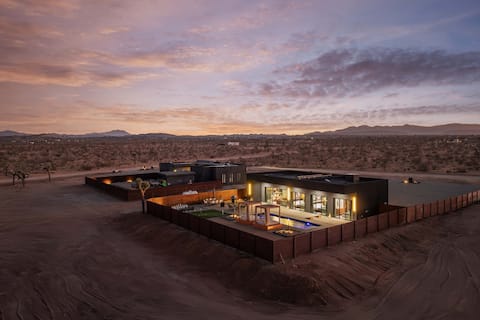
Twilight Dream Villas (Pool/Spa/FirePit/Golf)
Entire Place • 6 bedrooms
Luxury 2 Family Villas Pool/Spa/FirePit/EV Charger
Entire Place • 6 bedrooms

Moonstone Bungalow by The CoHost Company
Entire Place • 7 bedrooms

Desert Mirage-Pool/Spa/Golf/Pickleball-EVCharger/
Entire Place • 4 bedrooms
Note: Performance varies based on location, size, amenities, seasonality, and management quality. Data reflects the past 12 months.
Top Performing Airbnb Hosts in Joshua Tree (2026)
Learn from the best! This table showcases top-performing Airbnb hosts in Joshua Tree based on the number of properties managed and estimated total revenue over the past year. Analyze their scale and performance metrics.
| Host Name | Properties | Grossing Revenue | Stay Reviews | Avg Rating |
|---|---|---|---|---|
| The Cohost Company | 44 | $4,569,003 | 6382 | 4.92/5.0 |
| Fieldtrip | 21 | $3,837,994 | 1920 | 4.97/5.0 |
| Hideaway | 13 | $2,889,240 | 1719 | 4.85/5.0 |
| Homestead Modern | 28 | $1,805,415 | 3849 | 4.94/5.0 |
| Hi-Desert Dwellings | 38 | $1,787,181 | 8373 | 4.90/5.0 |
| Desert Spirit Properties | 15 | $1,349,418 | 1857 | 4.94/5.0 |
| Jenn | 22 | $1,294,740 | 4660 | 4.93/5.0 |
| Hygge | 6 | $988,492 | 1671 | 4.96/5.0 |
| Somewhere Management | 10 | $838,311 | 2379 | 4.85/5.0 |
| Foxden Hospitality | 4 | $607,153 | 188 | 4.93/5.0 |
Analyzing the strategies of top hosts, such as their property selection, pricing, and guest communication, can offer valuable lessons for optimizing your own Airbnb operations in Joshua Tree.
Dive Deeper: Advanced Joshua Tree STR Market Data (2026)
Ready to unlock more insights? AirROI provides access to advanced metrics and comprehensive Airbnb data for Joshua Tree. Explore detailed analytics beyond this report to refine your investment strategy, optimize pricing, and maximize your vacation rental profits.
Explore Advanced MetricsJoshua Tree Short-Term Rental Market Composition (2026): Property & Room Types
Room Type Distribution
Property Type Distribution
Market Composition Insights for Joshua Tree
- The Joshua Tree Airbnb market composition is heavily skewed towards Entire Home/Apt listings, which make up 96.8% of the 1,181 active rentals. This indicates strong guest preference for privacy and space.
- Looking at the property type distribution in Joshua Tree, House properties are the most common (87.4%), reflecting the local real estate landscape.
- Houses represent a significant 87.4% portion, catering likely to families or larger groups.
- Smaller segments like hotel/boutique, unique stays, others, apartment/condo (combined 5.7%) offer potential for unique stay experiences.
Joshua Tree Airbnb Room Capacity Analysis (2026): Bedroom Distribution
Distribution of Listings by Number of Bedrooms
Room Capacity Insights for Joshua Tree
- The dominant room capacity in Joshua Tree is 2 bedrooms listings, making up 37.7% of the market. This suggests a strong demand for properties suitable for couples or solo travelers.
- Together, 2 bedrooms and 3 bedrooms properties represent 65.1% of the active Airbnb listings in Joshua Tree, indicating a high concentration in these sizes.
- A significant 39.7% of listings offer 3+ bedrooms, catering to larger groups and families seeking more space in Joshua Tree.
Joshua Tree Vacation Rental Guest Capacity Trends (2026)
Distribution of Listings by Guest Capacity
Guest Capacity Insights for Joshua Tree
- The most common guest capacity trend in Joshua Tree vacation rentals is listings accommodating 4 guests (28.2%). This suggests the primary traveler segment is likely small families or groups.
- Properties designed for 4 guests and 6 guests dominate the Joshua Tree STR market, accounting for 54.2% of listings.
- 51.0% of properties accommodate 6+ guests, serving the market segment for larger families or group travel in Joshua Tree.
- On average, properties in Joshua Tree are equipped to host 5.3 guests.
Joshua Tree Airbnb Booking Patterns (2026): Available vs. Booked Days
Available Days Distribution
Booked Days Distribution
Booking Pattern Insights for Joshua Tree
- The most common availability pattern in Joshua Tree falls within the 181-270 days range, representing 35% of listings. This suggests many properties have significant open periods on their calendars.
- Approximately 63.2% of listings show high availability (181+ days open annually), indicating potential for increased bookings or specific owner usage patterns.
- For booked days, the 91-180 days range is most frequent in Joshua Tree (35%), reflecting common guest stay durations or potential owner blocking patterns.
- A notable 38.1% of properties secure long booking periods (181+ days booked per year), highlighting successful long-term rental strategies or significant owner usage.
Joshua Tree Airbnb Minimum Stay Requirements Analysis
Distribution of Listings by Minimum Night Requirement
1 Night
405 listings
34.3% of total
2 Nights
308 listings
26.1% of total
3 Nights
7 listings
0.6% of total
4-6 Nights
4 listings
0.3% of total
7-29 Nights
12 listings
1% of total
30+ Nights
444 listings
37.6% of total
Key Insights
- The most prevalent minimum stay requirement in Joshua Tree is 30+ Nights, adopted by 37.6% of listings. This highlights the market's preference for longer commitments.
- A strong majority (60.4%) of the Joshua Tree Airbnb data shows acceptance of very short stays (1-2 nights), indicating a dynamic, high-turnover market.
- A significant segment (37.6%) caters to monthly stays (30+ nights) in Joshua Tree, pointing to opportunities in the extended-stay market.
Recommendations
- Align with the market by considering a 30+ Nights minimum stay, as 37.6% of Joshua Tree hosts use this setting.
- Explore offering discounts for stays of 30+ nights to attract the 37.6% of the market seeking extended stays.
- Adjust minimum nights based on seasonality – potentially shorter during low season and longer during peak demand periods in Joshua Tree.
Joshua Tree Airbnb Cancellation Policy Trends Analysis (2026)
Limited
39 listings
3.3% of total
Super Strict 30 Days
15 listings
1.3% of total
Super Strict 60 Days
2 listings
0.2% of total
Flexible
171 listings
14.5% of total
Moderate
307 listings
26% of total
Firm
417 listings
35.3% of total
Strict
229 listings
19.4% of total
Cancellation Policy Insights for Joshua Tree
- The prevailing Airbnb cancellation policy trend in Joshua Tree is Firm, used by 35.3% of listings.
- A majority (54.7%) of hosts in Joshua Tree utilize Firm or Strict policies, indicating a market where hosts prioritize booking security.
Recommendations for Hosts
- Consider adopting a Firm policy to align with the 35.3% market standard in Joshua Tree.
- Regularly review your cancellation policy against competitors and market demand shifts in Joshua Tree.
Joshua Tree STR Booking Lead Time Analysis (2026)
Average Booking Lead Time by Month
Booking Lead Time Insights for Joshua Tree
- The overall average booking lead time for vacation rentals in Joshua Tree is 35 days.
- Guests book furthest in advance for stays during April (average 44 days), likely coinciding with peak travel demand or local events.
- The shortest booking windows occur for stays in July (average 28 days), indicating more last-minute travel plans during this time.
- Seasonally, Fall (40 days avg.) sees the longest lead times, while Summer (29 days avg.) has the shortest, reflecting typical travel planning cycles.
Recommendations for Hosts
- Use the overall average lead time (35 days) as a baseline for your pricing and availability strategy in Joshua Tree.
- Target marketing efforts for the Fall season well in advance (at least 40 days) to capture early planners.
- Monitor your own booking lead times against these Joshua Tree averages to identify opportunities for dynamic pricing adjustments.
Popular & Essential Airbnb Amenities in Joshua Tree (2026)
Amenity Prevalence
Amenity Insights for Joshua Tree
- Essential amenities in Joshua Tree that guests expect include: Wifi, Free parking on premises, Heating, Air conditioning, Smoke alarm, Hot water, Carbon monoxide alarm, Coffee maker, Kitchen, Cooking basics. Lacking these (any) could significantly impact bookings.
Recommendations for Hosts
- Ensure your listing includes all essential amenities for Joshua Tree: Wifi, Free parking on premises, Heating, Air conditioning, Smoke alarm, Hot water, Carbon monoxide alarm, Coffee maker, Kitchen, Cooking basics.
- Prioritize adding missing essentials: Wifi, Free parking on premises, Heating, Air conditioning, Smoke alarm, Hot water, Carbon monoxide alarm, Coffee maker, Kitchen, Cooking basics.
- Highlight unique or less common amenities you offer (e.g., hot tub, dedicated workspace, EV charger) in your listing description and photos.
- Regularly check competitor amenities in Joshua Tree to stay competitive.
Joshua Tree Airbnb Guest Demographics & Profile Analysis (2026)
Guest Profile Summary for Joshua Tree
- The typical guest profile for Airbnb in Joshua Tree consists of primarily domestic travelers (91%), often arriving from nearby Los Angeles, typically belonging to the Post-2000s (Gen Z/Alpha) group (50%), primarily speaking English or Spanish.
- Domestic travelers account for 90.8% of guests.
- Key international markets include United States (90.8%) and United Kingdom (1.9%).
- Top languages spoken are English (59.8%) followed by Spanish (16.6%).
- A significant demographic segment is the Post-2000s (Gen Z/Alpha) group, representing 50% of guests.
Recommendations for Hosts
- Target domestic marketing efforts towards travelers from Los Angeles and San Diego.
- Tailor amenities and listing descriptions to appeal to the dominant Post-2000s (Gen Z/Alpha) demographic (e.g., highlight fast WiFi, smart home features, local guides).
- Highlight unique local experiences or amenities relevant to the primary guest profile.
- Consider seasonal promotions aligned with peak travel times for key origin markets.
Nearby Short-Term Rental Market Comparison
How does the Joshua Tree Airbnb market stack up against its neighbors? Compare key performance metrics like average monthly revenue, ADR, and occupancy rates in surrounding areas to understand the broader regional STR landscape.
| Market | Active Properties | Monthly Revenue | Daily Rate | Avg. Occupancy |
|---|---|---|---|---|
| Newport Beach | 1,273 | $8,950 | $744.06 | 47% |
| Thousand Palms | 33 | $8,119 | $725.48 | 36% |
| GlenOak Hills | 41 | $7,394 | $648.65 | 41% |
| Bermuda Dunes | 143 | $7,324 | $664.90 | 39% |
| Rancho Santa Fe | 34 | $6,074 | $913.16 | 35% |
| Encinitas | 559 | $5,940 | $543.93 | 49% |
| Santa Margarita Ranchos | 18 | $5,614 | $506.60 | 36% |
| Indio | 1,427 | $5,394 | $584.45 | 37% |
| Coachella | 367 | $5,300 | $649.22 | 38% |
| Pioneertown | 98 | $5,283 | $475.08 | 41% |