Inglewood Airbnb Market Analysis 2026: Short Term Rental Data & Vacation Rental Statistics in California, United States
Is Airbnb profitable in Inglewood in 2026? Explore comprehensive Airbnb analytics for Inglewood, California, United States to uncover income potential. This 2026 STR market report for Inglewood, based on AirROI data from February 2025 to January 2026, reveals key trends in the market of 277 active listings.
Whether you're considering an Airbnb investment in Inglewood, optimizing your existing vacation rental, or exploring rental arbitrage opportunities, understanding the Inglewood Airbnb data is crucial. Navigating the high regulation landscape is key to maximizing your short term rental income potential. Let's dive into the specifics.
Key Inglewood Airbnb Performance Metrics Overview
Monthly Airbnb Revenue Variations & Income Potential in Inglewood (2026)
Understanding the monthly revenue variations for Airbnb listings in Inglewood is key to maximizing your short term rental income potential. Seasonality significantly impacts earnings. Our analysis, based on data from the past 12 months, shows that the peak revenue month for STRs in Inglewood is typically July, while January often presents the lowest earnings, highlighting opportunities for strategic pricing adjustments during shoulder and low seasons. Explore the typical Airbnb income in Inglewood across different performance tiers:
- Best-in-class properties (Top 10%) achieve $5,720+ monthly, often utilizing dynamic pricing and superior guest experiences.
- Strong performing properties (Top 25%) earn $3,992 or more, indicating effective management and desirable locations/amenities.
- Typical properties (Median) generate around $2,396 per month, representing the average market performance.
- Entry-level properties (Bottom 25%) see earnings around $1,132, often with potential for optimization.
Average Monthly Airbnb Earnings Trend in Inglewood
Inglewood Airbnb Occupancy Rate Trends (2026)
Maximize your bookings by understanding the Inglewood STR occupancy trends. Seasonal demand shifts significantly influence how often properties are booked. Typically, Octobersees the highest demand (peak season occupancy), while January experiences the lowest (low season). Effective strategies, like adjusting minimum stays or offering promotions, can boost occupancy during slower periods. Here's how different property tiers perform in Inglewood:
- Best-in-class properties (Top 10%) achieve 84%+ occupancy, indicating high desirability and potentially optimized availability.
- Strong performing properties (Top 25%) maintain 70% or higher occupancy, suggesting good market fit and guest satisfaction.
- Typical properties (Median) have an occupancy rate around 46%.
- Entry-level properties (Bottom 25%) average 23% occupancy, potentially facing higher vacancy.
Average Monthly Occupancy Rate Trend in Inglewood
Average Daily Rate (ADR) Airbnb Trends in Inglewood (2026)
Effective short term rental pricing strategy in Inglewood involves understanding monthly ADR fluctuations. The Average Daily Rate (ADR) for Airbnb in Inglewood typically peaks in June and dips lowest during February. Leveraging Airbnb dynamic pricing tools or strategies based on this seasonality can significantly boost revenue. Here's a look at the typical nightly rates achieved:
- Best-in-class properties (Top 10%) command rates of $351+ per night, often due to premium features or locations.
- Strong performing properties (Top 25%) achieve nightly rates of $228 or more.
- Typical properties (Median) charge around $143 per night.
- Entry-level properties (Bottom 25%) earn around $100 per night.
Average Daily Rate (ADR) Trend by Month in Inglewood
Get Live Inglewood Market Intelligence 👇

Explore Real-time Analytics
Airbnb Seasonality Analysis & Trends in Inglewood (2026)
Peak Season (July, June, May)
- Revenue averages $3,263 per month
- Occupancy rates average 49.0%
- Daily rates average $191
Shoulder Season
- Revenue averages $2,897 per month
- Occupancy maintains around 47.8%
- Daily rates hold near $184
Low Season (January, February, March)
- Revenue drops to average $2,387 per month
- Occupancy decreases to average 42.4%
- Daily rates adjust to average $178
Seasonality Insights for Inglewood
- The Airbnb seasonality in Inglewood shows moderate seasonality with distinct peak and low periods. While the sections above show seasonal averages, it's also insightful to look at the extremes:
- During the high season, the absolute peak month showcases Inglewood's highest earning potential, with monthly revenues capable of climbing to $3,436, occupancy reaching a high of 51.7%, and ADRs peaking at $193.
- Conversely, the slowest single month of the year, typically falling within the low season, marks the market's lowest point. In this month, revenue might dip to $2,219, occupancy could drop to 36.8%, and ADRs may adjust down to $174.
- Understanding both the seasonal averages and these monthly peaks and troughs in revenue, occupancy, and ADR is crucial for maximizing your Airbnb profit potential in Inglewood.
Seasonal Strategies for Maximizing Profit
- Peak Season: Maximize revenue through premium pricing and potentially longer minimum stays. Ensure high availability.
- Low Season: Offer competitive pricing, special promotions (e.g., extended stay discounts), and flexible cancellation policies. Target off-season travelers like remote workers or budget-conscious guests.
- Shoulder Seasons: Implement dynamic pricing that balances peak and low rates. Target weekend travelers or specific events. Offer slightly more flexible terms than peak season.
- Regularly analyze your own performance against these Inglewood seasonality benchmarks and adjust your pricing and availability strategy accordingly.
Best Areas for Airbnb Investment in Inglewood (2026)
Exploring the top neighborhoods for short-term rentals in Inglewood? This section highlights key areas, outlining why they are attractive for hosts and guests, along with notable local attractions. Consider these locations based on your target guest profile and investment strategy.
| Neighborhood / Area | Why Host Here? (Target Guests & Appeal) | Key Attractions & Landmarks |
|---|---|---|
| North Inglewood | A vibrant neighborhood close to LAX and various entertainment options, making it ideal for travelers and visitors to Los Angeles. | Hollywood Park Casino, The Forum, SoFi Stadium, Los Angeles County Museum of Art, Kenneth Hahn State Recreation Area |
| Inglewood City Center | The bustling heart of Inglewood with shopping and dining options, popular among guests looking for convenience and local experiences. | Centinela Adobe, Inglewood Plaza, local restaurants and shops, city events, Inglewood Public Library |
| LAX Area | Proximity to Los Angeles International Airport makes this area a key location for short-term rentals catering to travelers and air passengers. | LAX Airport, Car rental services, Airport Hotels, catching flights, transit connections |
| West Inglewood | A growing area with diverse dining options and close proximity to community parks, appealing to families and group travelers. | Ruben Inglewood Park, local eateries, community events, family-friendly parks |
| Morningside Park | A residential neighborhood that offers a quiet atmosphere while still being near major attractions, suitable for families and longer stays. | Morningside Park, local markets, family-friendly activities, community centers |
| East Inglewood | Increasingly popular with investors due to affordable housing and potential for growth, attracting longer-term stays. | local schools, community organizations, neighborhood parks, urban development projects |
| South Inglewood | Close to major highways and public transport, making it easy for guests to travel within Los Angeles, ideal for those exploring the city. | suburban parks, shopping outlets, easy access to public transport, local community gatherings |
| Crenshaw District | Culturally rich area with historical significance, attracting visitors interested in exploring local history and culture. | Crenshaw Plaza, Soul Train Alley, cultural events, local music venues, historical landmarks |
Understanding Airbnb License Requirements & STR Laws in Inglewood (2026)
Yes, Inglewood, California, United States enforces high STR regulations. Obtaining a license and ensuring compliance is almost certainly required according to current 2026 STR laws. Always verify the latest short term rental regulations and Airbnb license requirements directly with local government authorities for Inglewood to ensure full compliance before hosting.
(Source: AirROI data, 2026, based on 40% licensed listings)
Top Performing Airbnb Properties in Inglewood (2026)
Benchmark your potential! Explore examples of top-performing Airbnb properties in Inglewoodbased on Trailing Twelve Month (TTM) revenue. Analyze their characteristics, revenue, occupancy rate, and ADR to understand what drives success in this market.

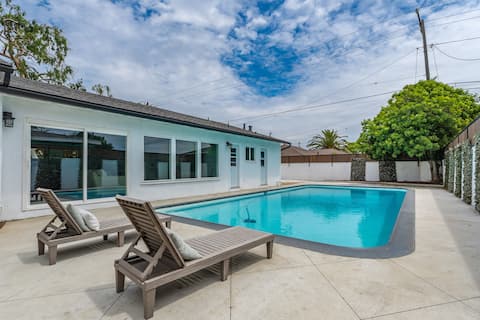
Spacious 5BR, LAX, Beach, SoFi-Sleeps 16, Events
Entire Place • 5 bedrooms
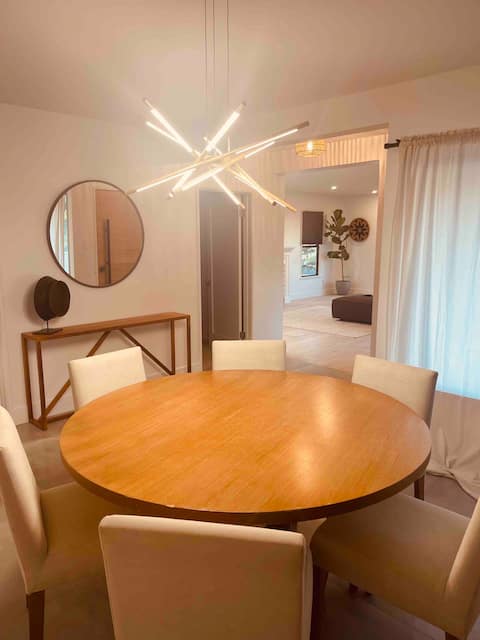
Modern Home close to SoFi Stadium, LAX & Beaches
Entire Place • 3 bedrooms
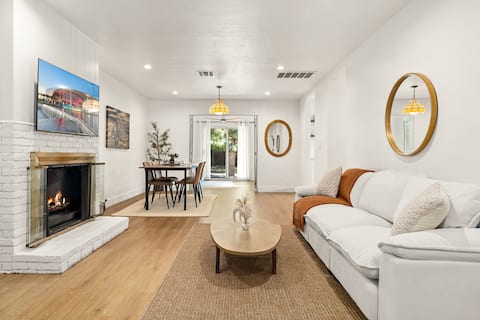
Near LAX, walk to SoFi, Ping-Pong, Peloton Bike
Entire Place • 3 bedrooms

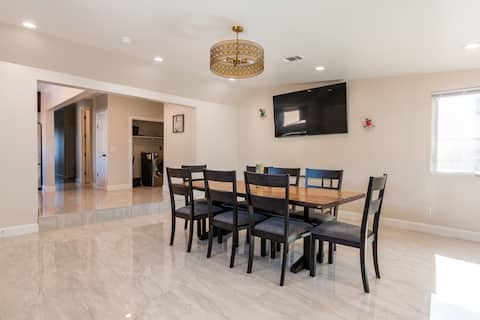
Inglewood home near sofi stadium & LAX
Entire Place • 2 bedrooms
1970s Inglewood 3BR Gem w Parking, W/D & Jacuzzi
Entire Place • 3 bedrooms
Spacious 5 BR Brand New HouseLAX/ SoFi/Kia/SpaceX/
Entire Place • 5 bedrooms
Note: Performance varies based on location, size, amenities, seasonality, and management quality. Data reflects the past 12 months.
Top Performing Airbnb Hosts in Inglewood (2026)
Learn from the best! This table showcases top-performing Airbnb hosts in Inglewood based on the number of properties managed and estimated total revenue over the past year. Analyze their scale and performance metrics.
| Host Name | Properties | Grossing Revenue | Stay Reviews | Avg Rating |
|---|---|---|---|---|
| Ofir | 7 | $176,328 | 227 | 4.77/5.0 |
| Elias | 3 | $159,668 | 278 | 4.84/5.0 |
| Daniel | 4 | $145,671 | 1158 | 4.91/5.0 |
| Ernesto | 2 | $126,999 | 286 | 4.89/5.0 |
| Lia | 1 | $119,072 | 203 | 4.88/5.0 |
| Blazer | 2 | $118,379 | 634 | 4.84/5.0 |
| Bardia | 1 | $114,728 | 129 | 4.84/5.0 |
| Supremna | 1 | $109,834 | 52 | 5.00/5.0 |
| Steve | 2 | $100,847 | 243 | 4.88/5.0 |
| Dora | 6 | $98,449 | 614 | 4.74/5.0 |
Analyzing the strategies of top hosts, such as their property selection, pricing, and guest communication, can offer valuable lessons for optimizing your own Airbnb operations in Inglewood.
Dive Deeper: Advanced Inglewood STR Market Data (2026)
Ready to unlock more insights? AirROI provides access to advanced metrics and comprehensive Airbnb data for Inglewood. Explore detailed analytics beyond this report to refine your investment strategy, optimize pricing, and maximize your vacation rental profits.
Explore Advanced MetricsInglewood Short-Term Rental Market Composition (2026): Property & Room Types
Room Type Distribution
Property Type Distribution
Market Composition Insights for Inglewood
- The Inglewood Airbnb market composition is heavily skewed towards Entire Home/Apt listings, which make up 79.4% of the 277 active rentals. This indicates strong guest preference for privacy and space.
- Looking at the property type distribution in Inglewood, House properties are the most common (62.5%), reflecting the local real estate landscape.
- Houses represent a significant 62.5% portion, catering likely to families or larger groups.
- The presence of 11.9% Hotel/Boutique listings indicates integration with traditional hospitality.
Inglewood Airbnb Room Capacity Analysis (2026): Bedroom Distribution
Distribution of Listings by Number of Bedrooms
Room Capacity Insights for Inglewood
- The dominant room capacity in Inglewood is 1 bedroom listings, making up 30% of the market. This suggests a strong demand for properties suitable for couples or solo travelers.
- Together, 1 bedroom and 2 bedrooms properties represent 58.2% of the active Airbnb listings in Inglewood, indicating a high concentration in these sizes.
Inglewood Vacation Rental Guest Capacity Trends (2026)
Distribution of Listings by Guest Capacity
Guest Capacity Insights for Inglewood
- The most common guest capacity trend in Inglewood vacation rentals is listings accommodating 4 guests (22.4%). This suggests the primary traveler segment is likely small families or groups.
- Properties designed for 4 guests and 2 guests dominate the Inglewood STR market, accounting for 41.2% of listings.
- 24.9% of properties accommodate 6+ guests, serving the market segment for larger families or group travel in Inglewood.
- On average, properties in Inglewood are equipped to host 3.8 guests.
Inglewood Airbnb Booking Patterns (2026): Available vs. Booked Days
Available Days Distribution
Booked Days Distribution
Booking Pattern Insights for Inglewood
- The most common availability pattern in Inglewood falls within the 271-366 days range, representing 49.8% of listings. This suggests many properties have significant open periods on their calendars.
- Approximately 76.2% of listings show high availability (181+ days open annually), indicating potential for increased bookings or specific owner usage patterns.
- For booked days, the 31-90 days range is most frequent in Inglewood (26.7%), reflecting common guest stay durations or potential owner blocking patterns.
- A notable 24.5% of properties secure long booking periods (181+ days booked per year), highlighting successful long-term rental strategies or significant owner usage.
Inglewood Airbnb Minimum Stay Requirements Analysis
Distribution of Listings by Minimum Night Requirement
1 Night
55 listings
19.9% of total
2 Nights
29 listings
10.5% of total
3 Nights
5 listings
1.8% of total
4-6 Nights
8 listings
2.9% of total
7-29 Nights
22 listings
7.9% of total
30+ Nights
158 listings
57% of total
Key Insights
- The most prevalent minimum stay requirement in Inglewood is 30+ Nights, adopted by 57% of listings. This highlights the market's preference for longer commitments.
- A significant segment (57%) caters to monthly stays (30+ nights) in Inglewood, pointing to opportunities in the extended-stay market.
Recommendations
- Align with the market by considering a 30+ Nights minimum stay, as 57% of Inglewood hosts use this setting.
- If feasible, allowing 1-night stays, especially midweek or during low season, could capture last-minute bookings, as only 19.9% currently do.
- Explore offering discounts for stays of 30+ nights to attract the 57% of the market seeking extended stays.
- Adjust minimum nights based on seasonality – potentially shorter during low season and longer during peak demand periods in Inglewood.
Inglewood Airbnb Cancellation Policy Trends Analysis (2026)
Limited
1 listings
0.4% of total
Super Strict 30 Days
1 listings
0.4% of total
Flexible
68 listings
24.7% of total
Moderate
57 listings
20.7% of total
Firm
80 listings
29.1% of total
Strict
68 listings
24.7% of total
Cancellation Policy Insights for Inglewood
- The prevailing Airbnb cancellation policy trend in Inglewood is Firm, used by 29.1% of listings.
- A majority (53.8%) of hosts in Inglewood utilize Firm or Strict policies, indicating a market where hosts prioritize booking security.
Recommendations for Hosts
- Consider adopting a Firm policy to align with the 29.1% market standard in Inglewood.
- Regularly review your cancellation policy against competitors and market demand shifts in Inglewood.
Inglewood STR Booking Lead Time Analysis (2026)
Average Booking Lead Time by Month
Booking Lead Time Insights for Inglewood
- The overall average booking lead time for vacation rentals in Inglewood is 34 days.
- Guests book furthest in advance for stays during August (average 48 days), likely coinciding with peak travel demand or local events.
- The shortest booking windows occur for stays in January (average 22 days), indicating more last-minute travel plans during this time.
- Seasonally, Summer (44 days avg.) sees the longest lead times, while Winter (25 days avg.) has the shortest, reflecting typical travel planning cycles.
Recommendations for Hosts
- Use the overall average lead time (34 days) as a baseline for your pricing and availability strategy in Inglewood.
- For August stays, consider implementing length-of-stay discounts or slightly higher rates for bookings made less than 48 days out to capitalize on advance planning.
- Target marketing efforts for the Summer season well in advance (at least 44 days) to capture early planners.
- Monitor your own booking lead times against these Inglewood averages to identify opportunities for dynamic pricing adjustments.
Popular & Essential Airbnb Amenities in Inglewood (2026)
Amenity Prevalence
Amenity Insights for Inglewood
- Essential amenities in Inglewood that guests expect include: Wifi, Smoke alarm, Hot water, TV. Lacking these (any) could significantly impact bookings.
- Popular amenities like Carbon monoxide alarm, Heating, Microwave are common but not universal. Offering these can provide a competitive edge.
Recommendations for Hosts
- Ensure your listing includes all essential amenities for Inglewood: Wifi, Smoke alarm, Hot water, TV.
- Prioritize adding missing essentials: Wifi, Smoke alarm, Hot water, TV.
- Consider adding popular differentiators like Carbon monoxide alarm or Heating to increase appeal.
- Highlight unique or less common amenities you offer (e.g., hot tub, dedicated workspace, EV charger) in your listing description and photos.
- Regularly check competitor amenities in Inglewood to stay competitive.
Inglewood Airbnb Guest Demographics & Profile Analysis (2026)
Guest Profile Summary for Inglewood
- The typical guest profile for Airbnb in Inglewood consists of primarily domestic travelers (86%), often arriving from nearby Los Angeles, typically belonging to the Post-2000s (Gen Z/Alpha) group (50%), primarily speaking English or Spanish.
- Domestic travelers account for 85.7% of guests.
- Key international markets include United States (85.7%) and Canada (2.9%).
- Top languages spoken are English (60.1%) followed by Spanish (21.9%).
- A significant demographic segment is the Post-2000s (Gen Z/Alpha) group, representing 50% of guests.
Recommendations for Hosts
- Target domestic marketing efforts towards travelers from Los Angeles and San Diego.
- Tailor amenities and listing descriptions to appeal to the dominant Post-2000s (Gen Z/Alpha) demographic (e.g., highlight fast WiFi, smart home features, local guides).
- Highlight unique local experiences or amenities relevant to the primary guest profile.
- Consider seasonal promotions aligned with peak travel times for key origin markets.
Nearby Short-Term Rental Market Comparison
How does the Inglewood Airbnb market stack up against its neighbors? Compare key performance metrics like average monthly revenue, ADR, and occupancy rates in surrounding areas to understand the broader regional STR landscape.
| Market | Active Properties | Monthly Revenue | Daily Rate | Avg. Occupancy |
|---|---|---|---|---|
| Montecito | 127 | $10,744 | $950.35 | 51% |
| Newport Beach | 1,273 | $8,950 | $744.06 | 47% |
| Malibu | 251 | $8,293 | $1263.89 | 35% |
| Manhattan Beach | 267 | $7,875 | $585.30 | 53% |
| Del Mar | 128 | $7,011 | $671.56 | 45% |
| Toro Canyon | 33 | $6,935 | $717.58 | 42% |
| Avalon | 249 | $6,705 | $696.60 | 38% |
| Summerland | 88 | $6,323 | $494.72 | 49% |
| Rancho Santa Fe | 34 | $6,074 | $913.16 | 35% |
| Unincorporated Santa Monica Mountains | 119 | $6,008 | $699.60 | 38% |