Indio Airbnb Market Analysis 2026: Short Term Rental Data & Vacation Rental Statistics in California, United States
Is Airbnb profitable in Indio in 2026? Explore comprehensive Airbnb analytics for Indio, California, United States to uncover income potential. This 2026 STR market report for Indio, based on AirROI data from February 2025 to January 2026, reveals key trends in the bustling market of 1,427 active listings.
Whether you're considering an Airbnb investment in Indio, optimizing your existing vacation rental, or exploring rental arbitrage opportunities, understanding the Indio Airbnb data is crucial. Navigating the high regulation landscape is key to maximizing your short term rental income potential. Let's dive into the specifics.
Key Indio Airbnb Performance Metrics Overview
Monthly Airbnb Revenue Variations & Income Potential in Indio (2026)
Understanding the monthly revenue variations for Airbnb listings in Indio is key to maximizing your short term rental income potential. Seasonality significantly impacts earnings. Our analysis, based on data from the past 12 months, shows that the peak revenue month for STRs in Indio is typically April, while September often presents the lowest earnings, highlighting opportunities for strategic pricing adjustments during shoulder and low seasons. Explore the typical Airbnb income in Indio across different performance tiers:
- Best-in-class properties (Top 10%) achieve $15,501+ monthly, often utilizing dynamic pricing and superior guest experiences.
- Strong performing properties (Top 25%) earn $9,363 or more, indicating effective management and desirable locations/amenities.
- Typical properties (Median) generate around $5,423 per month, representing the average market performance.
- Entry-level properties (Bottom 25%) see earnings around $2,720, often with potential for optimization.
Average Monthly Airbnb Earnings Trend in Indio
Indio Airbnb Occupancy Rate Trends (2026)
Maximize your bookings by understanding the Indio STR occupancy trends. Seasonal demand shifts significantly influence how often properties are booked. Typically, Marchsees the highest demand (peak season occupancy), while September experiences the lowest (low season). Effective strategies, like adjusting minimum stays or offering promotions, can boost occupancy during slower periods. Here's how different property tiers perform in Indio:
- Best-in-class properties (Top 10%) achieve 70%+ occupancy, indicating high desirability and potentially optimized availability.
- Strong performing properties (Top 25%) maintain 53% or higher occupancy, suggesting good market fit and guest satisfaction.
- Typical properties (Median) have an occupancy rate around 36%.
- Entry-level properties (Bottom 25%) average 21% occupancy, potentially facing higher vacancy.
Average Monthly Occupancy Rate Trend in Indio
Average Daily Rate (ADR) Airbnb Trends in Indio (2026)
Effective short term rental pricing strategy in Indio involves understanding monthly ADR fluctuations. The Average Daily Rate (ADR) for Airbnb in Indio typically peaks in April and dips lowest during August. Leveraging Airbnb dynamic pricing tools or strategies based on this seasonality can significantly boost revenue. Here's a look at the typical nightly rates achieved:
- Best-in-class properties (Top 10%) command rates of $1,082+ per night, often due to premium features or locations.
- Strong performing properties (Top 25%) achieve nightly rates of $678 or more.
- Typical properties (Median) charge around $466 per night.
- Entry-level properties (Bottom 25%) earn around $318 per night.
Average Daily Rate (ADR) Trend by Month in Indio
Get Live Indio Market Intelligence 👇

Explore Real-time Analytics
Airbnb Seasonality Analysis & Trends in Indio (2026)
Peak Season (April, March, February)
- Revenue averages $11,382 per month
- Occupancy rates average 51.2%
- Daily rates average $667
Shoulder Season
- Revenue averages $6,818 per month
- Occupancy maintains around 35.8%
- Daily rates hold near $565
Low Season (January, September, October)
- Revenue drops to average $5,321 per month
- Occupancy decreases to average 29.1%
- Daily rates adjust to average $562
Seasonality Insights for Indio
- The Airbnb seasonality in Indio shows highly seasonal trends requiring careful strategy. While the sections above show seasonal averages, it's also insightful to look at the extremes:
- During the high season, the absolute peak month showcases Indio's highest earning potential, with monthly revenues capable of climbing to $14,563, occupancy reaching a high of 58.8%, and ADRs peaking at $839.
- Conversely, the slowest single month of the year, typically falling within the low season, marks the market's lowest point. In this month, revenue might dip to $4,529, occupancy could drop to 26.4%, and ADRs may adjust down to $513.
- Understanding both the seasonal averages and these monthly peaks and troughs in revenue, occupancy, and ADR is crucial for maximizing your Airbnb profit potential in Indio.
Seasonal Strategies for Maximizing Profit
- Peak Season: Maximize revenue through premium pricing and potentially longer minimum stays. Ensure high availability.
- Low Season: Offer competitive pricing, special promotions (e.g., extended stay discounts), and flexible cancellation policies. Target off-season travelers like remote workers or budget-conscious guests.
- Shoulder Seasons: Implement dynamic pricing that balances peak and low rates. Target weekend travelers or specific events. Offer slightly more flexible terms than peak season.
- Regularly analyze your own performance against these Indio seasonality benchmarks and adjust your pricing and availability strategy accordingly.
Best Areas for Airbnb Investment in Indio (2026)
Exploring the top neighborhoods for short-term rentals in Indio? This section highlights key areas, outlining why they are attractive for hosts and guests, along with notable local attractions. Consider these locations based on your target guest profile and investment strategy.
| Neighborhood / Area | Why Host Here? (Target Guests & Appeal) | Key Attractions & Landmarks |
|---|---|---|
| Coachella Valley | Known for the famous Coachella Valley Music and Arts Festival, this area attracts music lovers from around the world. It offers various outdoor activities and a vibrant cultural scene. | Coachella Festival, Empire Polo Club, Desert X, Joshua Tree National Park, Palm Springs Art Museum |
| Indio Hills | A quiet area with beautiful desert landscapes and proximity to nature. It's great for those looking for a peaceful retreat while still being near attractions. | Indio Hills Eco Center, Golf courses, Hiking trails, Outdoor parks |
| Old Town Indio | Historic district with charming shops, cafes, and cultural events. It's becoming increasingly popular among travelers wanting a local experience. | Indio Historical Museum, Cultural festivals, Local restaurants, Art galleries |
| Shadow Hills | A scenic area known for its spacious homes and equestrian properties. Ideal for guests seeking a rural escape with close access to city amenities. | Shadow Hills Park, Horseback riding, Golf clubs, Nature trails |
| La Quinta | Just a short drive from Indio, known for its luxury resorts and desert lifestyle. Attracts vacationers looking for upscale relaxation. | La Quinta Resort & Club, Old Town La Quinta, Golf courses, La Quinta Museum |
| Thermal | Famed for its hot springs and spa facilities, this area is perfect for wellness travelers and those looking to unwind. | Thermal Hot Springs, Wellness retreats, Golf courses |
| Desert Hot Springs | Known for its mineral springs and spa options, this area is a popular destination for relaxation and health-focused travelers. | Desert Hot Springs Spa Hotel, Natural Hot Springs, State Park, Wellness centers |
| Palm Desert | A neighboring city with shopping, dining, and outdoor activities, it's a favorite for visitors looking for a vibrant atmosphere. | El Paseo Shopping District, Living Desert Zoo and Gardens, Desert Willow Golf Resort, Art galleries |
Understanding Airbnb License Requirements & STR Laws in Indio (2026)
Yes, Indio, California, United States enforces high STR regulations. Obtaining a license and ensuring compliance is almost certainly required according to current 2026 STR laws. Always verify the latest short term rental regulations and Airbnb license requirements directly with local government authorities for Indio to ensure full compliance before hosting.
(Source: AirROI data, 2026, based on 89% licensed listings)
Top Performing Airbnb Properties in Indio (2026)
Benchmark your potential! Explore examples of top-performing Airbnb properties in Indiobased on Trailing Twelve Month (TTM) revenue. Analyze their characteristics, revenue, occupancy rate, and ADR to understand what drives success in this market.
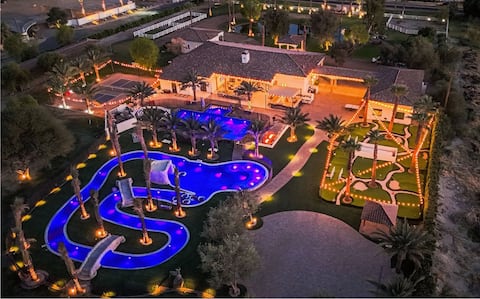
Stallion Estate Lazy River, Bowling & Theater
Entire Place • 11 bedrooms
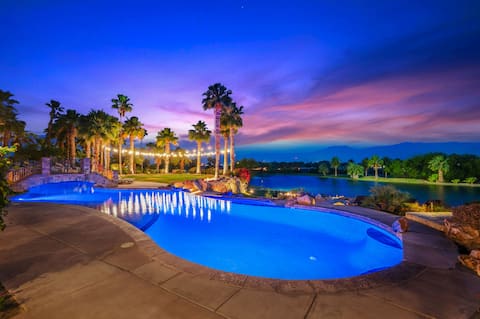
Luxury Estate, Pickleball, Lake, 100ft Pool, Golf
Entire Place • 8 bedrooms

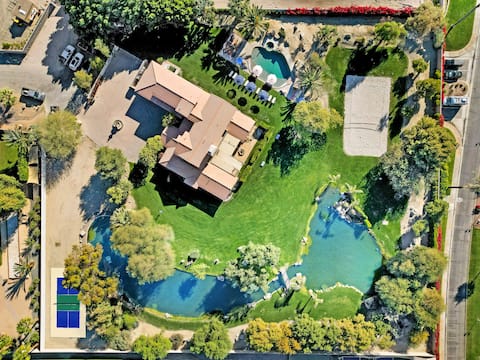
9 BR, 17 Beds, 8 Bath, Pool, Spa, Golf, Pickleball
Entire Place • 9 bedrooms
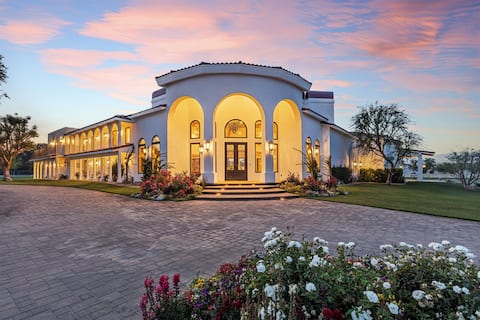
Drop-dead gorgeous villa-all amenities-13 bedrooms
Entire Place • 13 bedrooms
Pickleball-Sauna-Beach-V'Ball-Putt+Disc Golf-More!
Entire Place • 10 bedrooms

All Inclusive-1/2 Acre Epic Journey-7BR-6BA
Entire Place • 7 bedrooms
Note: Performance varies based on location, size, amenities, seasonality, and management quality. Data reflects the past 12 months.
Top Performing Airbnb Hosts in Indio (2026)
Learn from the best! This table showcases top-performing Airbnb hosts in Indio based on the number of properties managed and estimated total revenue over the past year. Analyze their scale and performance metrics.
| Host Name | Properties | Grossing Revenue | Stay Reviews | Avg Rating |
|---|---|---|---|---|
| Steve | 35 | $6,694,380 | 3909 | 4.99/5.0 |
| Vacanza Stays | 21 | $3,515,273 | 1223 | 4.76/5.0 |
| Hector | 17 | $3,019,805 | 365 | 4.90/5.0 |
| Fieldtrip | 10 | $2,850,790 | 948 | 4.99/5.0 |
| Anna | 31 | $2,819,932 | 1718 | 4.92/5.0 |
| Drew | 9 | $2,236,317 | 429 | 4.99/5.0 |
| AvantStay Palm Springs | 19 | $1,689,353 | 781 | 4.82/5.0 |
| Sean & Justin | 26 | $1,658,540 | 645 | 4.86/5.0 |
| Michele | 20 | $1,589,867 | 1806 | 4.87/5.0 |
| 5 Star Property Management | 23 | $1,407,985 | 1427 | 4.87/5.0 |
Analyzing the strategies of top hosts, such as their property selection, pricing, and guest communication, can offer valuable lessons for optimizing your own Airbnb operations in Indio.
Dive Deeper: Advanced Indio STR Market Data (2026)
Ready to unlock more insights? AirROI provides access to advanced metrics and comprehensive Airbnb data for Indio. Explore detailed analytics beyond this report to refine your investment strategy, optimize pricing, and maximize your vacation rental profits.
Explore Advanced MetricsIndio Short-Term Rental Market Composition (2026): Property & Room Types
Room Type Distribution
Property Type Distribution
Market Composition Insights for Indio
- The Indio Airbnb market composition is heavily skewed towards Entire Home/Apt listings, which make up 95.4% of the 1,427 active rentals. This indicates strong guest preference for privacy and space.
- Looking at the property type distribution in Indio, House properties are the most common (85.7%), reflecting the local real estate landscape.
- Houses represent a significant 85.7% portion, catering likely to families or larger groups.
- Smaller segments like hotel/boutique, others, outdoor/unique, unique stays (combined 4.2%) offer potential for unique stay experiences.
Indio Airbnb Room Capacity Analysis (2026): Bedroom Distribution
Distribution of Listings by Number of Bedrooms
Room Capacity Insights for Indio
- The dominant room capacity in Indio is 4 bedrooms listings, making up 29.4% of the market. This suggests a strong demand for properties suitable for families or small groups.
- Together, 4 bedrooms and 3 bedrooms properties represent 55.3% of the active Airbnb listings in Indio, indicating a high concentration in these sizes.
- A significant 78.1% of listings offer 3+ bedrooms, catering to larger groups and families seeking more space in Indio.
Indio Vacation Rental Guest Capacity Trends (2026)
Distribution of Listings by Guest Capacity
Guest Capacity Insights for Indio
- The most common guest capacity trend in Indio vacation rentals is listings accommodating 8+ guests (71.5%). This suggests the primary traveler segment is likely larger groups.
- Properties designed for 8+ guests and 6 guests dominate the Indio STR market, accounting for 84.7% of listings.
- 86.5% of properties accommodate 6+ guests, serving the market segment for larger families or group travel in Indio.
- On average, properties in Indio are equipped to host 7.0 guests.
Indio Airbnb Booking Patterns (2026): Available vs. Booked Days
Available Days Distribution
Booked Days Distribution
Booking Pattern Insights for Indio
- The most common availability pattern in Indio falls within the 271-366 days range, representing 52.6% of listings. This suggests many properties have significant open periods on their calendars.
- Approximately 88.0% of listings show high availability (181+ days open annually), indicating potential for increased bookings or specific owner usage patterns.
- For booked days, the 91-180 days range is most frequent in Indio (36.2%), reflecting common guest stay durations or potential owner blocking patterns.
- A notable 13.2% of properties secure long booking periods (181+ days booked per year), highlighting successful long-term rental strategies or significant owner usage.
Indio Airbnb Minimum Stay Requirements Analysis
Distribution of Listings by Minimum Night Requirement
1 Night
135 listings
9.5% of total
2 Nights
392 listings
27.5% of total
3 Nights
123 listings
8.6% of total
4-6 Nights
54 listings
3.8% of total
7-29 Nights
28 listings
2% of total
30+ Nights
695 listings
48.7% of total
Key Insights
- The most prevalent minimum stay requirement in Indio is 30+ Nights, adopted by 48.7% of listings. This highlights the market's preference for longer commitments.
- A significant segment (48.7%) caters to monthly stays (30+ nights) in Indio, pointing to opportunities in the extended-stay market.
Recommendations
- Align with the market by considering a 30+ Nights minimum stay, as 48.7% of Indio hosts use this setting.
- If feasible, allowing 1-night stays, especially midweek or during low season, could capture last-minute bookings, as only 9.5% currently do.
- Explore offering discounts for stays of 30+ nights to attract the 48.7% of the market seeking extended stays.
- Adjust minimum nights based on seasonality – potentially shorter during low season and longer during peak demand periods in Indio.
Indio Airbnb Cancellation Policy Trends Analysis (2026)
Super Strict 60 Days
54 listings
3.8% of total
Super Strict 30 Days
104 listings
7.3% of total
Limited
25 listings
1.8% of total
Flexible
100 listings
7% of total
Moderate
135 listings
9.5% of total
Firm
579 listings
40.7% of total
Strict
424 listings
29.8% of total
Cancellation Policy Insights for Indio
- The prevailing Airbnb cancellation policy trend in Indio is Firm, used by 40.7% of listings.
- A majority (70.5%) of hosts in Indio utilize Firm or Strict policies, indicating a market where hosts prioritize booking security.
Recommendations for Hosts
- Consider adopting a Firm policy to align with the 40.7% market standard in Indio.
- Regularly review your cancellation policy against competitors and market demand shifts in Indio.
Indio STR Booking Lead Time Analysis (2026)
Average Booking Lead Time by Month
Booking Lead Time Insights for Indio
- The overall average booking lead time for vacation rentals in Indio is 63 days.
- Guests book furthest in advance for stays during April (average 104 days), likely coinciding with peak travel demand or local events.
- The shortest booking windows occur for stays in August (average 31 days), indicating more last-minute travel plans during this time.
- Seasonally, Spring (75 days avg.) sees the longest lead times, while Summer (32 days avg.) has the shortest, reflecting typical travel planning cycles.
Recommendations for Hosts
- Use the overall average lead time (63 days) as a baseline for your pricing and availability strategy in Indio.
- For April stays, consider implementing length-of-stay discounts or slightly higher rates for bookings made less than 104 days out to capitalize on advance planning.
- Target marketing efforts for the Spring season well in advance (at least 75 days) to capture early planners.
- Monitor your own booking lead times against these Indio averages to identify opportunities for dynamic pricing adjustments.
Popular & Essential Airbnb Amenities in Indio (2026)
Amenity Prevalence
Amenity Insights for Indio
- Essential amenities in Indio that guests expect include: Air conditioning, Wifi, Smoke alarm, TV, Carbon monoxide alarm, Free parking on premises, Kitchen. Lacking these (any) could significantly impact bookings.
- Popular amenities like Washer, Heating, Pool are common but not universal. Offering these can provide a competitive edge.
- A pool is a highly desired but not standard amenity, making it a key feature for attracting guests seeking leisure in Indio.
Recommendations for Hosts
- Ensure your listing includes all essential amenities for Indio: Air conditioning, Wifi, Smoke alarm, TV, Carbon monoxide alarm, Free parking on premises, Kitchen.
- Prioritize adding missing essentials: Air conditioning, Wifi, Smoke alarm, TV, Carbon monoxide alarm, Free parking on premises, Kitchen.
- Consider adding popular differentiators like Washer or Heating to increase appeal.
- Highlight unique or less common amenities you offer (e.g., hot tub, dedicated workspace, EV charger) in your listing description and photos.
- Regularly check competitor amenities in Indio to stay competitive.
Indio Airbnb Guest Demographics & Profile Analysis (2026)
Guest Profile Summary for Indio
- The typical guest profile for Airbnb in Indio consists of primarily domestic travelers (94%), often arriving from nearby Los Angeles, typically belonging to the Post-2000s (Gen Z/Alpha) group (50%), primarily speaking English or Spanish.
- Domestic travelers account for 93.8% of guests.
- Key international markets include United States (93.8%) and Canada (3.7%).
- Top languages spoken are English (64%) followed by Spanish (22.1%).
- A significant demographic segment is the Post-2000s (Gen Z/Alpha) group, representing 50% of guests.
Recommendations for Hosts
- Target domestic marketing efforts towards travelers from Los Angeles and San Diego.
- Tailor amenities and listing descriptions to appeal to the dominant Post-2000s (Gen Z/Alpha) demographic (e.g., highlight fast WiFi, smart home features, local guides).
- Highlight unique local experiences or amenities relevant to the primary guest profile.
- Consider seasonal promotions aligned with peak travel times for key origin markets.
Nearby Short-Term Rental Market Comparison
How does the Indio Airbnb market stack up against its neighbors? Compare key performance metrics like average monthly revenue, ADR, and occupancy rates in surrounding areas to understand the broader regional STR landscape.
| Market | Active Properties | Monthly Revenue | Daily Rate | Avg. Occupancy |
|---|---|---|---|---|
| Newport Beach | 1,273 | $8,950 | $744.06 | 47% |
| Rancho San Diego | 25 | $8,649 | $568.72 | 48% |
| Thousand Palms | 33 | $8,119 | $725.48 | 36% |
| Lakeside | 33 | $7,537 | $604.33 | 44% |
| GlenOak Hills | 41 | $7,394 | $648.65 | 41% |
| Bermuda Dunes | 143 | $7,324 | $664.90 | 39% |
| Mount Helix | 33 | $7,163 | $594.94 | 50% |
| Del Mar | 128 | $7,011 | $671.56 | 45% |
| Rancho Santa Fe | 34 | $6,074 | $913.16 | 35% |
| Encinitas | 559 | $5,940 | $543.93 | 49% |