Fort Bragg Airbnb Market Analysis 2026: Short Term Rental Data & Vacation Rental Statistics in California, United States
Is Airbnb profitable in Fort Bragg in 2026? Explore comprehensive Airbnb analytics for Fort Bragg, California, United States to uncover income potential. This 2026 STR market report for Fort Bragg, based on AirROI data from February 2025 to January 2026, reveals key trends in the market of 229 active listings.
Whether you're considering an Airbnb investment in Fort Bragg, optimizing your existing vacation rental, or exploring rental arbitrage opportunities, understanding the Fort Bragg Airbnb data is crucial. Leveraging the low regulation environment is key to maximizing your short term rental income potential. Let's dive into the specifics.
Key Fort Bragg Airbnb Performance Metrics Overview
Monthly Airbnb Revenue Variations & Income Potential in Fort Bragg (2026)
Understanding the monthly revenue variations for Airbnb listings in Fort Bragg is key to maximizing your short term rental income potential. Seasonality significantly impacts earnings. Our analysis, based on data from the past 12 months, shows that the peak revenue month for STRs in Fort Bragg is typically July, while January often presents the lowest earnings, highlighting opportunities for strategic pricing adjustments during shoulder and low seasons. Explore the typical Airbnb income in Fort Bragg across different performance tiers:
- Best-in-class properties (Top 10%) achieve $9,711+ monthly, often utilizing dynamic pricing and superior guest experiences.
- Strong performing properties (Top 25%) earn $5,924 or more, indicating effective management and desirable locations/amenities.
- Typical properties (Median) generate around $3,351 per month, representing the average market performance.
- Entry-level properties (Bottom 25%) see earnings around $1,892, often with potential for optimization.
Average Monthly Airbnb Earnings Trend in Fort Bragg
Fort Bragg Airbnb Occupancy Rate Trends (2026)
Maximize your bookings by understanding the Fort Bragg STR occupancy trends. Seasonal demand shifts significantly influence how often properties are booked. Typically, Julysees the highest demand (peak season occupancy), while January experiences the lowest (low season). Effective strategies, like adjusting minimum stays or offering promotions, can boost occupancy during slower periods. Here's how different property tiers perform in Fort Bragg:
- Best-in-class properties (Top 10%) achieve 76%+ occupancy, indicating high desirability and potentially optimized availability.
- Strong performing properties (Top 25%) maintain 61% or higher occupancy, suggesting good market fit and guest satisfaction.
- Typical properties (Median) have an occupancy rate around 40%.
- Entry-level properties (Bottom 25%) average 23% occupancy, potentially facing higher vacancy.
Average Monthly Occupancy Rate Trend in Fort Bragg
Average Daily Rate (ADR) Airbnb Trends in Fort Bragg (2026)
Effective short term rental pricing strategy in Fort Bragg involves understanding monthly ADR fluctuations. The Average Daily Rate (ADR) for Airbnb in Fort Bragg typically peaks in June and dips lowest during February. Leveraging Airbnb dynamic pricing tools or strategies based on this seasonality can significantly boost revenue. Here's a look at the typical nightly rates achieved:
- Best-in-class properties (Top 10%) command rates of $664+ per night, often due to premium features or locations.
- Strong performing properties (Top 25%) achieve nightly rates of $433 or more.
- Typical properties (Median) charge around $285 per night.
- Entry-level properties (Bottom 25%) earn around $200 per night.
Average Daily Rate (ADR) Trend by Month in Fort Bragg
Get Live Fort Bragg Market Intelligence 👇

Explore Real-time Analytics
Airbnb Seasonality Analysis & Trends in Fort Bragg (2026)
Peak Season (July, August, June)
- Revenue averages $6,333 per month
- Occupancy rates average 54.2%
- Daily rates average $375
Shoulder Season
- Revenue averages $4,505 per month
- Occupancy maintains around 41.0%
- Daily rates hold near $359
Low Season (January, February, March)
- Revenue drops to average $3,250 per month
- Occupancy decreases to average 32.1%
- Daily rates adjust to average $337
Seasonality Insights for Fort Bragg
- The Airbnb seasonality in Fort Bragg shows highly seasonal trends requiring careful strategy. While the sections above show seasonal averages, it's also insightful to look at the extremes:
- During the high season, the absolute peak month showcases Fort Bragg's highest earning potential, with monthly revenues capable of climbing to $7,285, occupancy reaching a high of 59.4%, and ADRs peaking at $382.
- Conversely, the slowest single month of the year, typically falling within the low season, marks the market's lowest point. In this month, revenue might dip to $2,809, occupancy could drop to 28.5%, and ADRs may adjust down to $325.
- Understanding both the seasonal averages and these monthly peaks and troughs in revenue, occupancy, and ADR is crucial for maximizing your Airbnb profit potential in Fort Bragg.
Seasonal Strategies for Maximizing Profit
- Peak Season: Maximize revenue through premium pricing and potentially longer minimum stays. Ensure high availability.
- Low Season: Offer competitive pricing, special promotions (e.g., extended stay discounts), and flexible cancellation policies. Target off-season travelers like remote workers or budget-conscious guests.
- Shoulder Seasons: Implement dynamic pricing that balances peak and low rates. Target weekend travelers or specific events. Offer slightly more flexible terms than peak season.
- Regularly analyze your own performance against these Fort Bragg seasonality benchmarks and adjust your pricing and availability strategy accordingly.
Best Areas for Airbnb Investment in Fort Bragg (2026)
Exploring the top neighborhoods for short-term rentals in Fort Bragg? This section highlights key areas, outlining why they are attractive for hosts and guests, along with notable local attractions. Consider these locations based on your target guest profile and investment strategy.
| Neighborhood / Area | Why Host Here? (Target Guests & Appeal) | Key Attractions & Landmarks |
|---|---|---|
| Caspar Beach | A picturesque beach area that offers stunning coastal views and an inviting atmosphere for vacationers. It's great for families and couples looking for a relaxing beach getaway. | Caspar Beach, Point Cabrillo Light Station, Kayaking in the cove, Swimming and sunbathing, Scenic coastal trails |
| Mendocino Headlands | Known for its dramatic cliffs and stunning ocean views, this area is perfect for nature lovers and those seeking outdoor adventures. It's close to Mendocino village and offers unique Airbnb experiences. | Mendocino Headlands State Park, Victoria's Last Resort, Local art galleries, Coastal hiking trails, Mendocino Village |
| Glass Beach | Famous for its colorful sea glass, this beach is a quirky and unique destination for travelers. The beach is intriguing and perfect for those who enjoy collecting and sight-seeing. | Glass Beach, Fort Bragg Coastal Trail, Oceanfront picnic areas, Nearby tide pools, Wildlife watching |
| Noyo Harbor | A charming harbor area that offers fresh seafood and beautiful views of fishing boats and the coastline. Popular for those looking for a more authentic coastal experience. | Noyo Harbor, Local seafood restaurants, Harbor cruises, Art galleries, Fishing opportunities |
| Pudding Creek Beach | A beautiful, less crowded beach ideal for sunbathers and surfers alike. It provides a more laid-back atmosphere compared to other more popular beaches. | Pudding Creek Beach, Surfing, Beach volleyball, Coastal walking paths, Picnic areas |
| The Skunk Train | A unique experience that offers scenic train rides through the redwoods, attracting visitors looking for adventure and a taste of local history. | Skunk Train rides, Pine Beach, Redwood forests, Historic train station, Gift shop |
| Old Coast Highway | This area includes beautiful coastal drives and proximity to various beach access points. It attracts travelers looking for exploration along California's stunning coast. | Old Coast Highway views, Nearby beaches, California coastal scenery, Nature trails, Wildlife watching |
| Downtown Fort Bragg | The downtown area has a variety of shops, restaurants, and community events, making it a vibrant hub for visitors and a great place to stay. | Local shops and boutiques, Restaurants, Fort Bragg's historical sites, Cultural events, Arts and crafts galleries |
Understanding Airbnb License Requirements & STR Laws in Fort Bragg (2026)
While Fort Bragg, California, United States currently shows low STR regulations, specific Airbnb license requirements might still exist or change. Always verify the latest short term rental regulations and Airbnb license requirements directly with local government authorities for Fort Bragg to ensure full compliance before hosting.
(Source: AirROI data, 2026, finding no licensed listings among those analyzed)
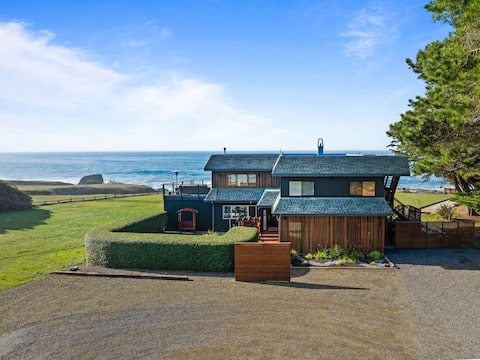
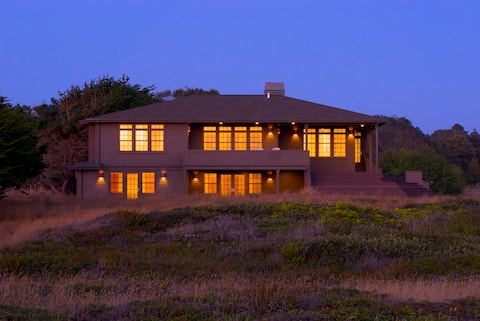
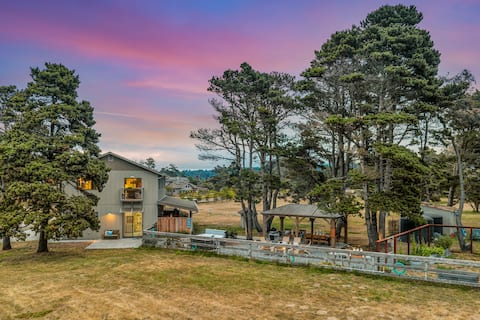
Top Performing Airbnb Properties in Fort Bragg (2026)
Benchmark your potential! Explore examples of top-performing Airbnb properties in Fort Braggbased on Trailing Twelve Month (TTM) revenue. Analyze their characteristics, revenue, occupancy rate, and ADR to understand what drives success in this market.
Ocean Front 5 Bedroom Coastal Getaway
Entire Place • 5 bedrooms
Beach House at Virgin Creek
Entire Place • 3 bedrooms

Pacific Sands @ The Nook
Entire Place • 5 bedrooms

Sea Sanctuary Stunning Beachfront Home with Hottub
Entire Place • 3 bedrooms

Serendipity - with Ocean Views and Beach Access
Entire Place • 4 bedrooms
Sea Ranch in Fort Bragg with Hot Tub & Game Room
Entire Place • 2 bedrooms
Note: Performance varies based on location, size, amenities, seasonality, and management quality. Data reflects the past 12 months.
Top Performing Airbnb Hosts in Fort Bragg (2026)
Learn from the best! This table showcases top-performing Airbnb hosts in Fort Bragg based on the number of properties managed and estimated total revenue over the past year. Analyze their scale and performance metrics.
| Host Name | Properties | Grossing Revenue | Stay Reviews | Avg Rating |
|---|---|---|---|---|
| Pacific Blue | 21 | $1,427,391 | 2126 | 4.83/5.0 |
| Mendocino Preferred | 7 | $441,525 | 90 | 4.76/5.0 |
| Micah | 3 | $389,315 | 247 | 4.96/5.0 |
| Sunny | 12 | $291,056 | 455 | 4.83/5.0 |
| Amy | 1 | $287,713 | 66 | 4.97/5.0 |
| Nick | 1 | $275,010 | 213 | 5.00/5.0 |
| Trulee | 3 | $257,183 | 818 | 4.92/5.0 |
| Vacasa | 15 | $249,348 | 1068 | 4.67/5.0 |
| Dakotah | 3 | $212,145 | 298 | 4.98/5.0 |
| Dev | 11 | $208,967 | 294 | 4.75/5.0 |
Analyzing the strategies of top hosts, such as their property selection, pricing, and guest communication, can offer valuable lessons for optimizing your own Airbnb operations in Fort Bragg.
Dive Deeper: Advanced Fort Bragg STR Market Data (2026)
Ready to unlock more insights? AirROI provides access to advanced metrics and comprehensive Airbnb data for Fort Bragg. Explore detailed analytics beyond this report to refine your investment strategy, optimize pricing, and maximize your vacation rental profits.
Explore Advanced MetricsFort Bragg Short-Term Rental Market Composition (2026): Property & Room Types
Room Type Distribution
Property Type Distribution
Market Composition Insights for Fort Bragg
- The Fort Bragg Airbnb market composition is heavily skewed towards Entire Home/Apt listings, which make up 85.6% of the 229 active rentals. This indicates strong guest preference for privacy and space.
- Looking at the property type distribution in Fort Bragg, House properties are the most common (61.6%), reflecting the local real estate landscape.
- Houses represent a significant 61.6% portion, catering likely to families or larger groups.
- The presence of 20.1% Hotel/Boutique listings indicates integration with traditional hospitality.
- Smaller segments like apartment/condo, others, unique stays (combined 8.8%) offer potential for unique stay experiences.
Fort Bragg Airbnb Room Capacity Analysis (2026): Bedroom Distribution
Distribution of Listings by Number of Bedrooms
Room Capacity Insights for Fort Bragg
- The dominant room capacity in Fort Bragg is 1 bedroom listings, making up 28.8% of the market. This suggests a strong demand for properties suitable for couples or solo travelers.
- Together, 1 bedroom and 2 bedrooms properties represent 55.0% of the active Airbnb listings in Fort Bragg, indicating a high concentration in these sizes.
- A significant 31.4% of listings offer 3+ bedrooms, catering to larger groups and families seeking more space in Fort Bragg.
Fort Bragg Vacation Rental Guest Capacity Trends (2026)
Distribution of Listings by Guest Capacity
Guest Capacity Insights for Fort Bragg
- The most common guest capacity trend in Fort Bragg vacation rentals is listings accommodating 2 guests (23.1%). This suggests the primary traveler segment is likely couples or solo travelers.
- Properties designed for 2 guests and 4 guests dominate the Fort Bragg STR market, accounting for 44.5% of listings.
- 37.2% of properties accommodate 6+ guests, serving the market segment for larger families or group travel in Fort Bragg.
- On average, properties in Fort Bragg are equipped to host 4.5 guests.
Fort Bragg Airbnb Booking Patterns (2026): Available vs. Booked Days
Available Days Distribution
Booked Days Distribution
Booking Pattern Insights for Fort Bragg
- The most common availability pattern in Fort Bragg falls within the 271-366 days range, representing 39.3% of listings. This suggests many properties have significant open periods on their calendars.
- Approximately 76.4% of listings show high availability (181+ days open annually), indicating potential for increased bookings or specific owner usage patterns.
- For booked days, the 91-180 days range is most frequent in Fort Bragg (35.4%), reflecting common guest stay durations or potential owner blocking patterns.
- A notable 26.2% of properties secure long booking periods (181+ days booked per year), highlighting successful long-term rental strategies or significant owner usage.
Fort Bragg Airbnb Minimum Stay Requirements Analysis
Distribution of Listings by Minimum Night Requirement
1 Night
61 listings
26.6% of total
2 Nights
103 listings
45% of total
3 Nights
7 listings
3.1% of total
4-6 Nights
2 listings
0.9% of total
7-29 Nights
5 listings
2.2% of total
30+ Nights
51 listings
22.3% of total
Key Insights
- The most prevalent minimum stay requirement in Fort Bragg is 2 Nights, adopted by 45% of listings. This highlights the market's preference for shorter, flexible bookings.
- A strong majority (71.6%) of the Fort Bragg Airbnb data shows acceptance of very short stays (1-2 nights), indicating a dynamic, high-turnover market.
- A significant segment (22.3%) caters to monthly stays (30+ nights) in Fort Bragg, pointing to opportunities in the extended-stay market.
Recommendations
- Align with the market by considering a 2 Nights minimum stay, as 45% of Fort Bragg hosts use this setting.
- If feasible, allowing 1-night stays, especially midweek or during low season, could capture last-minute bookings, as only 26.6% currently do.
- Explore offering discounts for stays of 30+ nights to attract the 22.3% of the market seeking extended stays.
- Adjust minimum nights based on seasonality – potentially shorter during low season and longer during peak demand periods in Fort Bragg.
Fort Bragg Airbnb Cancellation Policy Trends Analysis (2026)
Limited
2 listings
0.9% of total
Super Strict 30 Days
34 listings
14.8% of total
Flexible
28 listings
12.2% of total
Moderate
96 listings
41.9% of total
Firm
57 listings
24.9% of total
Strict
12 listings
5.2% of total
Cancellation Policy Insights for Fort Bragg
- The prevailing Airbnb cancellation policy trend in Fort Bragg is Moderate, used by 41.9% of listings.
- There's a relatively balanced mix between guest-friendly (54.1%) and stricter (30.1%) policies, offering choices for different guest needs.
- Strict cancellation policies are quite rare (5.2%), potentially making listings with this policy less competitive unless justified by high demand or property type.
Recommendations for Hosts
- Consider adopting a Moderate policy to align with the 41.9% market standard in Fort Bragg.
- Using a Strict policy might deter some guests, as only 5.2% of listings use it. Evaluate if potential revenue protection outweighs possible lower booking rates.
- Regularly review your cancellation policy against competitors and market demand shifts in Fort Bragg.
Fort Bragg STR Booking Lead Time Analysis (2026)
Average Booking Lead Time by Month
Booking Lead Time Insights for Fort Bragg
- The overall average booking lead time for vacation rentals in Fort Bragg is 44 days.
- Guests book furthest in advance for stays during July (average 65 days), likely coinciding with peak travel demand or local events.
- The shortest booking windows occur for stays in February (average 31 days), indicating more last-minute travel plans during this time.
- Seasonally, Summer (55 days avg.) sees the longest lead times, while Winter (36 days avg.) has the shortest, reflecting typical travel planning cycles.
Recommendations for Hosts
- Use the overall average lead time (44 days) as a baseline for your pricing and availability strategy in Fort Bragg.
- For July stays, consider implementing length-of-stay discounts or slightly higher rates for bookings made less than 65 days out to capitalize on advance planning.
- Target marketing efforts for the Summer season well in advance (at least 55 days) to capture early planners.
- Monitor your own booking lead times against these Fort Bragg averages to identify opportunities for dynamic pricing adjustments.
Popular & Essential Airbnb Amenities in Fort Bragg (2026)
Amenity Prevalence
Amenity Insights for Fort Bragg
- Essential amenities in Fort Bragg that guests expect include: Smoke alarm, Free parking on premises, Wifi, Fire extinguisher. Lacking these (any) could significantly impact bookings.
- Popular amenities like Heating, Hot water, Carbon monoxide alarm are common but not universal. Offering these can provide a competitive edge.
Recommendations for Hosts
- Ensure your listing includes all essential amenities for Fort Bragg: Smoke alarm, Free parking on premises, Wifi, Fire extinguisher.
- Prioritize adding missing essentials: Smoke alarm, Free parking on premises, Wifi, Fire extinguisher.
- Consider adding popular differentiators like Heating or Hot water to increase appeal.
- Highlight unique or less common amenities you offer (e.g., hot tub, dedicated workspace, EV charger) in your listing description and photos.
- Regularly check competitor amenities in Fort Bragg to stay competitive.
Fort Bragg Airbnb Guest Demographics & Profile Analysis (2026)
Guest Profile Summary for Fort Bragg
- The typical guest profile for Airbnb in Fort Bragg consists of primarily domestic travelers (96%), often arriving from nearby San Francisco, typically belonging to the Post-2000s (Gen Z/Alpha) group (50%), primarily speaking English or Spanish.
- Domestic travelers account for 95.8% of guests.
- Key international markets include United States (95.8%) and United Kingdom (1%).
- Top languages spoken are English (64.1%) followed by Spanish (13.3%).
- A significant demographic segment is the Post-2000s (Gen Z/Alpha) group, representing 50% of guests.
Recommendations for Hosts
- Target domestic marketing efforts towards travelers from San Francisco and Sacramento.
- Tailor amenities and listing descriptions to appeal to the dominant Post-2000s (Gen Z/Alpha) demographic (e.g., highlight fast WiFi, smart home features, local guides).
- Highlight unique local experiences or amenities relevant to the primary guest profile.
- Consider seasonal promotions aligned with peak travel times for key origin markets.
Nearby Short-Term Rental Market Comparison
How does the Fort Bragg Airbnb market stack up against its neighbors? Compare key performance metrics like average monthly revenue, ADR, and occupancy rates in surrounding areas to understand the broader regional STR landscape.
| Market | Active Properties | Monthly Revenue | Daily Rate | Avg. Occupancy |
|---|---|---|---|---|
| Sonoma | 228 | $9,647 | $819.87 | 43% |
| Marshall | 18 | $8,897 | $607.75 | 50% |
| St. Helena | 50 | $8,684 | $924.70 | 38% |
| Kenwood | 60 | $8,643 | $810.83 | 41% |
| Glen Ellen | 85 | $8,482 | $799.53 | 43% |
| Eldridge | 21 | $8,410 | $930.61 | 41% |
| Dillon Beach | 82 | $8,062 | $703.26 | 41% |
| Healdsburg | 195 | $7,538 | $744.46 | 41% |
| Calistoga | 101 | $7,312 | $795.93 | 31% |
| Irish Beach | 42 | $7,066 | $443.87 | 55% |