Diamond Bar Airbnb Market Analysis 2026: Short Term Rental Data & Vacation Rental Statistics in California, United States
Is Airbnb profitable in Diamond Bar in 2026? Explore comprehensive Airbnb analytics for Diamond Bar, California, United States to uncover income potential. This 2026 STR market report for Diamond Bar, based on AirROI data from February 2025 to January 2026, reveals key trends in the niche market of 32 active listings.
Whether you're considering an Airbnb investment in Diamond Bar, optimizing your existing vacation rental, or exploring rental arbitrage opportunities, understanding the Diamond Bar Airbnb data is crucial. Leveraging the low regulation environment is key to maximizing your short term rental income potential. Let's dive into the specifics.
Key Diamond Bar Airbnb Performance Metrics Overview
Monthly Airbnb Revenue Variations & Income Potential in Diamond Bar (2026)
Understanding the monthly revenue variations for Airbnb listings in Diamond Bar is key to maximizing your short term rental income potential. Seasonality significantly impacts earnings. Our analysis, based on data from the past 12 months, shows that the peak revenue month for STRs in Diamond Bar is typically July, while January often presents the lowest earnings, highlighting opportunities for strategic pricing adjustments during shoulder and low seasons. Explore the typical Airbnb income in Diamond Bar across different performance tiers:
- Best-in-class properties (Top 10%) achieve $8,715+ monthly, often utilizing dynamic pricing and superior guest experiences.
- Strong performing properties (Top 25%) earn $5,297 or more, indicating effective management and desirable locations/amenities.
- Typical properties (Median) generate around $2,780 per month, representing the average market performance.
- Entry-level properties (Bottom 25%) see earnings around $979, often with potential for optimization.
Average Monthly Airbnb Earnings Trend in Diamond Bar
Diamond Bar Airbnb Occupancy Rate Trends (2026)
Maximize your bookings by understanding the Diamond Bar STR occupancy trends. Seasonal demand shifts significantly influence how often properties are booked. Typically, Novembersees the highest demand (peak season occupancy), while January experiences the lowest (low season). Effective strategies, like adjusting minimum stays or offering promotions, can boost occupancy during slower periods. Here's how different property tiers perform in Diamond Bar:
- Best-in-class properties (Top 10%) achieve 81%+ occupancy, indicating high desirability and potentially optimized availability.
- Strong performing properties (Top 25%) maintain 63% or higher occupancy, suggesting good market fit and guest satisfaction.
- Typical properties (Median) have an occupancy rate around 35%.
- Entry-level properties (Bottom 25%) average 17% occupancy, potentially facing higher vacancy.
Average Monthly Occupancy Rate Trend in Diamond Bar
Average Daily Rate (ADR) Airbnb Trends in Diamond Bar (2026)
Effective short term rental pricing strategy in Diamond Bar involves understanding monthly ADR fluctuations. The Average Daily Rate (ADR) for Airbnb in Diamond Bar typically peaks in September and dips lowest during August. Leveraging Airbnb dynamic pricing tools or strategies based on this seasonality can significantly boost revenue. Here's a look at the typical nightly rates achieved:
- Best-in-class properties (Top 10%) command rates of $364+ per night, often due to premium features or locations.
- Strong performing properties (Top 25%) achieve nightly rates of $288 or more.
- Typical properties (Median) charge around $212 per night.
- Entry-level properties (Bottom 25%) earn around $96 per night.
Average Daily Rate (ADR) Trend by Month in Diamond Bar
Get Live Diamond Bar Market Intelligence 👇

Explore Real-time Analytics
Airbnb Seasonality Analysis & Trends in Diamond Bar (2026)
Peak Season (July, November, September)
- Revenue averages $4,789 per month
- Occupancy rates average 51.4%
- Daily rates average $225
Shoulder Season
- Revenue averages $3,962 per month
- Occupancy maintains around 40.9%
- Daily rates hold near $215
Low Season (January, March, December)
- Revenue drops to average $2,872 per month
- Occupancy decreases to average 32.6%
- Daily rates adjust to average $223
Seasonality Insights for Diamond Bar
- The Airbnb seasonality in Diamond Bar shows moderate seasonality with distinct peak and low periods. While the sections above show seasonal averages, it's also insightful to look at the extremes:
- During the high season, the absolute peak month showcases Diamond Bar's highest earning potential, with monthly revenues capable of climbing to $4,982, occupancy reaching a high of 52.3%, and ADRs peaking at $233.
- Conversely, the slowest single month of the year, typically falling within the low season, marks the market's lowest point. In this month, revenue might dip to $2,748, occupancy could drop to 30.6%, and ADRs may adjust down to $211.
- Understanding both the seasonal averages and these monthly peaks and troughs in revenue, occupancy, and ADR is crucial for maximizing your Airbnb profit potential in Diamond Bar.
Seasonal Strategies for Maximizing Profit
- Peak Season: Maximize revenue through premium pricing and potentially longer minimum stays. Ensure high availability.
- Low Season: Offer competitive pricing, special promotions (e.g., extended stay discounts), and flexible cancellation policies. Target off-season travelers like remote workers or budget-conscious guests.
- Shoulder Seasons: Implement dynamic pricing that balances peak and low rates. Target weekend travelers or specific events. Offer slightly more flexible terms than peak season.
- Regularly analyze your own performance against these Diamond Bar seasonality benchmarks and adjust your pricing and availability strategy accordingly.
Best Areas for Airbnb Investment in Diamond Bar (2026)
Exploring the top neighborhoods for short-term rentals in Diamond Bar? This section highlights key areas, outlining why they are attractive for hosts and guests, along with notable local attractions. Consider these locations based on your target guest profile and investment strategy.
| Neighborhood / Area | Why Host Here? (Target Guests & Appeal) | Key Attractions & Landmarks |
|---|---|---|
| Diamond Bar City Center | The heart of Diamond Bar with shopping, dining, and community events. A prime location for guests looking for convenience and accessibility to local attractions. | Diamond Bar Golf Course, Summit Ridge Park, Diamond Bar Plaza, Walnut Creek Park, Dunkel Brothers Park |
| Pantera Park | A serene neighborhood with beautiful parks and family-friendly environments. Ideal for travelers seeking a quiet stay while being close to major attractions. | Pantera Park, Diamond Bar Community Center, Los Angeles County Fair, Walnut Creek Nature Park |
| Diamond Bar Hills | A suburban neighborhood known for its scenic views and upscale homes. Great for guests looking for a relaxing getaway with a luxurious feel. | Diamond Bar Hills Park, Cedarcreek Park, The Chino Hills State Park |
| Lydia Park | A charming area that offers local dining and recreational options. Attractive for families and small groups looking for comfort and convenience. | Lydia Park, Diamond Bar Library, Heritage Park, Ranch Hills Park |
| The Country | A picturesque neighborhood offering a more rural feel while still being close to urban amenities. Ideal for guests looking for tranquility and nature. | The Country Park, Diamond Bar Equestrian Center, Horse trails |
| Summit Ridge | An upscale area featuring scenic views and various parks. Great for guests looking for a peaceful atmosphere with luxury accommodations. | Summit Ridge Park, Baldy View Park, Local upscale dining options |
| South Diamond Bar | A convenient location close to schools and shopping centers. It appeals to families looking for short-term stays. | Diamond Bar High School, Shopping malls, Parks and recreational areas |
| North Diamond Bar | A family-friendly environment with access to great schools and parks. Ideal for families or groups looking for a comfortable stay during their visit. | Diamond Bar High School, Sierra La Verne Park, Rolling Hills Park |
Understanding Airbnb License Requirements & STR Laws in Diamond Bar (2026)
While Diamond Bar, California, United States currently shows low STR regulations, specific Airbnb license requirements might still exist or change. Always verify the latest short term rental regulations and Airbnb license requirements directly with local government authorities for Diamond Bar to ensure full compliance before hosting.
(Source: AirROI data, 2026, based on 3% licensed listings)
Top Performing Airbnb Properties in Diamond Bar (2026)
Benchmark your potential! Explore examples of top-performing Airbnb properties in Diamond Barbased on Trailing Twelve Month (TTM) revenue. Analyze their characteristics, revenue, occupancy rate, and ADR to understand what drives success in this market.

30% OFF Monthly • 5BR • Spa & Pool • All King Beds
Entire Place • 5 bedrooms
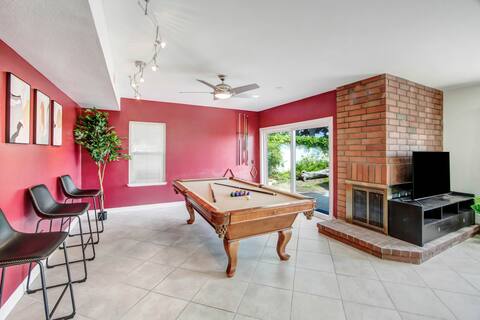
Scenic Hillside Hideaway
Entire Place • 5 bedrooms
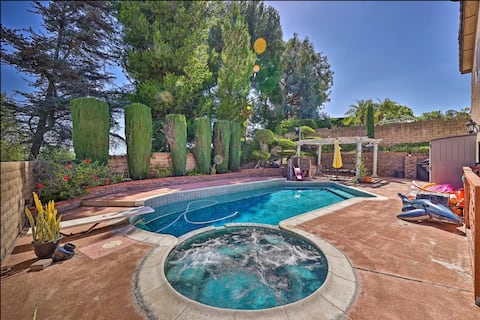
Close to Disney land/ Nice pool Backyard Oasis!
Entire Place • 4 bedrooms
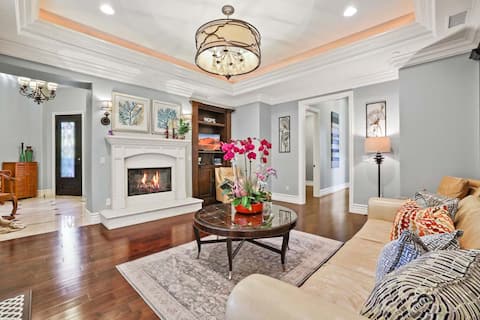
Mansion mountain view 3BR 3.5BA 鑽石吧百萬豪宅
Entire Place • 3 bedrooms
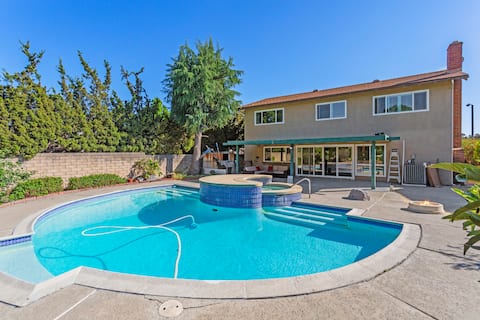
Spacious 4BR w/ Pool Jacuzzi & Home Office E#42117
Entire Place • 4 bedrooms

Newly built vacation home with large backyard
Entire Place • 3 bedrooms
Note: Performance varies based on location, size, amenities, seasonality, and management quality. Data reflects the past 12 months.
Top Performing Airbnb Hosts in Diamond Bar (2026)
Learn from the best! This table showcases top-performing Airbnb hosts in Diamond Bar based on the number of properties managed and estimated total revenue over the past year. Analyze their scale and performance metrics.
| Host Name | Properties | Grossing Revenue | Stay Reviews | Avg Rating |
|---|---|---|---|---|
| Ethen | 2 | $151,470 | 29 | 4.87/5.0 |
| Tammy | 1 | $95,413 | 22 | 4.18/5.0 |
| Ted | 1 | $94,477 | 99 | 4.90/5.0 |
| Elin | 2 | $69,562 | 8 | 5.00/5.0 |
| Eric | 3 | $63,786 | 5 | 5.00/5.0 |
| Vicki | 1 | $55,001 | 35 | 5.00/5.0 |
| Victor | 1 | $28,872 | 7 | 5.00/5.0 |
| Jeanne | 1 | $24,943 | 7 | 5.00/5.0 |
| Jordan | 1 | $24,722 | 22 | 4.86/5.0 |
| Fiona | 1 | $22,013 | 12 | 4.58/5.0 |
Analyzing the strategies of top hosts, such as their property selection, pricing, and guest communication, can offer valuable lessons for optimizing your own Airbnb operations in Diamond Bar.
Dive Deeper: Advanced Diamond Bar STR Market Data (2026)
Ready to unlock more insights? AirROI provides access to advanced metrics and comprehensive Airbnb data for Diamond Bar. Explore detailed analytics beyond this report to refine your investment strategy, optimize pricing, and maximize your vacation rental profits.
Explore Advanced MetricsDiamond Bar Short-Term Rental Market Composition (2026): Property & Room Types
Room Type Distribution
Property Type Distribution
Market Composition Insights for Diamond Bar
- The Diamond Bar Airbnb market composition is heavily skewed towards Entire Home/Apt listings, which make up 90.6% of the 32 active rentals. This indicates strong guest preference for privacy and space.
- Looking at the property type distribution in Diamond Bar, House properties are the most common (78.1%), reflecting the local real estate landscape.
- Houses represent a significant 78.1% portion, catering likely to families or larger groups.
- The presence of 9.4% Hotel/Boutique listings indicates integration with traditional hospitality.
- Smaller segments like others (combined 3.1%) offer potential for unique stay experiences.
Diamond Bar Airbnb Room Capacity Analysis (2026): Bedroom Distribution
Distribution of Listings by Number of Bedrooms
Room Capacity Insights for Diamond Bar
- The dominant room capacity in Diamond Bar is 4 bedrooms listings, making up 28.1% of the market. This suggests a strong demand for properties suitable for families or small groups.
- Together, 4 bedrooms and 1 bedroom properties represent 50.0% of the active Airbnb listings in Diamond Bar, indicating a high concentration in these sizes.
- A significant 62.5% of listings offer 3+ bedrooms, catering to larger groups and families seeking more space in Diamond Bar.
Diamond Bar Vacation Rental Guest Capacity Trends (2026)
Distribution of Listings by Guest Capacity
Guest Capacity Insights for Diamond Bar
- The most common guest capacity trend in Diamond Bar vacation rentals is listings accommodating 8+ guests (34.4%). This suggests the primary traveler segment is likely larger groups.
- Properties designed for 8+ guests and 6 guests dominate the Diamond Bar STR market, accounting for 53.2% of listings.
- 59.5% of properties accommodate 6+ guests, serving the market segment for larger families or group travel in Diamond Bar.
- On average, properties in Diamond Bar are equipped to host 5.4 guests.
Diamond Bar Airbnb Booking Patterns (2026): Available vs. Booked Days
Available Days Distribution
Booked Days Distribution
Booking Pattern Insights for Diamond Bar
- The most common availability pattern in Diamond Bar falls within the 271-366 days range, representing 68.8% of listings. This suggests many properties have significant open periods on their calendars.
- Approximately 93.8% of listings show high availability (181+ days open annually), indicating potential for increased bookings or specific owner usage patterns.
- For booked days, the 31-90 days range is most frequent in Diamond Bar (37.5%), reflecting common guest stay durations or potential owner blocking patterns.
- A notable 6.2% of properties secure long booking periods (181+ days booked per year), highlighting successful long-term rental strategies or significant owner usage.
Diamond Bar Airbnb Minimum Stay Requirements Analysis
Distribution of Listings by Minimum Night Requirement
7-29 Nights
16 listings
50% of total
30+ Nights
16 listings
50% of total
Key Insights
- The most prevalent minimum stay requirement in Diamond Bar is 7-29 Nights, adopted by 50% of listings. This highlights the market's preference for shorter, flexible bookings.
- A significant segment (50%) caters to monthly stays (30+ nights) in Diamond Bar, pointing to opportunities in the extended-stay market.
Recommendations
- Align with the market by considering a 7-29 Nights minimum stay, as 50% of Diamond Bar hosts use this setting.
- Explore offering discounts for stays of 30+ nights to attract the 50% of the market seeking extended stays.
- Adjust minimum nights based on seasonality – potentially shorter during low season and longer during peak demand periods in Diamond Bar.
Diamond Bar Airbnb Cancellation Policy Trends Analysis (2026)
Flexible
11 listings
35.5% of total
Moderate
7 listings
22.6% of total
Firm
7 listings
22.6% of total
Strict
6 listings
19.4% of total
Cancellation Policy Insights for Diamond Bar
- The prevailing Airbnb cancellation policy trend in Diamond Bar is Flexible, used by 35.5% of listings.
- There's a relatively balanced mix between guest-friendly (58.1%) and stricter (42.0%) policies, offering choices for different guest needs.
Recommendations for Hosts
- Consider adopting a Flexible policy to align with the 35.5% market standard in Diamond Bar.
- Regularly review your cancellation policy against competitors and market demand shifts in Diamond Bar.
Diamond Bar STR Booking Lead Time Analysis (2026)
Average Booking Lead Time by Month
Booking Lead Time Insights for Diamond Bar
- The overall average booking lead time for vacation rentals in Diamond Bar is 19 days.
- Guests book furthest in advance for stays during August (average 36 days), likely coinciding with peak travel demand or local events.
- The shortest booking windows occur for stays in October (average 4 days), indicating more last-minute travel plans during this time.
- Seasonally, Summer (28 days avg.) sees the longest lead times, while Spring (15 days avg.) has the shortest, reflecting typical travel planning cycles.
Recommendations for Hosts
- Use the overall average lead time (19 days) as a baseline for your pricing and availability strategy in Diamond Bar.
- For August stays, consider implementing length-of-stay discounts or slightly higher rates for bookings made less than 36 days out to capitalize on advance planning.
- During October, focus on last-minute booking availability and promotions, as guests book with very short notice (4 days avg.).
- Target marketing efforts for the Summer season well in advance (at least 28 days) to capture early planners.
- Monitor your own booking lead times against these Diamond Bar averages to identify opportunities for dynamic pricing adjustments.
Popular & Essential Airbnb Amenities in Diamond Bar (2026)
Amenity Prevalence
Amenity Insights for Diamond Bar
- Essential amenities in Diamond Bar that guests expect include: Air conditioning, Wifi, Kitchen, TV, Smoke alarm, Washer, Free parking on premises. Lacking these (any) could significantly impact bookings.
- Popular amenities like Heating, Dryer, Cooking basics are common but not universal. Offering these can provide a competitive edge.
Recommendations for Hosts
- Ensure your listing includes all essential amenities for Diamond Bar: Air conditioning, Wifi, Kitchen, TV, Smoke alarm, Washer, Free parking on premises.
- Prioritize adding missing essentials: Smoke alarm, Washer, Free parking on premises.
- Consider adding popular differentiators like Heating or Dryer to increase appeal.
- Highlight unique or less common amenities you offer (e.g., hot tub, dedicated workspace, EV charger) in your listing description and photos.
- Regularly check competitor amenities in Diamond Bar to stay competitive.
Diamond Bar Airbnb Guest Demographics & Profile Analysis (2026)
Guest Profile Summary for Diamond Bar
- The typical guest profile for Airbnb in Diamond Bar consists of primarily domestic travelers (72%), often arriving from nearby California, typically belonging to the Post-2000s (Gen Z/Alpha) group (50%), primarily speaking English or Hindi.
- Domestic travelers account for 72.1% of guests.
- Key international markets include United States (72.1%) and China (14%).
- Top languages spoken are English (58.8%) followed by Hindi (11.8%).
- A significant demographic segment is the Post-2000s (Gen Z/Alpha) group, representing 50% of guests.
Recommendations for Hosts
- Target domestic marketing efforts towards travelers from California and Beijing.
- Tailor amenities and listing descriptions to appeal to the dominant Post-2000s (Gen Z/Alpha) demographic (e.g., highlight fast WiFi, smart home features, local guides).
- Highlight unique local experiences or amenities relevant to the primary guest profile.
- Consider seasonal promotions aligned with peak travel times for key origin markets.
Nearby Short-Term Rental Market Comparison
How does the Diamond Bar Airbnb market stack up against its neighbors? Compare key performance metrics like average monthly revenue, ADR, and occupancy rates in surrounding areas to understand the broader regional STR landscape.
| Market | Active Properties | Monthly Revenue | Daily Rate | Avg. Occupancy |
|---|---|---|---|---|
| Newport Beach | 1,273 | $8,950 | $744.06 | 47% |
| Rancho San Diego | 25 | $8,649 | $568.72 | 48% |
| Malibu | 251 | $8,293 | $1263.89 | 35% |
| Thousand Palms | 33 | $8,119 | $725.48 | 36% |
| Manhattan Beach | 267 | $7,875 | $585.30 | 53% |
| Lakeside | 33 | $7,537 | $604.33 | 44% |
| GlenOak Hills | 41 | $7,394 | $648.65 | 41% |
| Bermuda Dunes | 143 | $7,324 | $664.90 | 39% |
| Mount Helix | 33 | $7,163 | $594.94 | 50% |
| Del Mar | 128 | $7,011 | $671.56 | 45% |