Del Monte Forest Airbnb Market Analysis 2026: Short Term Rental Data & Vacation Rental Statistics in California, United States
Is Airbnb profitable in Del Monte Forest in 2026? Explore comprehensive Airbnb analytics for Del Monte Forest, California, United States to uncover income potential. This 2026 STR market report for Del Monte Forest, based on AirROI data from February 2025 to January 2026, reveals key trends in the niche market of 105 active listings.
Whether you're considering an Airbnb investment in Del Monte Forest, optimizing your existing vacation rental, or exploring rental arbitrage opportunities, understanding the Del Monte Forest Airbnb data is crucial. Leveraging the low regulation environment is key to maximizing your short term rental income potential. Let's dive into the specifics.
Key Del Monte Forest Airbnb Performance Metrics Overview
Monthly Airbnb Revenue Variations & Income Potential in Del Monte Forest (2026)
Understanding the monthly revenue variations for Airbnb listings in Del Monte Forest is key to maximizing your short term rental income potential. Seasonality significantly impacts earnings. Our analysis, based on data from the past 12 months, shows that the peak revenue month for STRs in Del Monte Forest is typically July, while January often presents the lowest earnings, highlighting opportunities for strategic pricing adjustments during shoulder and low seasons. Explore the typical Airbnb income in Del Monte Forest across different performance tiers:
- Best-in-class properties (Top 10%) achieve $25,352+ monthly, often utilizing dynamic pricing and superior guest experiences.
- Strong performing properties (Top 25%) earn $15,930 or more, indicating effective management and desirable locations/amenities.
- Typical properties (Median) generate around $9,314 per month, representing the average market performance.
- Entry-level properties (Bottom 25%) see earnings around $4,679, often with potential for optimization.
Average Monthly Airbnb Earnings Trend in Del Monte Forest
Del Monte Forest Airbnb Occupancy Rate Trends (2026)
Maximize your bookings by understanding the Del Monte Forest STR occupancy trends. Seasonal demand shifts significantly influence how often properties are booked. Typically, Julysees the highest demand (peak season occupancy), while January experiences the lowest (low season). Effective strategies, like adjusting minimum stays or offering promotions, can boost occupancy during slower periods. Here's how different property tiers perform in Del Monte Forest:
- Best-in-class properties (Top 10%) achieve 82%+ occupancy, indicating high desirability and potentially optimized availability.
- Strong performing properties (Top 25%) maintain 68% or higher occupancy, suggesting good market fit and guest satisfaction.
- Typical properties (Median) have an occupancy rate around 53%.
- Entry-level properties (Bottom 25%) average 32% occupancy, potentially facing higher vacancy.
Average Monthly Occupancy Rate Trend in Del Monte Forest
Average Daily Rate (ADR) Airbnb Trends in Del Monte Forest (2026)
Effective short term rental pricing strategy in Del Monte Forest involves understanding monthly ADR fluctuations. The Average Daily Rate (ADR) for Airbnb in Del Monte Forest typically peaks in August and dips lowest during February. Leveraging Airbnb dynamic pricing tools or strategies based on this seasonality can significantly boost revenue. Here's a look at the typical nightly rates achieved:
- Best-in-class properties (Top 10%) command rates of $2,135+ per night, often due to premium features or locations.
- Strong performing properties (Top 25%) achieve nightly rates of $1,078 or more.
- Typical properties (Median) charge around $684 per night.
- Entry-level properties (Bottom 25%) earn around $321 per night.
Average Daily Rate (ADR) Trend by Month in Del Monte Forest
Get Live Del Monte Forest Market Intelligence 👇

Explore Real-time Analytics
Airbnb Seasonality Analysis & Trends in Del Monte Forest (2026)
Peak Season (July, August, June)
- Revenue averages $17,504 per month
- Occupancy rates average 60.8%
- Daily rates average $1,011
Shoulder Season
- Revenue averages $12,483 per month
- Occupancy maintains around 51.1%
- Daily rates hold near $920
Low Season (January, February, March)
- Revenue drops to average $8,669 per month
- Occupancy decreases to average 39.9%
- Daily rates adjust to average $867
Seasonality Insights for Del Monte Forest
- The Airbnb seasonality in Del Monte Forest shows highly seasonal trends requiring careful strategy. While the sections above show seasonal averages, it's also insightful to look at the extremes:
- During the high season, the absolute peak month showcases Del Monte Forest's highest earning potential, with monthly revenues capable of climbing to $19,003, occupancy reaching a high of 65.8%, and ADRs peaking at $1,029.
- Conversely, the slowest single month of the year, typically falling within the low season, marks the market's lowest point. In this month, revenue might dip to $7,335, occupancy could drop to 33.9%, and ADRs may adjust down to $844.
- Understanding both the seasonal averages and these monthly peaks and troughs in revenue, occupancy, and ADR is crucial for maximizing your Airbnb profit potential in Del Monte Forest.
Seasonal Strategies for Maximizing Profit
- Peak Season: Maximize revenue through premium pricing and potentially longer minimum stays. Ensure high availability.
- Low Season: Offer competitive pricing, special promotions (e.g., extended stay discounts), and flexible cancellation policies. Target off-season travelers like remote workers or budget-conscious guests.
- Shoulder Seasons: Implement dynamic pricing that balances peak and low rates. Target weekend travelers or specific events. Offer slightly more flexible terms than peak season.
- Regularly analyze your own performance against these Del Monte Forest seasonality benchmarks and adjust your pricing and availability strategy accordingly.
Best Areas for Airbnb Investment in Del Monte Forest (2026)
Exploring the top neighborhoods for short-term rentals in Del Monte Forest? This section highlights key areas, outlining why they are attractive for hosts and guests, along with notable local attractions. Consider these locations based on your target guest profile and investment strategy.
| Neighborhood / Area | Why Host Here? (Target Guests & Appeal) | Key Attractions & Landmarks |
|---|---|---|
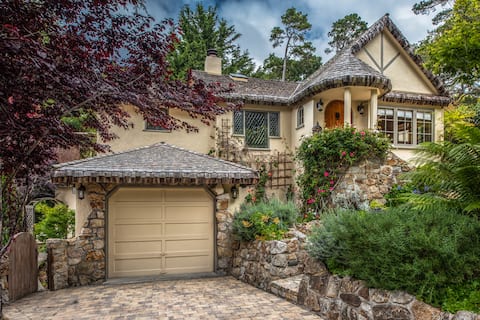
| Carmel-by-the-Sea | Charming coastal town known for its fairy-tale cottages and pristine beaches. A popular destination for tourists seeking art galleries, unique dining, and romantic getaways. | Carmel Beach, Point Lobos State Natural Reserve, Carmel Mission Basilica, 17-Mile Drive, Carmel Plaza |
| Monterey | Famous for its stunning coastal views and the renowned Monterey Bay Aquarium. Offers a mix of natural beauty, marine life, and rich history, attractive for families and tourists. | Monterey Bay Aquarium, Cannery Row, Old Fisherman's Wharf, Pacific Grove, Lover's Point Park |
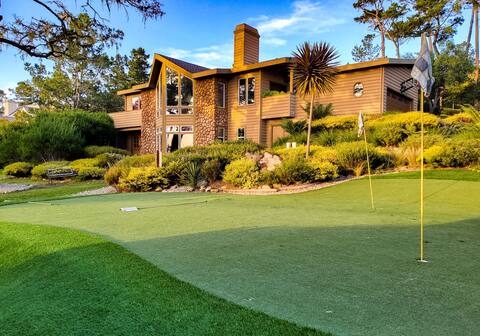
| Pebble Beach | Exclusive area known for its golf courses and luxury homes. Ideal for travelers looking for a scenic retreat with world-class golfing and ocean views. | Pebble Beach Golf Links, 17-Mile Drive, Lone Cypress, Spanish Bay Beach, Pebble Beach Equestrian Center |
| Pacific Grove | Quaint coastal town with beautiful shoreline and less touristy feel compared to nearby areas. Great for visitors looking for tranquility and access to nature. | Asilomar State Beach, Monarch Butterfly Sanctuary, Pacific Grove Museum of Natural History, Lover's Point Park, Cannery Row |
| Big Sur | Stunning natural beauty along the California coastline, attracting nature lovers and adventure seekers. Offers hiking, scenic views, and a peaceful environment. | Bixby Creek Bridge, Pfeiffer Beach, Big Sur River, Julia Pfeiffer Burns State Park, Henry Miller Memorial Library |
| Salinas | Known as the center of agriculture in Monterey County, with rich history and cultural sites. Attracts visitors interested in history and the arts. | National Steinbeck Center, Salinas River National Wildlife Refuge, Oldtown Salinas, California Rodeo Salinas, Toro Park |
| Seaside | Up-and-coming area with beautiful coastal views and a vibrant community. Very accessible for visitors looking for affordable accommodations near the Monterey Peninsula. | Seaside State Beach, Fort Ord Dunes State Park, Monterey County Fairgrounds, The Outlet Shops at Salinas, Seaside Aquarium |
| Marina | Family-friendly coastal city with outdoor activities and beautiful beaches. Good for tourists wanting a less commercialized experience near the ocean. | Marina State Beach, Fort Ord National Monument, Skyline Trail, Marina Dunes Preserve, The Fisherman's Wharf |
Understanding Airbnb License Requirements & STR Laws in Del Monte Forest (2026)
While Del Monte Forest, California, United States currently shows low STR regulations, specific Airbnb license requirements might still exist or change. Always verify the latest short term rental regulations and Airbnb license requirements directly with local government authorities for Del Monte Forest to ensure full compliance before hosting.
(Source: AirROI data, 2026, based on 1% licensed listings)
Top Performing Airbnb Properties in Del Monte Forest (2026)
Benchmark your potential! Explore examples of top-performing Airbnb properties in Del Monte Forestbased on Trailing Twelve Month (TTM) revenue. Analyze their characteristics, revenue, occupancy rate, and ADR to understand what drives success in this market.

Luxe1 panoramic Pebble estate
Entire Place • 6 bedrooms
Lx18 golfers dream retreat for concours delegance
Entire Place • 5 bedrooms

Pebble Golfer secret getaway
Entire Place • 4 bedrooms
Cypress Pebble Sea Manor Luxe37
Entire Place • 4 bedrooms
3770 Stone's Throw ~ Walk to the Ocean and Town
Entire Place • 3 bedrooms

Cypress Point: Golf, Ocean View, 6 Bed - 4 Bath
Entire Place • 6 bedrooms
Note: Performance varies based on location, size, amenities, seasonality, and management quality. Data reflects the past 12 months.
Top Performing Airbnb Hosts in Del Monte Forest (2026)
Learn from the best! This table showcases top-performing Airbnb hosts in Del Monte Forest based on the number of properties managed and estimated total revenue over the past year. Analyze their scale and performance metrics.
| Host Name | Properties | Grossing Revenue | Stay Reviews | Avg Rating |
|---|---|---|---|---|
| Luxe | 5 | $2,401,843 | 166 | 4.77/5.0 |
| Carmel Coast Estate | 10 | $1,801,338 | 539 | 4.96/5.0 |
| Sanctuary Vacation Rentals | 9 | $1,561,470 | 233 | 4.81/5.0 |
| Jack | 7 | $875,159 | 512 | 4.87/5.0 |
| Jacci | 2 | $463,880 | 56 | 4.90/5.0 |
| Monterey Rentals | 2 | $367,849 | 14 | 5.00/5.0 |
| Barbie | 3 | $351,097 | 73 | 4.99/5.0 |
| Martin | 5 | $284,672 | 499 | 4.69/5.0 |
| Kristina Isabella | 2 | $274,517 | 87 | 4.87/5.0 |
| Susan | 1 | $262,342 | 21 | 5.00/5.0 |
Analyzing the strategies of top hosts, such as their property selection, pricing, and guest communication, can offer valuable lessons for optimizing your own Airbnb operations in Del Monte Forest.
Dive Deeper: Advanced Del Monte Forest STR Market Data (2026)
Ready to unlock more insights? AirROI provides access to advanced metrics and comprehensive Airbnb data for Del Monte Forest. Explore detailed analytics beyond this report to refine your investment strategy, optimize pricing, and maximize your vacation rental profits.
Explore Advanced MetricsDel Monte Forest Short-Term Rental Market Composition (2026): Property & Room Types
Room Type Distribution
Property Type Distribution
Market Composition Insights for Del Monte Forest
- The Del Monte Forest Airbnb market composition is heavily skewed towards Entire Home/Apt listings, which make up 92.4% of the 105 active rentals. This indicates strong guest preference for privacy and space.
- Looking at the property type distribution in Del Monte Forest, House properties are the most common (89.5%), reflecting the local real estate landscape.
- Houses represent a significant 89.5% portion, catering likely to families or larger groups.
- Smaller segments like apartment/condo, hotel/boutique (combined 3.8%) offer potential for unique stay experiences.
Del Monte Forest Airbnb Room Capacity Analysis (2026): Bedroom Distribution
Distribution of Listings by Number of Bedrooms
Room Capacity Insights for Del Monte Forest
- The dominant room capacity in Del Monte Forest is 3 bedrooms listings, making up 30.5% of the market. This suggests a strong demand for properties suitable for families or small groups.
- Together, 3 bedrooms and 4 bedrooms properties represent 52.4% of the active Airbnb listings in Del Monte Forest, indicating a high concentration in these sizes.
- A significant 72.4% of listings offer 3+ bedrooms, catering to larger groups and families seeking more space in Del Monte Forest.
Del Monte Forest Vacation Rental Guest Capacity Trends (2026)
Distribution of Listings by Guest Capacity
Guest Capacity Insights for Del Monte Forest
- The most common guest capacity trend in Del Monte Forest vacation rentals is listings accommodating 8+ guests (45.7%). This suggests the primary traveler segment is likely larger groups.
- Properties designed for 8+ guests and 6 guests dominate the Del Monte Forest STR market, accounting for 66.7% of listings.
- 71.5% of properties accommodate 6+ guests, serving the market segment for larger families or group travel in Del Monte Forest.
- On average, properties in Del Monte Forest are equipped to host 5.9 guests.
Del Monte Forest Airbnb Booking Patterns (2026): Available vs. Booked Days
Available Days Distribution
Booked Days Distribution
Booking Pattern Insights for Del Monte Forest
- The most common availability pattern in Del Monte Forest falls within the 181-270 days range, representing 39% of listings. This suggests many properties have significant open periods on their calendars.
- Approximately 61.9% of listings show high availability (181+ days open annually), indicating potential for increased bookings or specific owner usage patterns.
- For booked days, the 91-180 days range is most frequent in Del Monte Forest (38.1%), reflecting common guest stay durations or potential owner blocking patterns.
- A notable 40.0% of properties secure long booking periods (181+ days booked per year), highlighting successful long-term rental strategies or significant owner usage.
Del Monte Forest Airbnb Minimum Stay Requirements Analysis
Distribution of Listings by Minimum Night Requirement
1 Night
16 listings
15.2% of total
2 Nights
18 listings
17.1% of total
3 Nights
7 listings
6.7% of total
4-6 Nights
6 listings
5.7% of total
7-29 Nights
6 listings
5.7% of total
30+ Nights
52 listings
49.5% of total
Key Insights
- The most prevalent minimum stay requirement in Del Monte Forest is 30+ Nights, adopted by 49.5% of listings. This highlights the market's preference for longer commitments.
- A significant segment (49.5%) caters to monthly stays (30+ nights) in Del Monte Forest, pointing to opportunities in the extended-stay market.
Recommendations
- Align with the market by considering a 30+ Nights minimum stay, as 49.5% of Del Monte Forest hosts use this setting.
- If feasible, allowing 1-night stays, especially midweek or during low season, could capture last-minute bookings, as only 15.2% currently do.
- Explore offering discounts for stays of 30+ nights to attract the 49.5% of the market seeking extended stays.
- Adjust minimum nights based on seasonality – potentially shorter during low season and longer during peak demand periods in Del Monte Forest.
Del Monte Forest Airbnb Cancellation Policy Trends Analysis (2026)
Super Strict 60 Days
22 listings
21% of total
Super Strict 30 Days
1 listings
1% of total
Flexible
4 listings
3.8% of total
Moderate
12 listings
11.4% of total
Firm
32 listings
30.5% of total
Strict
34 listings
32.4% of total
Cancellation Policy Insights for Del Monte Forest
- The prevailing Airbnb cancellation policy trend in Del Monte Forest is Strict, used by 32.4% of listings.
- A majority (62.9%) of hosts in Del Monte Forest utilize Firm or Strict policies, indicating a market where hosts prioritize booking security.
Recommendations for Hosts
- Consider adopting a Strict policy to align with the 32.4% market standard in Del Monte Forest.
- With 32.4% using Strict terms, this is a viable option in Del Monte Forest, particularly for high-value properties or during peak demand periods.
- Regularly review your cancellation policy against competitors and market demand shifts in Del Monte Forest.
Del Monte Forest STR Booking Lead Time Analysis (2026)
Average Booking Lead Time by Month
Booking Lead Time Insights for Del Monte Forest
- The overall average booking lead time for vacation rentals in Del Monte Forest is 69 days.
- Guests book furthest in advance for stays during August (average 93 days), likely coinciding with peak travel demand or local events.
- The shortest booking windows occur for stays in February (average 37 days), indicating more last-minute travel plans during this time.
- Seasonally, Fall (85 days avg.) sees the longest lead times, while Winter (52 days avg.) has the shortest, reflecting typical travel planning cycles.
Recommendations for Hosts
- Use the overall average lead time (69 days) as a baseline for your pricing and availability strategy in Del Monte Forest.
- For August stays, consider implementing length-of-stay discounts or slightly higher rates for bookings made less than 93 days out to capitalize on advance planning.
- Target marketing efforts for the Fall season well in advance (at least 85 days) to capture early planners.
- Monitor your own booking lead times against these Del Monte Forest averages to identify opportunities for dynamic pricing adjustments.
Popular & Essential Airbnb Amenities in Del Monte Forest (2026)
Amenity Prevalence
Amenity Insights for Del Monte Forest
- Essential amenities in Del Monte Forest that guests expect include: Wifi, Heating, Free parking on premises, Smoke alarm, TV, Coffee maker, Hot water. Lacking these (any) could significantly impact bookings.
- Popular amenities like Carbon monoxide alarm, Hangers, Refrigerator are common but not universal. Offering these can provide a competitive edge.
Recommendations for Hosts
- Ensure your listing includes all essential amenities for Del Monte Forest: Wifi, Heating, Free parking on premises, Smoke alarm, TV, Coffee maker, Hot water.
- Prioritize adding missing essentials: Free parking on premises, Smoke alarm, TV, Coffee maker, Hot water.
- Consider adding popular differentiators like Carbon monoxide alarm or Hangers to increase appeal.
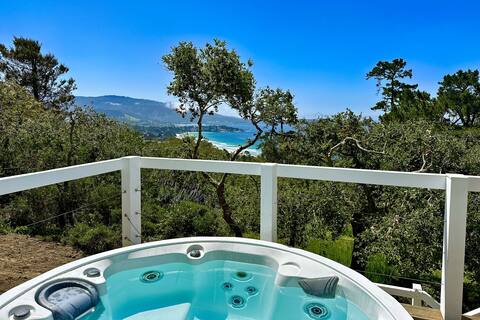
- Highlight unique or less common amenities you offer (e.g., hot tub, dedicated workspace, EV charger) in your listing description and photos.
- Regularly check competitor amenities in Del Monte Forest to stay competitive.
Del Monte Forest Airbnb Guest Demographics & Profile Analysis (2026)
Guest Profile Summary for Del Monte Forest
- The typical guest profile for Airbnb in Del Monte Forest consists of primarily domestic travelers (92%), often arriving from nearby San Francisco, typically belonging to the Post-2000s (Gen Z/Alpha) group (50%), primarily speaking English or Spanish.
- Domestic travelers account for 91.6% of guests.
- Key international markets include United States (91.6%) and United Kingdom (2.5%).
- Top languages spoken are English (65.5%) followed by Spanish (11%).
- A significant demographic segment is the Post-2000s (Gen Z/Alpha) group, representing 50% of guests.
Recommendations for Hosts
- Target domestic marketing efforts towards travelers from San Francisco and Los Angeles.
- Tailor amenities and listing descriptions to appeal to the dominant Post-2000s (Gen Z/Alpha) demographic (e.g., highlight fast WiFi, smart home features, local guides).
- Highlight unique local experiences or amenities relevant to the primary guest profile.
- Consider seasonal promotions aligned with peak travel times for key origin markets.
Nearby Short-Term Rental Market Comparison
How does the Del Monte Forest Airbnb market stack up against its neighbors? Compare key performance metrics like average monthly revenue, ADR, and occupancy rates in surrounding areas to understand the broader regional STR landscape.
| Market | Active Properties | Monthly Revenue | Daily Rate | Avg. Occupancy |
|---|---|---|---|---|
| Carmel Point | 15 | $14,483 | $1046.17 | 54% |
| Moss Beach | 34 | $10,092 | $676.91 | 53% |
| Carmel-by-the-Sea | 305 | $8,657 | $680.02 | 49% |
| Pleasure Point | 90 | $7,920 | $525.95 | 52% |
| Carmel | 29 | $7,901 | $597.00 | 49% |
| Castroville | 16 | $7,830 | $558.55 | 50% |
| Stinson Beach | 106 | $7,814 | $812.15 | 43% |
| Sand City | 10 | $7,391 | $497.43 | 60% |
| Del Rey Oaks | 33 | $7,281 | $474.67 | 54% |
| Pajaro Dunes | 64 | $7,233 | $610.68 | 42% |