Davis Airbnb Market Analysis 2026: Short Term Rental Data & Vacation Rental Statistics in California, United States
Is Airbnb profitable in Davis in 2026? Explore comprehensive Airbnb analytics for Davis, California, United States to uncover income potential. This 2026 STR market report for Davis, based on AirROI data from February 2025 to January 2026, reveals key trends in the niche market of 126 active listings.
Whether you're considering an Airbnb investment in Davis, optimizing your existing vacation rental, or exploring rental arbitrage opportunities, understanding the Davis Airbnb data is crucial. Leveraging the low regulation environment is key to maximizing your short term rental income potential. Let's dive into the specifics.
Key Davis Airbnb Performance Metrics Overview
Monthly Airbnb Revenue Variations & Income Potential in Davis (2026)
Understanding the monthly revenue variations for Airbnb listings in Davis is key to maximizing your short term rental income potential. Seasonality significantly impacts earnings. Our analysis, based on data from the past 12 months, shows that the peak revenue month for STRs in Davis is typically October, while January often presents the lowest earnings, highlighting opportunities for strategic pricing adjustments during shoulder and low seasons. Explore the typical Airbnb income in Davis across different performance tiers:
- Best-in-class properties (Top 10%) achieve $6,213+ monthly, often utilizing dynamic pricing and superior guest experiences.
- Strong performing properties (Top 25%) earn $4,170 or more, indicating effective management and desirable locations/amenities.
- Typical properties (Median) generate around $2,351 per month, representing the average market performance.
- Entry-level properties (Bottom 25%) see earnings around $1,252, often with potential for optimization.
Average Monthly Airbnb Earnings Trend in Davis
Davis Airbnb Occupancy Rate Trends (2026)
Maximize your bookings by understanding the Davis STR occupancy trends. Seasonal demand shifts significantly influence how often properties are booked. Typically, Septembersees the highest demand (peak season occupancy), while January experiences the lowest (low season). Effective strategies, like adjusting minimum stays or offering promotions, can boost occupancy during slower periods. Here's how different property tiers perform in Davis:
- Best-in-class properties (Top 10%) achieve 84%+ occupancy, indicating high desirability and potentially optimized availability.
- Strong performing properties (Top 25%) maintain 70% or higher occupancy, suggesting good market fit and guest satisfaction.
- Typical properties (Median) have an occupancy rate around 50%.
- Entry-level properties (Bottom 25%) average 26% occupancy, potentially facing higher vacancy.
Average Monthly Occupancy Rate Trend in Davis
Average Daily Rate (ADR) Airbnb Trends in Davis (2026)
Effective short term rental pricing strategy in Davis involves understanding monthly ADR fluctuations. The Average Daily Rate (ADR) for Airbnb in Davis typically peaks in June and dips lowest during February. Leveraging Airbnb dynamic pricing tools or strategies based on this seasonality can significantly boost revenue. Here's a look at the typical nightly rates achieved:
- Best-in-class properties (Top 10%) command rates of $402+ per night, often due to premium features or locations.
- Strong performing properties (Top 25%) achieve nightly rates of $271 or more.
- Typical properties (Median) charge around $149 per night.
- Entry-level properties (Bottom 25%) earn around $89 per night.
Average Daily Rate (ADR) Trend by Month in Davis
Get Live Davis Market Intelligence 👇

Explore Real-time Analytics
Airbnb Seasonality Analysis & Trends in Davis (2026)
Peak Season (October, May, September)
- Revenue averages $3,525 per month
- Occupancy rates average 53.3%
- Daily rates average $226
Shoulder Season
- Revenue averages $3,175 per month
- Occupancy maintains around 48.9%
- Daily rates hold near $222
Low Season (January, February, August)
- Revenue drops to average $2,406 per month
- Occupancy decreases to average 43.7%
- Daily rates adjust to average $213
Seasonality Insights for Davis
- The Airbnb seasonality in Davis shows moderate seasonality with distinct peak and low periods. While the sections above show seasonal averages, it's also insightful to look at the extremes:
- During the high season, the absolute peak month showcases Davis's highest earning potential, with monthly revenues capable of climbing to $3,712, occupancy reaching a high of 56.1%, and ADRs peaking at $233.
- Conversely, the slowest single month of the year, typically falling within the low season, marks the market's lowest point. In this month, revenue might dip to $1,982, occupancy could drop to 32.4%, and ADRs may adjust down to $204.
- Understanding both the seasonal averages and these monthly peaks and troughs in revenue, occupancy, and ADR is crucial for maximizing your Airbnb profit potential in Davis.
Seasonal Strategies for Maximizing Profit
- Peak Season: Maximize revenue through premium pricing and potentially longer minimum stays. Ensure high availability.
- Low Season: Offer competitive pricing, special promotions (e.g., extended stay discounts), and flexible cancellation policies. Target off-season travelers like remote workers or budget-conscious guests.
- Shoulder Seasons: Implement dynamic pricing that balances peak and low rates. Target weekend travelers or specific events. Offer slightly more flexible terms than peak season.
- Regularly analyze your own performance against these Davis seasonality benchmarks and adjust your pricing and availability strategy accordingly.
Best Areas for Airbnb Investment in Davis (2026)
Exploring the top neighborhoods for short-term rentals in Davis? This section highlights key areas, outlining why they are attractive for hosts and guests, along with notable local attractions. Consider these locations based on your target guest profile and investment strategy.
| Neighborhood / Area | Why Host Here? (Target Guests & Appeal) | Key Attractions & Landmarks |
|---|---|---|
| Central Davis | The heart of Davis, close to the University of California and local amenities. Ideal for hosting students, faculty, and visitors to campus events. | UC Davis campus, Downtown Davis, Davis Farmers Market, Bike trails, Davis Arts Center |
| East Davis | A quiet suburban area with family-friendly neighborhoods. Attractive for longer stays, appealing to families and academics visiting the university. | Wildhorse Golf Club, North Davis Greenway, Davis Center for the Performing Arts, Local parks, Neighborhood shops |
| West Davis | Features spacious homes and proximity to parks and schools. Great for families and groups looking for extended stays in a peaceful environment. | Mace Ranch Park, Community gardens, Davis College Park, Trail access, Local eateries |
| Davis Downtown | Vibrant area with restaurants, shops, and nightlife. Perfect for short-term guests wanting to explore local culture and entertainment. | Davis Farmers Market, Historic train depot, Various dining options, Local festivals, Live music events |
| South Davis | Close to the university and residential communities. Appeals to guests looking for campus-related accommodation or family visits. | Davis School District, Local parks, Shopping centers, Community events, Bicycle paths |
| North Davis | A mix of residential neighborhoods and green spaces, ideal for those seeking a more suburban feel while still being accessible to downtown. | Davis Wetlands, North Davis Park, Playgrounds, Nature trails, Local markets |
| University Park | Adjacent to the UC Davis campus, a prime location for renting to students or university staff and visitors attending events. | University of California, Davis, Silo Union, Student housing, Cultural events, Historic sites |
| Old East Davis | A charming historic area with unique homes and close-knit communities, attractive for guests looking for character and a sense of place. | Old East Davis Neighborhood, Historic homes, Community art shows, Local cafés, Quiet streets |
Understanding Airbnb License Requirements & STR Laws in Davis (2026)
While Davis, California, United States currently shows low STR regulations, specific Airbnb license requirements might still exist or change. Always verify the latest short term rental regulations and Airbnb license requirements directly with local government authorities for Davis to ensure full compliance before hosting.
(Source: AirROI data, 2026, finding no licensed listings among those analyzed)
Top Performing Airbnb Properties in Davis (2026)
Benchmark your potential! Explore examples of top-performing Airbnb properties in Davisbased on Trailing Twelve Month (TTM) revenue. Analyze their characteristics, revenue, occupancy rate, and ADR to understand what drives success in this market.
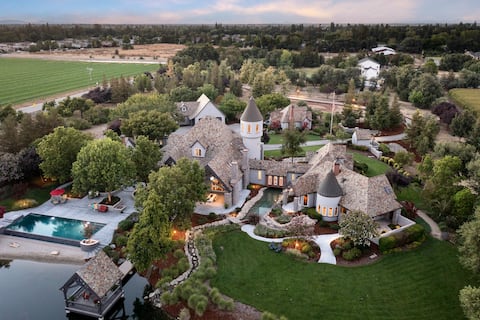
Luxury Castle Retreat Sacramento Davis
Entire Place • 7 bedrooms
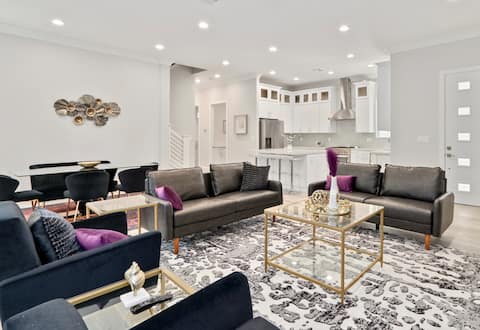
The Ayla Plan: 4BR/3.5BA, 2600 Sq Ft, Near Campus
Entire Place • 4 bedrooms
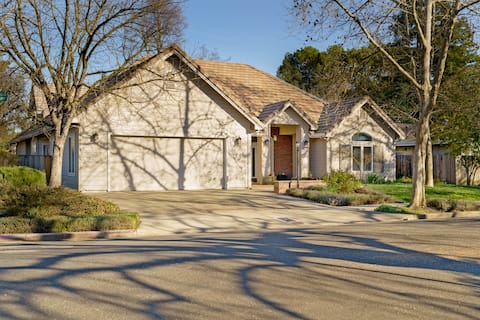
Charming 3 Bedroom, 1 Block from UCD
Entire Place • 3 bedrooms

The Salma Plan: 4BR/3.5BA, 2600 Sq Ft, Near Campus
Entire Place • 4 bedrooms
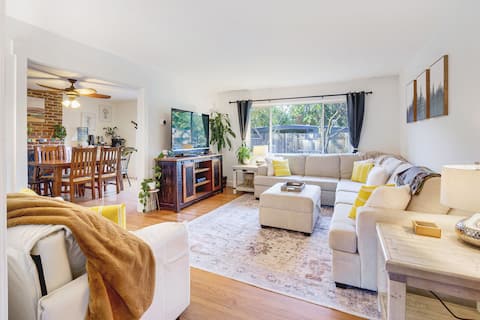
A Davis Retreat: Cozy & Central
Entire Place • 3 bedrooms
Village Homes: Elegant Serene Retreat
Entire Place • 3 bedrooms
Note: Performance varies based on location, size, amenities, seasonality, and management quality. Data reflects the past 12 months.
Top Performing Airbnb Hosts in Davis (2026)
Learn from the best! This table showcases top-performing Airbnb hosts in Davis based on the number of properties managed and estimated total revenue over the past year. Analyze their scale and performance metrics.
| Host Name | Properties | Grossing Revenue | Stay Reviews | Avg Rating |
|---|---|---|---|---|
| Darish | 3 | $275,197 | 186 | 4.98/5.0 |
| Mila | 3 | $220,626 | 54 | 4.99/5.0 |
| Eli | 6 | $158,044 | 643 | 4.92/5.0 |
| Evolve | 2 | $99,597 | 137 | 4.83/5.0 |
| Sharon | 1 | $98,567 | 10 | 4.70/5.0 |
| Brooke | 1 | $84,801 | 31 | 5.00/5.0 |
| Lilly | 1 | $78,279 | 90 | 4.99/5.0 |
| Martin | 1 | $69,445 | 6 | 5.00/5.0 |
| Rachel | 2 | $68,704 | 139 | 4.97/5.0 |
| Irina | 1 | $68,337 | 32 | 5.00/5.0 |
Analyzing the strategies of top hosts, such as their property selection, pricing, and guest communication, can offer valuable lessons for optimizing your own Airbnb operations in Davis.
Dive Deeper: Advanced Davis STR Market Data (2026)
Ready to unlock more insights? AirROI provides access to advanced metrics and comprehensive Airbnb data for Davis. Explore detailed analytics beyond this report to refine your investment strategy, optimize pricing, and maximize your vacation rental profits.
Explore Advanced MetricsDavis Short-Term Rental Market Composition (2026): Property & Room Types
Room Type Distribution
Property Type Distribution
Market Composition Insights for Davis
- The Davis Airbnb market composition is heavily skewed towards Entire Home/Apt listings, which make up 66.7% of the 126 active rentals. This indicates strong guest preference for privacy and space.
- However, a notable 33.3% share for Private Rooms suggests opportunities for budget-conscious travelers or hosts renting out spare rooms.
- Looking at the property type distribution in Davis, House properties are the most common (71.4%), reflecting the local real estate landscape.
- Houses represent a significant 71.4% portion, catering likely to families or larger groups.
- The presence of 9.5% Hotel/Boutique listings indicates integration with traditional hospitality.
- Smaller segments like outdoor/unique, unique stays (combined 4.8%) offer potential for unique stay experiences.
Davis Airbnb Room Capacity Analysis (2026): Bedroom Distribution
Distribution of Listings by Number of Bedrooms
Room Capacity Insights for Davis
- The dominant room capacity in Davis is 1 bedroom listings, making up 23% of the market. This suggests a strong demand for properties suitable for couples or solo travelers.
- Together, 1 bedroom and 3 bedrooms properties represent 40.5% of the active Airbnb listings in Davis, indicating a high concentration in these sizes.
- A significant 27.0% of listings offer 3+ bedrooms, catering to larger groups and families seeking more space in Davis.
Davis Vacation Rental Guest Capacity Trends (2026)
Distribution of Listings by Guest Capacity
Guest Capacity Insights for Davis
- The most common guest capacity trend in Davis vacation rentals is listings accommodating 2 guests (17.5%). This suggests the primary traveler segment is likely couples or solo travelers.
- Properties designed for 2 guests and 4 guests dominate the Davis STR market, accounting for 34.2% of listings.
- 23.8% of properties accommodate 6+ guests, serving the market segment for larger families or group travel in Davis.
- On average, properties in Davis are equipped to host 3.1 guests.
Davis Airbnb Booking Patterns (2026): Available vs. Booked Days
Available Days Distribution
Booked Days Distribution
Booking Pattern Insights for Davis
- The most common availability pattern in Davis falls within the 271-366 days range, representing 39.7% of listings. This suggests many properties have significant open periods on their calendars.
- Approximately 65.1% of listings show high availability (181+ days open annually), indicating potential for increased bookings or specific owner usage patterns.
- For booked days, the 181-270 days range is most frequent in Davis (31.7%), reflecting common guest stay durations or potential owner blocking patterns.
- A notable 36.5% of properties secure long booking periods (181+ days booked per year), highlighting successful long-term rental strategies or significant owner usage.
Davis Airbnb Minimum Stay Requirements Analysis
Distribution of Listings by Minimum Night Requirement
1 Night
31 listings
24.6% of total
2 Nights
25 listings
19.8% of total
3 Nights
4 listings
3.2% of total
4-6 Nights
9 listings
7.1% of total
7-29 Nights
14 listings
11.1% of total
30+ Nights
43 listings
34.1% of total
Key Insights
- The most prevalent minimum stay requirement in Davis is 30+ Nights, adopted by 34.1% of listings. This highlights the market's preference for longer commitments.
- A significant segment (34.1%) caters to monthly stays (30+ nights) in Davis, pointing to opportunities in the extended-stay market.
Recommendations
- Align with the market by considering a 30+ Nights minimum stay, as 34.1% of Davis hosts use this setting.
- If feasible, allowing 1-night stays, especially midweek or during low season, could capture last-minute bookings, as only 24.6% currently do.
- Explore offering discounts for stays of 30+ nights to attract the 34.1% of the market seeking extended stays.
- Adjust minimum nights based on seasonality – potentially shorter during low season and longer during peak demand periods in Davis.
Davis Airbnb Cancellation Policy Trends Analysis (2026)
Limited
2 listings
1.6% of total
Flexible
27 listings
21.4% of total
Moderate
34 listings
27% of total
Firm
46 listings
36.5% of total
Strict
17 listings
13.5% of total
Cancellation Policy Insights for Davis
- The prevailing Airbnb cancellation policy trend in Davis is Firm, used by 36.5% of listings.
- There's a relatively balanced mix between guest-friendly (48.4%) and stricter (50.0%) policies, offering choices for different guest needs.
Recommendations for Hosts
- Consider adopting a Firm policy to align with the 36.5% market standard in Davis.
- Using a Strict policy might deter some guests, as only 13.5% of listings use it. Evaluate if potential revenue protection outweighs possible lower booking rates.
- Regularly review your cancellation policy against competitors and market demand shifts in Davis.
Davis STR Booking Lead Time Analysis (2026)
Average Booking Lead Time by Month
Booking Lead Time Insights for Davis
- The overall average booking lead time for vacation rentals in Davis is 45 days.
- Guests book furthest in advance for stays during June (average 74 days), likely coinciding with peak travel demand or local events.
- The shortest booking windows occur for stays in February (average 29 days), indicating more last-minute travel plans during this time.
- Seasonally, Fall (52 days avg.) sees the longest lead times, while Winter (40 days avg.) has the shortest, reflecting typical travel planning cycles.
Recommendations for Hosts
- Use the overall average lead time (45 days) as a baseline for your pricing and availability strategy in Davis.
- For June stays, consider implementing length-of-stay discounts or slightly higher rates for bookings made less than 74 days out to capitalize on advance planning.
- Target marketing efforts for the Fall season well in advance (at least 52 days) to capture early planners.
- Monitor your own booking lead times against these Davis averages to identify opportunities for dynamic pricing adjustments.
Popular & Essential Airbnb Amenities in Davis (2026)
Amenity Prevalence
Amenity Insights for Davis
- Essential amenities in Davis that guests expect include: Wifi, Smoke alarm, Air conditioning, Carbon monoxide alarm, Heating. Lacking these (any) could significantly impact bookings.
- Popular amenities like Hot water, Coffee maker, Dishes and silverware are common but not universal. Offering these can provide a competitive edge.
Recommendations for Hosts
- Ensure your listing includes all essential amenities for Davis: Wifi, Smoke alarm, Air conditioning, Carbon monoxide alarm, Heating.
- Prioritize adding missing essentials: Wifi, Smoke alarm, Air conditioning, Carbon monoxide alarm, Heating.
- Consider adding popular differentiators like Hot water or Coffee maker to increase appeal.
- Highlight unique or less common amenities you offer (e.g., hot tub, dedicated workspace, EV charger) in your listing description and photos.
- Regularly check competitor amenities in Davis to stay competitive.
Davis Airbnb Guest Demographics & Profile Analysis (2026)
Guest Profile Summary for Davis
- The typical guest profile for Airbnb in Davis consists of primarily domestic travelers (90%), often arriving from nearby Davis, typically belonging to the Post-2000s (Gen Z/Alpha) group (50%), primarily speaking English or Spanish.
- Domestic travelers account for 89.7% of guests.
- Key international markets include United States (89.7%) and United Kingdom (1.1%).
- Top languages spoken are English (58.9%) followed by Spanish (14.2%).
- A significant demographic segment is the Post-2000s (Gen Z/Alpha) group, representing 50% of guests.
Recommendations for Hosts
- Target domestic marketing efforts towards travelers from Davis and Los Angeles.
- Tailor amenities and listing descriptions to appeal to the dominant Post-2000s (Gen Z/Alpha) demographic (e.g., highlight fast WiFi, smart home features, local guides).
- Highlight unique local experiences or amenities relevant to the primary guest profile.
- Consider seasonal promotions aligned with peak travel times for key origin markets.
Nearby Short-Term Rental Market Comparison
How does the Davis Airbnb market stack up against its neighbors? Compare key performance metrics like average monthly revenue, ADR, and occupancy rates in surrounding areas to understand the broader regional STR landscape.
| Market | Active Properties | Monthly Revenue | Daily Rate | Avg. Occupancy |
|---|---|---|---|---|
| Moss Beach | 34 | $10,092 | $676.91 | 53% |
| Sonoma | 228 | $9,647 | $819.87 | 43% |
| Marshall | 18 | $8,897 | $607.75 | 50% |
| St. Helena | 50 | $8,684 | $924.70 | 38% |
| Kenwood | 60 | $8,643 | $810.83 | 41% |
| Glen Ellen | 85 | $8,482 | $799.53 | 43% |
| Eldridge | 21 | $8,410 | $930.61 | 41% |
| Dillon Beach | 82 | $8,062 | $703.26 | 41% |
| Stinson Beach | 106 | $7,814 | $812.15 | 43% |
| Healdsburg | 195 | $7,538 | $744.46 | 41% |