Dana Point Airbnb Market Analysis 2026: Short Term Rental Data & Vacation Rental Statistics in California, United States
Is Airbnb profitable in Dana Point in 2026? Explore comprehensive Airbnb analytics for Dana Point, California, United States to uncover income potential. This 2026 STR market report for Dana Point, based on AirROI data from February 2025 to January 2026, reveals key trends in the market of 288 active listings.
Whether you're considering an Airbnb investment in Dana Point, optimizing your existing vacation rental, or exploring rental arbitrage opportunities, understanding the Dana Point Airbnb data is crucial. Leveraging the low regulation environment is key to maximizing your short term rental income potential. Let's dive into the specifics.
Key Dana Point Airbnb Performance Metrics Overview
Monthly Airbnb Revenue Variations & Income Potential in Dana Point (2026)
Understanding the monthly revenue variations for Airbnb listings in Dana Point is key to maximizing your short term rental income potential. Seasonality significantly impacts earnings. Our analysis, based on data from the past 12 months, shows that the peak revenue month for STRs in Dana Point is typically July, while January often presents the lowest earnings, highlighting opportunities for strategic pricing adjustments during shoulder and low seasons. Explore the typical Airbnb income in Dana Point across different performance tiers:
- Best-in-class properties (Top 10%) achieve $15,556+ monthly, often utilizing dynamic pricing and superior guest experiences.
- Strong performing properties (Top 25%) earn $7,735 or more, indicating effective management and desirable locations/amenities.
- Typical properties (Median) generate around $4,657 per month, representing the average market performance.
- Entry-level properties (Bottom 25%) see earnings around $2,483, often with potential for optimization.
Average Monthly Airbnb Earnings Trend in Dana Point
Dana Point Airbnb Occupancy Rate Trends (2026)
Maximize your bookings by understanding the Dana Point STR occupancy trends. Seasonal demand shifts significantly influence how often properties are booked. Typically, Julysees the highest demand (peak season occupancy), while January experiences the lowest (low season). Effective strategies, like adjusting minimum stays or offering promotions, can boost occupancy during slower periods. Here's how different property tiers perform in Dana Point:
- Best-in-class properties (Top 10%) achieve 85%+ occupancy, indicating high desirability and potentially optimized availability.
- Strong performing properties (Top 25%) maintain 70% or higher occupancy, suggesting good market fit and guest satisfaction.
- Typical properties (Median) have an occupancy rate around 47%.
- Entry-level properties (Bottom 25%) average 24% occupancy, potentially facing higher vacancy.
Average Monthly Occupancy Rate Trend in Dana Point
Average Daily Rate (ADR) Airbnb Trends in Dana Point (2026)
Effective short term rental pricing strategy in Dana Point involves understanding monthly ADR fluctuations. The Average Daily Rate (ADR) for Airbnb in Dana Point typically peaks in July and dips lowest during February. Leveraging Airbnb dynamic pricing tools or strategies based on this seasonality can significantly boost revenue. Here's a look at the typical nightly rates achieved:
- Best-in-class properties (Top 10%) command rates of $860+ per night, often due to premium features or locations.
- Strong performing properties (Top 25%) achieve nightly rates of $454 or more.
- Typical properties (Median) charge around $289 per night.
- Entry-level properties (Bottom 25%) earn around $195 per night.
Average Daily Rate (ADR) Trend by Month in Dana Point
Get Live Dana Point Market Intelligence 👇

Explore Real-time Analytics
Airbnb Seasonality Analysis & Trends in Dana Point (2026)
Peak Season (July, August, June)
- Revenue averages $9,411 per month
- Occupancy rates average 59.4%
- Daily rates average $431
Shoulder Season
- Revenue averages $6,424 per month
- Occupancy maintains around 46.1%
- Daily rates hold near $401
Low Season (January, February, November)
- Revenue drops to average $4,698 per month
- Occupancy decreases to average 39.7%
- Daily rates adjust to average $385
Seasonality Insights for Dana Point
- The Airbnb seasonality in Dana Point shows highly seasonal trends requiring careful strategy. While the sections above show seasonal averages, it's also insightful to look at the extremes:
- During the high season, the absolute peak month showcases Dana Point's highest earning potential, with monthly revenues capable of climbing to $11,045, occupancy reaching a high of 66.5%, and ADRs peaking at $438.
- Conversely, the slowest single month of the year, typically falling within the low season, marks the market's lowest point. In this month, revenue might dip to $3,865, occupancy could drop to 31.3%, and ADRs may adjust down to $375.
- Understanding both the seasonal averages and these monthly peaks and troughs in revenue, occupancy, and ADR is crucial for maximizing your Airbnb profit potential in Dana Point.
Seasonal Strategies for Maximizing Profit
- Peak Season: Maximize revenue through premium pricing and potentially longer minimum stays. Ensure high availability.
- Low Season: Offer competitive pricing, special promotions (e.g., extended stay discounts), and flexible cancellation policies. Target off-season travelers like remote workers or budget-conscious guests.
- Shoulder Seasons: Implement dynamic pricing that balances peak and low rates. Target weekend travelers or specific events. Offer slightly more flexible terms than peak season.
- Regularly analyze your own performance against these Dana Point seasonality benchmarks and adjust your pricing and availability strategy accordingly.
Best Areas for Airbnb Investment in Dana Point (2026)
Exploring the top neighborhoods for short-term rentals in Dana Point? This section highlights key areas, outlining why they are attractive for hosts and guests, along with notable local attractions. Consider these locations based on your target guest profile and investment strategy.
| Neighborhood / Area | Why Host Here? (Target Guests & Appeal) | Key Attractions & Landmarks |
|---|---|---|
| Dana Point Harbor | A beautiful coastal area known for its scenic harbor, boating, and waterfront dining. It attracts tourists looking for a relaxed and picturesque beach experience. | Dana Point Harbor, Whale Watching Tours, Ocean Institute, Doheny State Beach, Dana Point Nature Interpretive Center |
| Capistrano Beach | A charming beach community known for its tranquil atmosphere and stunning ocean views. Perfect for families and travelers seeking a quiet getaway near the beach. | Capistrano Beach, Poche Beach, Beachfront Parks, Surfing Spots, Nearby Restaurants |
| Lantern District | The historic and vibrant downtown area of Dana Point, filled with shops, dining, and entertainment options. Popular with those looking to explore local culture and nightlife. | Lantern Bay Park, Restaurants and Cafes, Local Shops, Art Galleries, Scenic Ocean Views |
| Strand Beach | A secluded beach known for its beautiful sands and picturesque cliffs, ideal for beachgoers and nature lovers. Offers a tranquil retreat away from crowds. | Strand Beach Park, Hiking Trails, Scenic Walks, Sunbathing Spots, Wildlife Viewing |
| Salt Creek Beach | A popular beach for surfers and sunbathers, featuring beautiful scenery and amenities. Great for tourists who love beach activities and community events. | Salt Creek Beach Park, Surfing Lessons, Family-Friendly Areas, Beach Volleyball Courts, Nearby Restaurants |
| Monarch Beach | An upscale residential area known for luxury resorts and beautiful homes, attracting visitors looking for a high-end beach experience. | Monarch Beach Resort, Golf Courses, Spa Services, Private Beaches, Gourmet Dining |
| Doheny State Beach | A well-known state beach that offers great camping facilities and beach activities. Ideal for families and outdoor enthusiasts. | Doheny State Beach Campsites, Fishing and Surfing, Doheny Surf Shop, Beach Volleyball, Nature Trails |
| Niguel Shores | A gated beach community that offers privacy and proximity to stunning beaches, appealing to those looking for a more exclusive vacation experience. | Niguel Shores Beach, Private Pools, Tennis Courts, Community Parks, Ocean Views |
Understanding Airbnb License Requirements & STR Laws in Dana Point (2026)
While Dana Point, California, United States currently shows low STR regulations, specific Airbnb license requirements might still exist or change. Always verify the latest short term rental regulations and Airbnb license requirements directly with local government authorities for Dana Point to ensure full compliance before hosting.
(Source: AirROI data, 2026, finding no licensed listings among those analyzed)
Top Performing Airbnb Properties in Dana Point (2026)
Benchmark your potential! Explore examples of top-performing Airbnb properties in Dana Pointbased on Trailing Twelve Month (TTM) revenue. Analyze their characteristics, revenue, occupancy rate, and ADR to understand what drives success in this market.

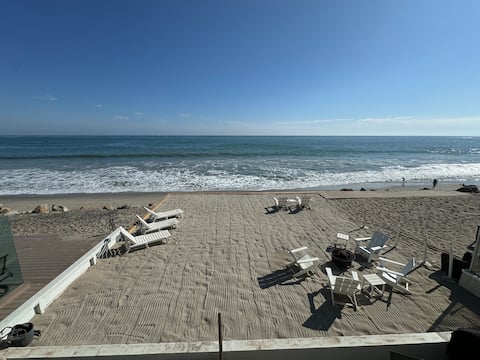
Oceanfront Family Home with Firepit on the Sand
Entire Place • 4 bedrooms

Beautiful Beachfront Getaway STR24-0030
Entire Place • 5 bedrooms
Beachfront Bliss | Steps to Sand + 5 Large BRs
Entire Place • 5 bedrooms

Oceanfront Oasis Retreat
Entire Place • 3 bedrooms
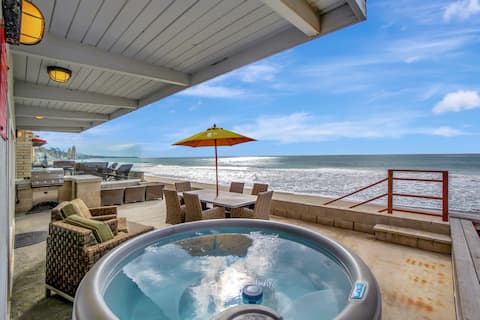
On The Sand! Ocean Front HOT TUB! STR14-0126
Entire Place • 3 bedrooms

Magical Beach House on the sand
Entire Place • 3 bedrooms
Note: Performance varies based on location, size, amenities, seasonality, and management quality. Data reflects the past 12 months.
Top Performing Airbnb Hosts in Dana Point (2026)
Learn from the best! This table showcases top-performing Airbnb hosts in Dana Point based on the number of properties managed and estimated total revenue over the past year. Analyze their scale and performance metrics.
| Host Name | Properties | Grossing Revenue | Stay Reviews | Avg Rating |
|---|---|---|---|---|
| Miriam | 12 | $1,582,752 | 893 | 4.83/5.0 |
| Chris | 8 | $1,097,212 | 799 | 4.83/5.0 |
| Michael | 3 | $612,740 | 231 | 4.77/5.0 |
| Tower 17 Properties & Manageme | 2 | $508,970 | 38 | 4.67/5.0 |
| Christopher Francis | 4 | $401,033 | 225 | 4.81/5.0 |
| Carmen | 1 | $375,041 | 50 | 4.96/5.0 |
| Traverse | 2 | $313,620 | 6 | 4.25/5.0 |
| Rita | 1 | $310,756 | 41 | 5.00/5.0 |
| AvantStay Newport Beach | 3 | $297,485 | 27 | 4.86/5.0 |
| Carla | 8 | $286,265 | 141 | 4.92/5.0 |
Analyzing the strategies of top hosts, such as their property selection, pricing, and guest communication, can offer valuable lessons for optimizing your own Airbnb operations in Dana Point.
Dive Deeper: Advanced Dana Point STR Market Data (2026)
Ready to unlock more insights? AirROI provides access to advanced metrics and comprehensive Airbnb data for Dana Point. Explore detailed analytics beyond this report to refine your investment strategy, optimize pricing, and maximize your vacation rental profits.
Explore Advanced MetricsDana Point Short-Term Rental Market Composition (2026): Property & Room Types
Room Type Distribution
Property Type Distribution
Market Composition Insights for Dana Point
- The Dana Point Airbnb market composition is heavily skewed towards Entire Home/Apt listings, which make up 94.8% of the 288 active rentals. This indicates strong guest preference for privacy and space.
- Looking at the property type distribution in Dana Point, House properties are the most common (55.6%), reflecting the local real estate landscape.
- Houses represent a significant 55.6% portion, catering likely to families or larger groups.
- Smaller segments like hotel/boutique, others (combined 3.4%) offer potential for unique stay experiences.
Dana Point Airbnb Room Capacity Analysis (2026): Bedroom Distribution
Distribution of Listings by Number of Bedrooms
Room Capacity Insights for Dana Point
- The dominant room capacity in Dana Point is 2 bedrooms listings, making up 43.8% of the market. This suggests a strong demand for properties suitable for couples or solo travelers.
- Together, 2 bedrooms and 3 bedrooms properties represent 66.4% of the active Airbnb listings in Dana Point, indicating a high concentration in these sizes.
- A significant 33.0% of listings offer 3+ bedrooms, catering to larger groups and families seeking more space in Dana Point.
Dana Point Vacation Rental Guest Capacity Trends (2026)
Distribution of Listings by Guest Capacity
Guest Capacity Insights for Dana Point
- The most common guest capacity trend in Dana Point vacation rentals is listings accommodating 6 guests (28.5%). This suggests the primary traveler segment is likely larger groups.
- Properties designed for 6 guests and 4 guests dominate the Dana Point STR market, accounting for 53.8% of listings.
- 50.7% of properties accommodate 6+ guests, serving the market segment for larger families or group travel in Dana Point.
- On average, properties in Dana Point are equipped to host 5.1 guests.
Dana Point Airbnb Booking Patterns (2026): Available vs. Booked Days
Available Days Distribution
Booked Days Distribution
Booking Pattern Insights for Dana Point
- The most common availability pattern in Dana Point falls within the 271-366 days range, representing 43.1% of listings. This suggests many properties have significant open periods on their calendars.
- Approximately 72.6% of listings show high availability (181+ days open annually), indicating potential for increased bookings or specific owner usage patterns.
- For booked days, the 91-180 days range is most frequent in Dana Point (30.9%), reflecting common guest stay durations or potential owner blocking patterns.
- A notable 27.4% of properties secure long booking periods (181+ days booked per year), highlighting successful long-term rental strategies or significant owner usage.
Dana Point Airbnb Minimum Stay Requirements Analysis
Distribution of Listings by Minimum Night Requirement
1 Night
6 listings
2.1% of total
2 Nights
35 listings
12.2% of total
3 Nights
11 listings
3.8% of total
4-6 Nights
28 listings
9.7% of total
7-29 Nights
62 listings
21.5% of total
30+ Nights
146 listings
50.7% of total
Key Insights
- The most prevalent minimum stay requirement in Dana Point is 30+ Nights, adopted by 50.7% of listings. This highlights the market's preference for longer commitments.
- Very short stays (1-2 nights) are less common (14.3%), suggesting hosts prefer slightly longer bookings to optimize turnover.
- A significant segment (50.7%) caters to monthly stays (30+ nights) in Dana Point, pointing to opportunities in the extended-stay market.
Recommendations
- Align with the market by considering a 30+ Nights minimum stay, as 50.7% of Dana Point hosts use this setting.
- If feasible, allowing 1-night stays, especially midweek or during low season, could capture last-minute bookings, as only 2.1% currently do.
- Explore offering discounts for stays of 30+ nights to attract the 50.7% of the market seeking extended stays.
- Adjust minimum nights based on seasonality – potentially shorter during low season and longer during peak demand periods in Dana Point.
Dana Point Airbnb Cancellation Policy Trends Analysis (2026)
Limited
5 listings
1.7% of total
Super Strict 60 Days
9 listings
3.1% of total
Super Strict 30 Days
1 listings
0.3% of total
Flexible
31 listings
10.8% of total
Moderate
38 listings
13.2% of total
Firm
133 listings
46.3% of total
Strict
70 listings
24.4% of total
Cancellation Policy Insights for Dana Point
- The prevailing Airbnb cancellation policy trend in Dana Point is Firm, used by 46.3% of listings.
- A majority (70.7%) of hosts in Dana Point utilize Firm or Strict policies, indicating a market where hosts prioritize booking security.
Recommendations for Hosts
- Consider adopting a Firm policy to align with the 46.3% market standard in Dana Point.
- Regularly review your cancellation policy against competitors and market demand shifts in Dana Point.
Dana Point STR Booking Lead Time Analysis (2026)
Average Booking Lead Time by Month
Booking Lead Time Insights for Dana Point
- The overall average booking lead time for vacation rentals in Dana Point is 58 days.
- Guests book furthest in advance for stays during July (average 91 days), likely coinciding with peak travel demand or local events.
- The shortest booking windows occur for stays in April (average 47 days), indicating more last-minute travel plans during this time.
- Seasonally, Summer (74 days avg.) sees the longest lead times, while Spring (48 days avg.) has the shortest, reflecting typical travel planning cycles.
Recommendations for Hosts
- Use the overall average lead time (58 days) as a baseline for your pricing and availability strategy in Dana Point.
- For July stays, consider implementing length-of-stay discounts or slightly higher rates for bookings made less than 91 days out to capitalize on advance planning.
- Target marketing efforts for the Summer season well in advance (at least 74 days) to capture early planners.
- Monitor your own booking lead times against these Dana Point averages to identify opportunities for dynamic pricing adjustments.
Popular & Essential Airbnb Amenities in Dana Point (2026)
Amenity Prevalence
Amenity Insights for Dana Point
- Essential amenities in Dana Point that guests expect include: Wifi, Smoke alarm, TV, Kitchen, Carbon monoxide alarm. Lacking these (any) could significantly impact bookings.
- Popular amenities like Heating, Free parking on premises, Washer are common but not universal. Offering these can provide a competitive edge.
Recommendations for Hosts
- Ensure your listing includes all essential amenities for Dana Point: Wifi, Smoke alarm, TV, Kitchen, Carbon monoxide alarm.
- Prioritize adding missing essentials: Smoke alarm, TV, Kitchen, Carbon monoxide alarm.
- Consider adding popular differentiators like Heating or Free parking on premises to increase appeal.
- Highlight unique or less common amenities you offer (e.g., hot tub, dedicated workspace, EV charger) in your listing description and photos.
- Regularly check competitor amenities in Dana Point to stay competitive.
Dana Point Airbnb Guest Demographics & Profile Analysis (2026)
Guest Profile Summary for Dana Point
- The typical guest profile for Airbnb in Dana Point consists of primarily domestic travelers (93%), often arriving from nearby Los Angeles, typically belonging to the Post-2000s (Gen Z/Alpha) group (50%), primarily speaking English or Spanish.
- Domestic travelers account for 93.1% of guests.
- Key international markets include United States (93.1%) and United Kingdom (1.5%).
- Top languages spoken are English (69.3%) followed by Spanish (12.8%).
- A significant demographic segment is the Post-2000s (Gen Z/Alpha) group, representing 50% of guests.
Recommendations for Hosts
- Target domestic marketing efforts towards travelers from Los Angeles and San Diego.
- Tailor amenities and listing descriptions to appeal to the dominant Post-2000s (Gen Z/Alpha) demographic (e.g., highlight fast WiFi, smart home features, local guides).
- Highlight unique local experiences or amenities relevant to the primary guest profile.
- Consider seasonal promotions aligned with peak travel times for key origin markets.
Nearby Short-Term Rental Market Comparison
How does the Dana Point Airbnb market stack up against its neighbors? Compare key performance metrics like average monthly revenue, ADR, and occupancy rates in surrounding areas to understand the broader regional STR landscape.
| Market | Active Properties | Monthly Revenue | Daily Rate | Avg. Occupancy |
|---|---|---|---|---|
| Newport Beach | 1,273 | $8,950 | $744.06 | 47% |
| Rancho San Diego | 25 | $8,649 | $568.72 | 48% |
| Malibu | 251 | $8,293 | $1263.89 | 35% |
| Thousand Palms | 33 | $8,119 | $725.48 | 36% |
| Manhattan Beach | 267 | $7,875 | $585.30 | 53% |
| Lakeside | 33 | $7,537 | $604.33 | 44% |
| GlenOak Hills | 41 | $7,394 | $648.65 | 41% |
| Bermuda Dunes | 143 | $7,324 | $664.90 | 39% |
| Mount Helix | 33 | $7,163 | $594.94 | 50% |
| Del Mar | 128 | $7,011 | $671.56 | 45% |