Daly City Airbnb Market Analysis 2026: Short Term Rental Data & Vacation Rental Statistics in California, United States
Is Airbnb profitable in Daly City in 2026? Explore comprehensive Airbnb analytics for Daly City, California, United States to uncover income potential. This 2026 STR market report for Daly City, based on AirROI data from February 2025 to January 2026, reveals key trends in the market of 331 active listings.
Whether you're considering an Airbnb investment in Daly City, optimizing your existing vacation rental, or exploring rental arbitrage opportunities, understanding the Daly City Airbnb data is crucial. Leveraging the low regulation environment is key to maximizing your short term rental income potential. Let's dive into the specifics.
Key Daly City Airbnb Performance Metrics Overview
Monthly Airbnb Revenue Variations & Income Potential in Daly City (2026)
Understanding the monthly revenue variations for Airbnb listings in Daly City is key to maximizing your short term rental income potential. Seasonality significantly impacts earnings. Our analysis, based on data from the past 12 months, shows that the peak revenue month for STRs in Daly City is typically June, while February often presents the lowest earnings, highlighting opportunities for strategic pricing adjustments during shoulder and low seasons. Explore the typical Airbnb income in Daly City across different performance tiers:
- Best-in-class properties (Top 10%) achieve $9,506+ monthly, often utilizing dynamic pricing and superior guest experiences.
- Strong performing properties (Top 25%) earn $6,060 or more, indicating effective management and desirable locations/amenities.
- Typical properties (Median) generate around $3,259 per month, representing the average market performance.
- Entry-level properties (Bottom 25%) see earnings around $1,439, often with potential for optimization.
Average Monthly Airbnb Earnings Trend in Daly City
Daly City Airbnb Occupancy Rate Trends (2026)
Maximize your bookings by understanding the Daly City STR occupancy trends. Seasonal demand shifts significantly influence how often properties are booked. Typically, Junesees the highest demand (peak season occupancy), while January experiences the lowest (low season). Effective strategies, like adjusting minimum stays or offering promotions, can boost occupancy during slower periods. Here's how different property tiers perform in Daly City:
- Best-in-class properties (Top 10%) achieve 88%+ occupancy, indicating high desirability and potentially optimized availability.
- Strong performing properties (Top 25%) maintain 78% or higher occupancy, suggesting good market fit and guest satisfaction.
- Typical properties (Median) have an occupancy rate around 59%.
- Entry-level properties (Bottom 25%) average 33% occupancy, potentially facing higher vacancy.
Average Monthly Occupancy Rate Trend in Daly City
Average Daily Rate (ADR) Airbnb Trends in Daly City (2026)
Effective short term rental pricing strategy in Daly City involves understanding monthly ADR fluctuations. The Average Daily Rate (ADR) for Airbnb in Daly City typically peaks in October and dips lowest during February. Leveraging Airbnb dynamic pricing tools or strategies based on this seasonality can significantly boost revenue. Here's a look at the typical nightly rates achieved:
- Best-in-class properties (Top 10%) command rates of $426+ per night, often due to premium features or locations.
- Strong performing properties (Top 25%) achieve nightly rates of $287 or more.
- Typical properties (Median) charge around $154 per night.
- Entry-level properties (Bottom 25%) earn around $84 per night.
Average Daily Rate (ADR) Trend by Month in Daly City
Get Live Daly City Market Intelligence 👇

Explore Real-time Analytics
Airbnb Seasonality Analysis & Trends in Daly City (2026)
Peak Season (June, July, October)
- Revenue averages $4,879 per month
- Occupancy rates average 59.6%
- Daily rates average $217
Shoulder Season
- Revenue averages $4,431 per month
- Occupancy maintains around 55.7%
- Daily rates hold near $209
Low Season (January, February, September)
- Revenue drops to average $3,613 per month
- Occupancy decreases to average 50.2%
- Daily rates adjust to average $201
Seasonality Insights for Daly City
- The Airbnb seasonality in Daly City shows moderate seasonality with distinct peak and low periods. While the sections above show seasonal averages, it's also insightful to look at the extremes:
- During the high season, the absolute peak month showcases Daly City's highest earning potential, with monthly revenues capable of climbing to $4,995, occupancy reaching a high of 60.3%, and ADRs peaking at $225.
- Conversely, the slowest single month of the year, typically falling within the low season, marks the market's lowest point. In this month, revenue might dip to $2,991, occupancy could drop to 46.0%, and ADRs may adjust down to $174.
- Understanding both the seasonal averages and these monthly peaks and troughs in revenue, occupancy, and ADR is crucial for maximizing your Airbnb profit potential in Daly City.
Seasonal Strategies for Maximizing Profit
- Peak Season: Maximize revenue through premium pricing and potentially longer minimum stays. Ensure high availability.
- Low Season: Offer competitive pricing, special promotions (e.g., extended stay discounts), and flexible cancellation policies. Target off-season travelers like remote workers or budget-conscious guests.
- Shoulder Seasons: Implement dynamic pricing that balances peak and low rates. Target weekend travelers or specific events. Offer slightly more flexible terms than peak season.
- Regularly analyze your own performance against these Daly City seasonality benchmarks and adjust your pricing and availability strategy accordingly.
Best Areas for Airbnb Investment in Daly City (2026)
Exploring the top neighborhoods for short-term rentals in Daly City? This section highlights key areas, outlining why they are attractive for hosts and guests, along with notable local attractions. Consider these locations based on your target guest profile and investment strategy.
| Neighborhood / Area | Why Host Here? (Target Guests & Appeal) | Key Attractions & Landmarks |
|---|---|---|
| Westlake | A family-friendly neighborhood with access to parks and good schools, Westlake is appealing to both residents and visitors, making it a great spot for Airbnb hosting. | Westlake Shopping Center, Sign Hill Park, Daly City Peninsula, Daly City Dunes, Cow Palace |
| Parkview | A quiet residential area with beautiful parks, Parkview is ideal for guests looking for a relaxing environment close to nature and outdoor activities. | Mussel Rock Park, Pacifica State Beach, Rockaway Beach, Coyote Point Recreation Area, Serra Park |
| Sharp Park | This coastal area offers stunning ocean views and beach access, making it ideal for beach lovers and tourists seeking a seaside getaway. | Sharp Park Beach, Pacifica Pier, Pacifica State Beach, Ocean Beach, Mussel Rock |
| Daly City Center | The downtown area of Daly City provides easy access to public transport, dining, and shopping, appealing to urban travelers looking for convenience. | Daly City BART Station, Westlake Center, The Shops at Tanforan, Social Hall SF, Golden Gate Park |
| Brisbane | Though slightly outside Daly City, Brisbane is a quaint and charming town known for its views and access to nature, popular with tourists seeking a quieter experience. | Brisbane Lagoon, San Bruno Mountain State Park, Coyote Point, Mission Blue Butterfly Habitat, Brisbane Marina |
| Visitation Valley | A growing area with diverse attractions, Visitation Valley is becoming increasingly popular due to its convenient access to San Francisco and cultural diversity. | Visitacion Valley Greenway, Bayview Park, Candlestick Point State Recreation Area, Sanchez Park, Hilltop Park |
| Crocker | This area is known for its historical architecture and close-knit community feel, attracting visitors interested in culture and local history. | Crocker Park, Crocker Amazon Playground, Bayview-Hunters Point, Nearby museums, Local eateries |
| South San Francisco | Just south of Daly City, this area has a vibrant downtown and is close to major attractions and San Francisco, making it great for Airbnb hosts targeting tourists. | South San Francisco Conference Center, Sign Hill, Golden Gate National Cemetery, Downtown South San Francisco, Local breweries and wineries |
Understanding Airbnb License Requirements & STR Laws in Daly City (2026)
While Daly City, California, United States currently shows low STR regulations, specific Airbnb license requirements might still exist or change. Always verify the latest short term rental regulations and Airbnb license requirements directly with local government authorities for Daly City to ensure full compliance before hosting.
(Source: AirROI data, 2026, based on 0% licensed listings)
Top Performing Airbnb Properties in Daly City (2026)
Benchmark your potential! Explore examples of top-performing Airbnb properties in Daly Citybased on Trailing Twelve Month (TTM) revenue. Analyze their characteristics, revenue, occupancy rate, and ADR to understand what drives success in this market.

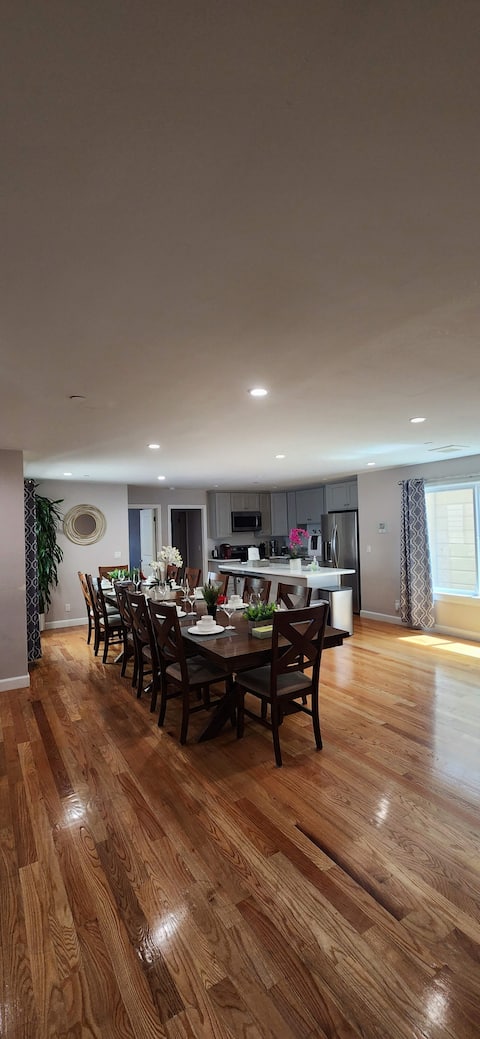
SF Luxury living! 8bed/5bath 1 block from subway!
Entire Place • 8 bedrooms

8bd/8ba Unique Spacious Clean Home
Entire Place • 8 bedrooms
8-BR, 8-Bath Home: Your Perfect Staycation near SF
Entire Place • 8 bedrooms
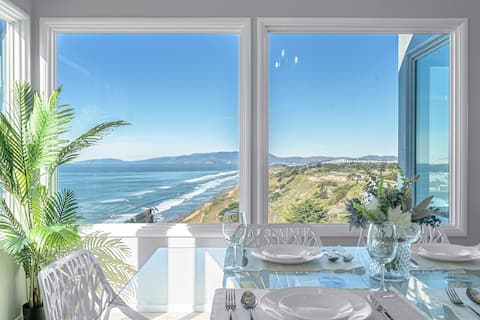
Oceanview Luxury • Hot Tub & Game Room • Near SF
Entire Place • 4 bedrooms
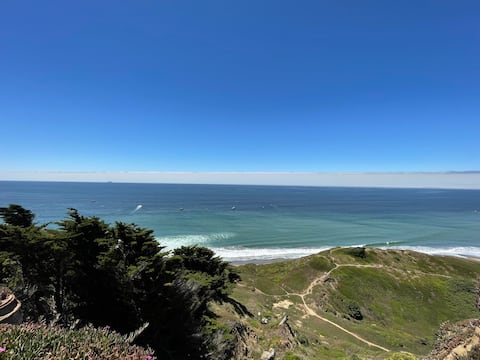
Gem by the sea none-obstructive ocean view
Entire Place • 4 bedrooms

Luxurious house close to SF next to SF Golf Club
Entire Place • 5 bedrooms
Note: Performance varies based on location, size, amenities, seasonality, and management quality. Data reflects the past 12 months.
Top Performing Airbnb Hosts in Daly City (2026)
Learn from the best! This table showcases top-performing Airbnb hosts in Daly City based on the number of properties managed and estimated total revenue over the past year. Analyze their scale and performance metrics.
| Host Name | Properties | Grossing Revenue | Stay Reviews | Avg Rating |
|---|---|---|---|---|
| Victor 5 | 13 | $614,781 | 1221 | 4.75/5.0 |
| Daniel | 1 | $297,093 | 307 | 4.87/5.0 |
| Raymond | 4 | $283,044 | 296 | 4.62/5.0 |
| Kara | 4 | $282,909 | 69 | 4.77/5.0 |
| Goldvale Vacation Rentals | 2 | $248,250 | 101 | 4.88/5.0 |
| Chris | 3 | $222,365 | 281 | 4.92/5.0 |
| Andrew | 2 | $201,658 | 460 | 4.75/5.0 |
| Taylor | 2 | $192,196 | 158 | 4.98/5.0 |
| James | 3 | $188,416 | 223 | 4.87/5.0 |
| Tony | 1 | $183,822 | 213 | 4.96/5.0 |
Analyzing the strategies of top hosts, such as their property selection, pricing, and guest communication, can offer valuable lessons for optimizing your own Airbnb operations in Daly City.
Dive Deeper: Advanced Daly City STR Market Data (2026)
Ready to unlock more insights? AirROI provides access to advanced metrics and comprehensive Airbnb data for Daly City. Explore detailed analytics beyond this report to refine your investment strategy, optimize pricing, and maximize your vacation rental profits.
Explore Advanced MetricsDaly City Short-Term Rental Market Composition (2026): Property & Room Types
Room Type Distribution
Property Type Distribution
Market Composition Insights for Daly City
- The Daly City Airbnb market composition is heavily skewed towards Entire Home/Apt listings, which make up 64.7% of the 331 active rentals. This indicates strong guest preference for privacy and space.
- However, a notable 30.2% share for Private Rooms suggests opportunities for budget-conscious travelers or hosts renting out spare rooms.
- Looking at the property type distribution in Daly City, House properties are the most common (73.7%), reflecting the local real estate landscape.
- Houses represent a significant 73.7% portion, catering likely to families or larger groups.
- Smaller segments like hotel/boutique (combined 2.4%) offer potential for unique stay experiences.
Daly City Airbnb Room Capacity Analysis (2026): Bedroom Distribution
Distribution of Listings by Number of Bedrooms
Room Capacity Insights for Daly City
- The dominant room capacity in Daly City is 2 bedrooms listings, making up 20.8% of the market. This suggests a strong demand for properties suitable for couples or solo travelers.
- Together, 2 bedrooms and 1 bedroom properties represent 38.6% of the active Airbnb listings in Daly City, indicating a high concentration in these sizes.
- A significant 31.4% of listings offer 3+ bedrooms, catering to larger groups and families seeking more space in Daly City.
Daly City Vacation Rental Guest Capacity Trends (2026)
Distribution of Listings by Guest Capacity
Guest Capacity Insights for Daly City
- The most common guest capacity trend in Daly City vacation rentals is listings accommodating 8+ guests (21.8%). This suggests the primary traveler segment is likely larger groups.
- Properties designed for 8+ guests and 6 guests dominate the Daly City STR market, accounting for 36.6% of listings.
- 39.9% of properties accommodate 6+ guests, serving the market segment for larger families or group travel in Daly City.
- On average, properties in Daly City are equipped to host 3.8 guests.
Daly City Airbnb Booking Patterns (2026): Available vs. Booked Days
Available Days Distribution
Booked Days Distribution
Booking Pattern Insights for Daly City
- The most common availability pattern in Daly City falls within the 271-366 days range, representing 35.6% of listings. This suggests many properties have significant open periods on their calendars.
- Approximately 62.5% of listings show high availability (181+ days open annually), indicating potential for increased bookings or specific owner usage patterns.
- For booked days, the 91-180 days range is most frequent in Daly City (27.8%), reflecting common guest stay durations or potential owner blocking patterns.
- A notable 38.1% of properties secure long booking periods (181+ days booked per year), highlighting successful long-term rental strategies or significant owner usage.
Daly City Airbnb Minimum Stay Requirements Analysis
Distribution of Listings by Minimum Night Requirement
1 Night
86 listings
26% of total
2 Nights
89 listings
26.9% of total
3 Nights
20 listings
6% of total
4-6 Nights
9 listings
2.7% of total
7-29 Nights
21 listings
6.3% of total
30+ Nights
106 listings
32% of total
Key Insights
- The most prevalent minimum stay requirement in Daly City is 30+ Nights, adopted by 32% of listings. This highlights the market's preference for longer commitments.
- A significant segment (32%) caters to monthly stays (30+ nights) in Daly City, pointing to opportunities in the extended-stay market.
Recommendations
- Align with the market by considering a 30+ Nights minimum stay, as 32% of Daly City hosts use this setting.
- If feasible, allowing 1-night stays, especially midweek or during low season, could capture last-minute bookings, as only 26% currently do.
- Explore offering discounts for stays of 30+ nights to attract the 32% of the market seeking extended stays.
- Adjust minimum nights based on seasonality – potentially shorter during low season and longer during peak demand periods in Daly City.
Daly City Airbnb Cancellation Policy Trends Analysis (2026)
Limited
3 listings
0.9% of total
Flexible
74 listings
22.6% of total
Moderate
94 listings
28.7% of total
Firm
75 listings
22.9% of total
Strict
81 listings
24.8% of total
Cancellation Policy Insights for Daly City
- The prevailing Airbnb cancellation policy trend in Daly City is Moderate, used by 28.7% of listings.
- There's a relatively balanced mix between guest-friendly (51.3%) and stricter (47.7%) policies, offering choices for different guest needs.
Recommendations for Hosts
- Consider adopting a Moderate policy to align with the 28.7% market standard in Daly City.
- Regularly review your cancellation policy against competitors and market demand shifts in Daly City.
Daly City STR Booking Lead Time Analysis (2026)
Average Booking Lead Time by Month
Booking Lead Time Insights for Daly City
- The overall average booking lead time for vacation rentals in Daly City is 35 days.
- Guests book furthest in advance for stays during August (average 50 days), likely coinciding with peak travel demand or local events.
- The shortest booking windows occur for stays in March (average 24 days), indicating more last-minute travel plans during this time.
- Seasonally, Summer (45 days avg.) sees the longest lead times, while Winter (30 days avg.) has the shortest, reflecting typical travel planning cycles.
Recommendations for Hosts
- Use the overall average lead time (35 days) as a baseline for your pricing and availability strategy in Daly City.
- For August stays, consider implementing length-of-stay discounts or slightly higher rates for bookings made less than 50 days out to capitalize on advance planning.
- Target marketing efforts for the Summer season well in advance (at least 45 days) to capture early planners.
- Monitor your own booking lead times against these Daly City averages to identify opportunities for dynamic pricing adjustments.
Popular & Essential Airbnb Amenities in Daly City (2026)
Amenity Prevalence
Amenity Insights for Daly City
- Essential amenities in Daly City that guests expect include: Wifi, Smoke alarm. Lacking these (any) could significantly impact bookings.
- Popular amenities like Carbon monoxide alarm, Heating, Hangers are common but not universal. Offering these can provide a competitive edge.
Recommendations for Hosts
- Ensure your listing includes all essential amenities for Daly City: Wifi, Smoke alarm.
- Prioritize adding missing essentials: Wifi, Smoke alarm.
- Consider adding popular differentiators like Carbon monoxide alarm or Heating to increase appeal.
- Highlight unique or less common amenities you offer (e.g., hot tub, dedicated workspace, EV charger) in your listing description and photos.
- Regularly check competitor amenities in Daly City to stay competitive.
Daly City Airbnb Guest Demographics & Profile Analysis (2026)
Guest Profile Summary for Daly City
- The typical guest profile for Airbnb in Daly City consists of primarily domestic travelers (77%), often arriving from nearby Los Angeles, typically belonging to the Post-2000s (Gen Z/Alpha) group (50%), primarily speaking English or Spanish.
- Domestic travelers account for 77.1% of guests.
- Key international markets include United States (77.1%) and Canada (3.2%).
- Top languages spoken are English (56.7%) followed by Spanish (13.7%).
- A significant demographic segment is the Post-2000s (Gen Z/Alpha) group, representing 50% of guests.
Recommendations for Hosts
- Target domestic marketing efforts towards travelers from Los Angeles and San Francisco.
- Tailor amenities and listing descriptions to appeal to the dominant Post-2000s (Gen Z/Alpha) demographic (e.g., highlight fast WiFi, smart home features, local guides).
- Highlight unique local experiences or amenities relevant to the primary guest profile.
- Consider seasonal promotions aligned with peak travel times for key origin markets.
Nearby Short-Term Rental Market Comparison
How does the Daly City Airbnb market stack up against its neighbors? Compare key performance metrics like average monthly revenue, ADR, and occupancy rates in surrounding areas to understand the broader regional STR landscape.
| Market | Active Properties | Monthly Revenue | Daily Rate | Avg. Occupancy |
|---|---|---|---|---|
| Carmel Point | 15 | $14,483 | $1046.17 | 54% |
| Del Monte Forest | 105 | $10,280 | $964.89 | 47% |
| Moss Beach | 34 | $10,092 | $676.91 | 53% |
| Sonoma | 228 | $9,647 | $819.87 | 43% |
| Marshall | 18 | $8,897 | $607.75 | 50% |
| St. Helena | 50 | $8,684 | $924.70 | 38% |
| Carmel-by-the-Sea | 305 | $8,657 | $680.02 | 49% |
| Kenwood | 60 | $8,643 | $810.83 | 41% |
| Glen Ellen | 85 | $8,482 | $799.53 | 43% |
| Eldridge | 21 | $8,410 | $930.61 | 41% |