Culver City Airbnb Market Analysis 2026: Short Term Rental Data & Vacation Rental Statistics in California, United States
Is Airbnb profitable in Culver City in 2026? Explore comprehensive Airbnb analytics for Culver City, California, United States to uncover income potential. This 2026 STR market report for Culver City, based on AirROI data from February 2025 to January 2026, reveals key trends in the market of 436 active listings.
Whether you're considering an Airbnb investment in Culver City, optimizing your existing vacation rental, or exploring rental arbitrage opportunities, understanding the Culver City Airbnb data is crucial. Leveraging the low regulation environment is key to maximizing your short term rental income potential. Let's dive into the specifics.
Key Culver City Airbnb Performance Metrics Overview
Monthly Airbnb Revenue Variations & Income Potential in Culver City (2026)
Understanding the monthly revenue variations for Airbnb listings in Culver City is key to maximizing your short term rental income potential. Seasonality significantly impacts earnings. Our analysis, based on data from the past 12 months, shows that the peak revenue month for STRs in Culver City is typically June, while January often presents the lowest earnings, highlighting opportunities for strategic pricing adjustments during shoulder and low seasons. Explore the typical Airbnb income in Culver City across different performance tiers:
- Best-in-class properties (Top 10%) achieve $8,611+ monthly, often utilizing dynamic pricing and superior guest experiences.
- Strong performing properties (Top 25%) earn $6,085 or more, indicating effective management and desirable locations/amenities.
- Typical properties (Median) generate around $4,065 per month, representing the average market performance.
- Entry-level properties (Bottom 25%) see earnings around $2,221, often with potential for optimization.
Average Monthly Airbnb Earnings Trend in Culver City
Culver City Airbnb Occupancy Rate Trends (2026)
Maximize your bookings by understanding the Culver City STR occupancy trends. Seasonal demand shifts significantly influence how often properties are booked. Typically, Marchsees the highest demand (peak season occupancy), while January experiences the lowest (low season). Effective strategies, like adjusting minimum stays or offering promotions, can boost occupancy during slower periods. Here's how different property tiers perform in Culver City:
- Best-in-class properties (Top 10%) achieve 89%+ occupancy, indicating high desirability and potentially optimized availability.
- Strong performing properties (Top 25%) maintain 79% or higher occupancy, suggesting good market fit and guest satisfaction.
- Typical properties (Median) have an occupancy rate around 62%.
- Entry-level properties (Bottom 25%) average 37% occupancy, potentially facing higher vacancy.
Average Monthly Occupancy Rate Trend in Culver City
Average Daily Rate (ADR) Airbnb Trends in Culver City (2026)
Effective short term rental pricing strategy in Culver City involves understanding monthly ADR fluctuations. The Average Daily Rate (ADR) for Airbnb in Culver City typically peaks in June and dips lowest during February. Leveraging Airbnb dynamic pricing tools or strategies based on this seasonality can significantly boost revenue. Here's a look at the typical nightly rates achieved:
- Best-in-class properties (Top 10%) command rates of $450+ per night, often due to premium features or locations.
- Strong performing properties (Top 25%) achieve nightly rates of $324 or more.
- Typical properties (Median) charge around $226 per night.
- Entry-level properties (Bottom 25%) earn around $155 per night.
Average Daily Rate (ADR) Trend by Month in Culver City
Get Live Culver City Market Intelligence 👇

Explore Real-time Analytics
Airbnb Seasonality Analysis & Trends in Culver City (2026)
Peak Season (June, July, March)
- Revenue averages $5,188 per month
- Occupancy rates average 61.3%
- Daily rates average $273
Shoulder Season
- Revenue averages $4,741 per month
- Occupancy maintains around 57.4%
- Daily rates hold near $267
Low Season (January, February, September)
- Revenue drops to average $3,984 per month
- Occupancy decreases to average 54.0%
- Daily rates adjust to average $251
Seasonality Insights for Culver City
- The Airbnb seasonality in Culver City shows moderate seasonality with distinct peak and low periods. While the sections above show seasonal averages, it's also insightful to look at the extremes:
- During the high season, the absolute peak month showcases Culver City's highest earning potential, with monthly revenues capable of climbing to $5,255, occupancy reaching a high of 62.7%, and ADRs peaking at $280.
- Conversely, the slowest single month of the year, typically falling within the low season, marks the market's lowest point. In this month, revenue might dip to $3,425, occupancy could drop to 45.2%, and ADRs may adjust down to $242.
- Understanding both the seasonal averages and these monthly peaks and troughs in revenue, occupancy, and ADR is crucial for maximizing your Airbnb profit potential in Culver City.
Seasonal Strategies for Maximizing Profit
- Peak Season: Maximize revenue through premium pricing and potentially longer minimum stays. Ensure high availability.
- Low Season: Offer competitive pricing, special promotions (e.g., extended stay discounts), and flexible cancellation policies. Target off-season travelers like remote workers or budget-conscious guests.
- Shoulder Seasons: Implement dynamic pricing that balances peak and low rates. Target weekend travelers or specific events. Offer slightly more flexible terms than peak season.
- Regularly analyze your own performance against these Culver City seasonality benchmarks and adjust your pricing and availability strategy accordingly.
Best Areas for Airbnb Investment in Culver City (2026)
Exploring the top neighborhoods for short-term rentals in Culver City? This section highlights key areas, outlining why they are attractive for hosts and guests, along with notable local attractions. Consider these locations based on your target guest profile and investment strategy.
| Neighborhood / Area | Why Host Here? (Target Guests & Appeal) | Key Attractions & Landmarks |
|---|---|---|
| Downtown Culver City | A vibrant area known for its eclectic mix of restaurants, shops, and art galleries. It is the cultural heart of the city with theaters and venues attracting visitors. | Culver City Downtown, Culver City Arts District, Veterans Park, The Kirk Douglas Theatre, Culver City Station |
| Culver West | A charming and quieter residential neighborhood close to the West LA and the beach. Ideal for families and visitors seeking a suburban experience but with access to urban amenities. | Culver Park, Culver City Stairs, Culver Boulevard, Culver City Farmers Market, Reverie Cafe |
| Fox Hills | A growing neighborhood that features a mix of residential, commercial, and retail developments. Close to major businesses and shopping centers, appealing to business travelers and tourists. | Fox Hills Park, Westfield Culver City, SoFi Stadium, Culver City Plunge, Airborne Trampoline Park |
| Culver City Arts District | Known for its vibrant art scene and creative spaces. Attracts artists and art lovers, making it a unique spot for Airbnb hosting. | Culver City Art Walk, art galleries, independent theaters, local artist studios, Culver City Historic Society |
| Southeast Culver City | A diverse area that features a mix of residential and commercial spaces. Close to major transport links and the Culver City Expo Line. | Culver City Expo Line, Culver Point, Culver City Middle School, Culver City Unified School District, Downtown Culver City |
| Culver City Heights | A scenic residential area with views and parks. Perfect for people looking to escape the hustle and bustle yet stay close to everything. | Baldwin Hills Scenic Overlook, Doris Place Park, Reverie Cafe, Culver City Stairs, Hughes Market |
| Culver City Park Hills | A peaceful neighborhood with great access to parks and recreational areas. Ideal for family-oriented visitors or those seeking a tranquil stay. | Culver City Park, Playa Vista Park, Crown Park, Culver City Skate Park, Kirk Douglas Theater |
| Culver Village | A community-driven neighborhood featuring local shops and eateries. Attracts visitors looking for a local experience and a taste of Culver City's lifestyle. | Culver Village Center, local boutiques, coffee shops, Culver City Farmers Market, Culver Park |
Understanding Airbnb License Requirements & STR Laws in Culver City (2026)
While Culver City, California, United States currently shows low STR regulations, specific Airbnb license requirements might still exist or change. Always verify the latest short term rental regulations and Airbnb license requirements directly with local government authorities for Culver City to ensure full compliance before hosting.
(Source: AirROI data, 2026, based on 1% licensed listings)
Top Performing Airbnb Properties in Culver City (2026)
Benchmark your potential! Explore examples of top-performing Airbnb properties in Culver Citybased on Trailing Twelve Month (TTM) revenue. Analyze their characteristics, revenue, occupancy rate, and ADR to understand what drives success in this market.
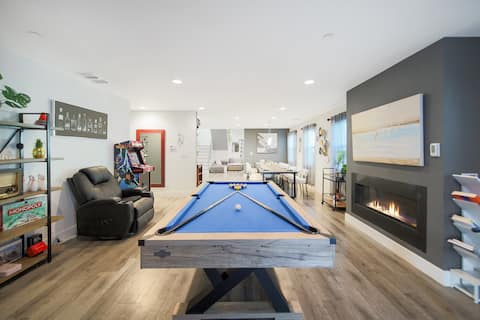
Quiet Family Comfort in Culver City: Safe LA Stay
Entire Place • 5 bedrooms

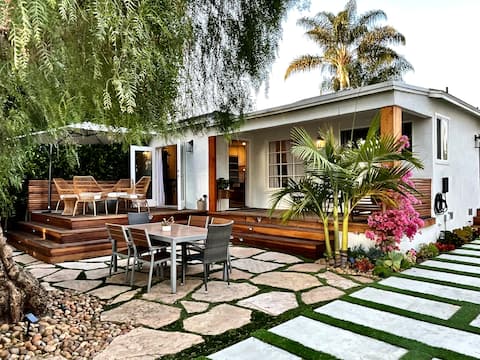
Private house & Gardens - blocks to Amazon + Apple
Entire Place • 3 bedrooms

9BR Group Stay Mid City near USC
Entire Place • 9 bedrooms

5 mins to CulverCity SantaMonica
Entire Place • 3 bedrooms
Magnolia House in Venice
Entire Place • 3 bedrooms
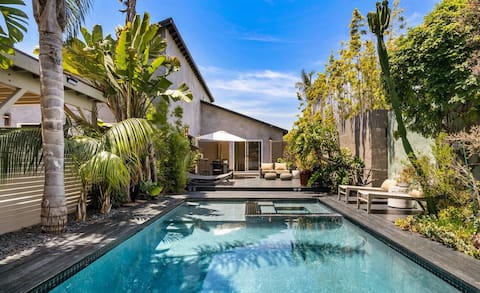
Pool House Oasis Close to Venice & Marina
Entire Place • 3 bedrooms
Note: Performance varies based on location, size, amenities, seasonality, and management quality. Data reflects the past 12 months.
Top Performing Airbnb Hosts in Culver City (2026)
Learn from the best! This table showcases top-performing Airbnb hosts in Culver City based on the number of properties managed and estimated total revenue over the past year. Analyze their scale and performance metrics.
| Host Name | Properties | Grossing Revenue | Stay Reviews | Avg Rating |
|---|---|---|---|---|
| Gerardo | 14 | $1,340,426 | 772 | 4.76/5.0 |
| Fawaz | 16 | $831,965 | 778 | 4.96/5.0 |
| Nadia | 9 | $574,639 | 300 | 4.91/5.0 |
| Alex | 4 | $377,436 | 623 | 4.86/5.0 |
| Mary | 11 | $365,938 | 464 | 4.89/5.0 |
| Courtney | 4 | $303,790 | 334 | 4.96/5.0 |
| David | 10 | $299,067 | 1047 | 4.57/5.0 |
| Michael | 5 | $292,352 | 661 | 4.83/5.0 |
| Maurice | 1 | $275,481 | 49 | 4.90/5.0 |
| Rochelle | 4 | $259,817 | 73 | 4.91/5.0 |
Analyzing the strategies of top hosts, such as their property selection, pricing, and guest communication, can offer valuable lessons for optimizing your own Airbnb operations in Culver City.
Dive Deeper: Advanced Culver City STR Market Data (2026)
Ready to unlock more insights? AirROI provides access to advanced metrics and comprehensive Airbnb data for Culver City. Explore detailed analytics beyond this report to refine your investment strategy, optimize pricing, and maximize your vacation rental profits.
Explore Advanced MetricsCulver City Short-Term Rental Market Composition (2026): Property & Room Types
Room Type Distribution
Property Type Distribution
Market Composition Insights for Culver City
- The Culver City Airbnb market composition is heavily skewed towards Entire Home/Apt listings, which make up 82.3% of the 436 active rentals. This indicates strong guest preference for privacy and space.
- Looking at the property type distribution in Culver City, House properties are the most common (44.3%), reflecting the local real estate landscape.
- Houses represent a significant 44.3% portion, catering likely to families or larger groups.
- The presence of 15.1% Hotel/Boutique listings indicates integration with traditional hospitality.
- Smaller segments like others, outdoor/unique (combined 3.5%) offer potential for unique stay experiences.
Culver City Airbnb Room Capacity Analysis (2026): Bedroom Distribution
Distribution of Listings by Number of Bedrooms
Room Capacity Insights for Culver City
- The dominant room capacity in Culver City is 1 bedroom listings, making up 36.2% of the market. This suggests a strong demand for properties suitable for couples or solo travelers.
- Together, 1 bedroom and 2 bedrooms properties represent 61.4% of the active Airbnb listings in Culver City, indicating a high concentration in these sizes.
Culver City Vacation Rental Guest Capacity Trends (2026)
Distribution of Listings by Guest Capacity
Guest Capacity Insights for Culver City
- The most common guest capacity trend in Culver City vacation rentals is listings accommodating 2 guests (27.1%). This suggests the primary traveler segment is likely couples or solo travelers.
- Properties designed for 2 guests and 4 guests dominate the Culver City STR market, accounting for 46.6% of listings.
- 22.7% of properties accommodate 6+ guests, serving the market segment for larger families or group travel in Culver City.
- On average, properties in Culver City are equipped to host 3.6 guests.
Culver City Airbnb Booking Patterns (2026): Available vs. Booked Days
Available Days Distribution
Booked Days Distribution
Booking Pattern Insights for Culver City
- The most common availability pattern in Culver City falls within the 181-270 days range, representing 31.2% of listings. This suggests many properties have significant open periods on their calendars.
- Approximately 53.0% of listings show high availability (181+ days open annually), indicating potential for increased bookings or specific owner usage patterns.
- For booked days, the 91-180 days range is most frequent in Culver City (31.9%), reflecting common guest stay durations or potential owner blocking patterns.
- A notable 48.2% of properties secure long booking periods (181+ days booked per year), highlighting successful long-term rental strategies or significant owner usage.
Culver City Airbnb Minimum Stay Requirements Analysis
Distribution of Listings by Minimum Night Requirement
1 Night
113 listings
25.9% of total
2 Nights
110 listings
25.2% of total
3 Nights
31 listings
7.1% of total
4-6 Nights
26 listings
6% of total
7-29 Nights
21 listings
4.8% of total
30+ Nights
135 listings
31% of total
Key Insights
- The most prevalent minimum stay requirement in Culver City is 30+ Nights, adopted by 31% of listings. This highlights the market's preference for longer commitments.
- A significant segment (31%) caters to monthly stays (30+ nights) in Culver City, pointing to opportunities in the extended-stay market.
Recommendations
- Align with the market by considering a 30+ Nights minimum stay, as 31% of Culver City hosts use this setting.
- If feasible, allowing 1-night stays, especially midweek or during low season, could capture last-minute bookings, as only 25.9% currently do.
- Explore offering discounts for stays of 30+ nights to attract the 31% of the market seeking extended stays.
- Adjust minimum nights based on seasonality – potentially shorter during low season and longer during peak demand periods in Culver City.
Culver City Airbnb Cancellation Policy Trends Analysis (2026)
Super Strict 30 Days
1 listings
0.2% of total
Limited
5 listings
1.1% of total
Super Strict 60 Days
5 listings
1.1% of total
Flexible
50 listings
11.5% of total
Moderate
117 listings
26.9% of total
Firm
165 listings
37.9% of total
Strict
92 listings
21.1% of total
Cancellation Policy Insights for Culver City
- The prevailing Airbnb cancellation policy trend in Culver City is Firm, used by 37.9% of listings.
- A majority (59.0%) of hosts in Culver City utilize Firm or Strict policies, indicating a market where hosts prioritize booking security.
Recommendations for Hosts
- Consider adopting a Firm policy to align with the 37.9% market standard in Culver City.
- Regularly review your cancellation policy against competitors and market demand shifts in Culver City.
Culver City STR Booking Lead Time Analysis (2026)
Average Booking Lead Time by Month
Booking Lead Time Insights for Culver City
- The overall average booking lead time for vacation rentals in Culver City is 30 days.
- Guests book furthest in advance for stays during August (average 39 days), likely coinciding with peak travel demand or local events.
- The shortest booking windows occur for stays in February (average 20 days), indicating more last-minute travel plans during this time.
- Seasonally, Summer (36 days avg.) sees the longest lead times, while Winter (28 days avg.) has the shortest, reflecting typical travel planning cycles.
Recommendations for Hosts
- Use the overall average lead time (30 days) as a baseline for your pricing and availability strategy in Culver City.
- Target marketing efforts for the Summer season well in advance (at least 36 days) to capture early planners.
- Monitor your own booking lead times against these Culver City averages to identify opportunities for dynamic pricing adjustments.
Popular & Essential Airbnb Amenities in Culver City (2026)
Amenity Prevalence
Amenity Insights for Culver City
- Essential amenities in Culver City that guests expect include: Wifi, Smoke alarm. Lacking these (any) could significantly impact bookings.
- Popular amenities like Heating, Hot water, TV are common but not universal. Offering these can provide a competitive edge.
Recommendations for Hosts
- Ensure your listing includes all essential amenities for Culver City: Wifi, Smoke alarm.
- Prioritize adding missing essentials: Wifi, Smoke alarm.
- Consider adding popular differentiators like Heating or Hot water to increase appeal.
- Highlight unique or less common amenities you offer (e.g., hot tub, dedicated workspace, EV charger) in your listing description and photos.
- Regularly check competitor amenities in Culver City to stay competitive.
Culver City Airbnb Guest Demographics & Profile Analysis (2026)
Guest Profile Summary for Culver City
- The typical guest profile for Airbnb in Culver City consists of primarily domestic travelers (82%), often arriving from nearby Los Angeles, typically belonging to the Post-2000s (Gen Z/Alpha) group (50%), primarily speaking English or Spanish.
- Domestic travelers account for 81.5% of guests.
- Key international markets include United States (81.5%) and United Kingdom (2.5%).
- Top languages spoken are English (58.8%) followed by Spanish (15.8%).
- A significant demographic segment is the Post-2000s (Gen Z/Alpha) group, representing 50% of guests.
Recommendations for Hosts
- Target domestic marketing efforts towards travelers from Los Angeles and New York.
- Tailor amenities and listing descriptions to appeal to the dominant Post-2000s (Gen Z/Alpha) demographic (e.g., highlight fast WiFi, smart home features, local guides).
- Highlight unique local experiences or amenities relevant to the primary guest profile.
- Consider seasonal promotions aligned with peak travel times for key origin markets.
Nearby Short-Term Rental Market Comparison
How does the Culver City Airbnb market stack up against its neighbors? Compare key performance metrics like average monthly revenue, ADR, and occupancy rates in surrounding areas to understand the broader regional STR landscape.
| Market | Active Properties | Monthly Revenue | Daily Rate | Avg. Occupancy |
|---|---|---|---|---|
| Montecito | 127 | $10,744 | $950.35 | 51% |
| Newport Beach | 1,273 | $8,950 | $744.06 | 47% |
| Malibu | 251 | $8,293 | $1263.89 | 35% |
| Manhattan Beach | 267 | $7,875 | $585.30 | 53% |
| Toro Canyon | 33 | $6,935 | $717.58 | 42% |
| Avalon | 249 | $6,705 | $696.60 | 38% |
| Summerland | 88 | $6,323 | $494.72 | 49% |
| Rancho Santa Fe | 34 | $6,074 | $913.16 | 35% |
| Unincorporated Santa Monica Mountains | 119 | $6,008 | $699.60 | 38% |
| Encinitas | 559 | $5,940 | $543.93 | 49% |